نقش مهار کنندههای آلفا‐گلوکوزیداز در پیشگیری یا به تاخیر انداختن بروز دیابت ملیتوس نوع 2 و عوارض مرتبط با آن در افراد در معرض خطر بالای ابتلا به دیابت ملیتوس نوع 2
Referencias
منابع مطالعات واردشده در این مرور
منابع مطالعات خارجشده از این مرور
منابع مطالعات در انتظار ارزیابی
منابع اضافی
منابع دیگر نسخههای منتشرشده این مرور
Characteristics of studies
Characteristics of included studies [ordered by study ID]
| Methods | Parallel RCT, randomisation ratio 1:1, superiority design | |
| Participants | Inclusion criteria: individuals with clinically overt MI, 21‐79 years old with IGT (fasting plasma glucose levels of ≤ 7.0 mmol/L, a 2‐h OGTT value of between 7.8‐11.1 mmol/L, and HbA1c levels of ≤ 6.5%) Exclusion criteria: acute MI occurring within the last 7 d; patients with NYHA symptoms of ≥ class II or with a LVEF of ≤ 40%; suspected type I DM; patients scheduled for coronary angioplasty; history of coronary artery bypass graft surgery; serious liver or kidney damage; history of allergy or drug hypersensitivity; arteriosclerosis obliterans with Fontaine stage III or worse; and inability to understand and/or comply with trial medications, procedures, and/or follow‐up or any conditions that may render the participant unable to complete the trial in the opinion of the investigator Diagnostic criteria: FPG ≤ 7.0 mmol/L and 2hPG of 7.8‐11.1 mmol/L (WHO/IDF 2006) HbA1c ≤ 6.5% | |
| Interventions | Number of trial centres: 112 Run‐in period: no Extension period: no Intervention: AGI: 0.2 mg voglibose 3 times/d (in the event of gastrointestinal side effects the dosage was reduced to half or a quarter of the original dosage) Control: diet and exercise therapy | |
| Outcomes | Composite outcome measures reported: yes, the time until the first cardiovascular composite endpoint of death from cardiovascular death, hospitalisation due to non‐fatal MI, non‐fatal unstable angina, non‐fatal stroke, or treatment with coronary revascularisation (percutaneous coronary intervention or coronary artery bypass graft) | |
| Study details | Trial terminated early (because of lack of benefit): yes Trial ID:NCT00212017 | |
| Publication details | Language of publication: English Funding: non‐commercial funding Publication status: peer‐reviewed journal | |
| Stated aim for study | Quote from publication: "... to evaluate effects of aggressive intervention with the alpha‐glucose inhibitor voglibose on cardiovascular events in patients with IGT and a history of MI" | |
| Notes | ‐ | |
| Risk of bias | ||
| Bias | Authors' judgement | Support for judgement |
| Random sequence generation (selection bias) | Low risk | Quote: "All patients were randomly assigned (1:1) through a web‐based central randomisation system using computer‐generated random numbers (NTT Data, Tokyo, Japan)" |
| Allocation concealment (selection bias) | Low risk | Quote: "This study was open‐labeled, and allocation was unmasked to the patients and investigators, but masked to the event adjudication committee and the data and safety monitoring board (DSMB)" |
| Blinding of participants and personnel (performance bias) | Low risk | Comment: open‐label, but we judged the outcome unlikely to be influenced by lack of blinding |
| Blinding of participants and personnel (performance bias) | Low risk | Comment: open‐label, but we judged the outcome unlikely to be influenced by lack of blinding |
| Blinding of participants and personnel (performance bias) | Low risk | Comment: open‐label, but we judged the outcome unlikely to be influenced by lack of blinding |
| Blinding of participants and personnel (performance bias) | High risk | Comment: open‐label |
| Blinding of outcome assessment (detection bias) | Low risk | Quote: "...allocation was [...] masked to the event adjudication committee and the data and safety monitoring board (DSMB)" |
| Blinding of outcome assessment (detection bias) | Low risk | Quote: "...allocation was [...] masked to the event adjudication committee and the data and safety monitoring board (DSMB)" |
| Blinding of outcome assessment (detection bias) | Low risk | Quote: "...allocation was [...] masked to the event adjudication committee and the data and safety monitoring board (DSMB)" |
| Blinding of outcome assessment (detection bias) | Low risk | Quote: "...allocation was [...] masked to the event adjudication committee and the data and safety monitoring board (DSMB)" |
| Incomplete outcome data (attrition bias) | Low risk | Comment: 424 completers and 4 dropouts in treatment group, 435 completers and 4 dropouts in control group. Dropout rate is < 15%. Difference in dropout rates between groups < 10% |
| Incomplete outcome data (attrition bias) | Low risk | Comment: 424 completers and 4 dropouts in treatment group, 435 completers and 4 dropouts in control group. Dropout rate is < 15%. Difference in dropout rates between groups < 10% |
| Incomplete outcome data (attrition bias) | Low risk | Comment: 424 completers and 4 dropouts in treatment group, 435 completers and 4 dropouts in control group. Dropout rate is < 15%. Difference in dropout rates between groups < 10% |
| Incomplete outcome data (attrition bias) | Low risk | Comment: 424 completers and 4 dropouts in treatment group, 435 completers and 4 dropouts in control group. Dropout rate is < 15%. Difference in dropout rates between groups < 10% |
| Selective reporting (reporting bias) | High risk | Comment: the secondary outcomes mentioned in the trial register were slightly different in the publication (all‐cause mortality; hospitalisation due to heart failure, CAD, and cerebrovascular disease; progression of IGT to diabetes; development or deterioration of hypertension or hyperlipidaemia; and deterioration of renal function), compared to: all‐cause mortality; hospitalisation due to heart failure; death from cardiovascular disease, non‐fatal myocardial infarction, non‐fatal unstable angina, treatment with coronary revascularisation, non‐fatal stroke) |
| Other bias | High risk | Comment: the trial was terminated early and the main researchers received grants and personal fees from Pfizer and Takeda. |
| Methods | Parallel RCT, randomisation ratio 1:1, superiority design | |
| Participants | Inclusion criteria:
Exclusion criteria:
Diagnostic criteria: FPG < 7.0 mmol/L and 2hPG of 7.8‐11.1 mmol/L (WHO/IDF 2006) | |
| Interventions | Number of study centres: 176 Run‐in period: 4 weeks with placebo medication, optimisation of cardiovascular therapy, and provision of lifestyle advice with respect to diet, exercise, and smoking Extension period: no Intervention: AGI: 50 mg acarbose 3 times/d with meals Control: placebo 3 times/d with meals | |
| Outcomes | Composite outcome measures reported: yes, a 5‐point composite of cardiovascular death, non‐fatal MI, non‐fatal stroke, hospital admission for unstable angina, and hospital admission for heart failure | |
| Study details | Trial terminated early: no Trial ID:NCT00829660 | |
| Publication details | Language of publication: English Funding: commercial funding (Bayer) Publication status: peer‐reviewed journal | |
| Stated aim for study | Quote from publication: "The Acarbose Cardiovascular Evaluation (ACE) trial was designed to examine whether acarbose could reduce cardiovascular events in Chinese patients with established coronary heart disease and IGT, and whether the incidence of type 2 diabetes could be reduced" | |
| Notes | ‐ | |
| Risk of bias | ||
| Bias | Authors' judgement | Support for judgement |
| Random sequence generation (selection bias) | Low risk | Quote: "Participants were randomly assigned (1:1) by a centralised computer system to receive either acarbose or to matching placebo, in blocks of eight within site. The randomisation sequence (coded as A or B) was generated by a Diabetes Trials Unit statistician unconnected to the trial and uploaded to the electronic Rave Trial Management System (rTMS)" |
| Allocation concealment (selection bias) | Low risk | Quote: "Acarbose and matching placebo tablets were provided by Bayer AG, packaged in 4‐month quantities, each packet being labelled with a unique code. These codes were also uploaded to the rTMS with their corresponding A or B categorisation, which was not visible to study staff" |
| Blinding of participants and personnel (performance bias) | Low risk | Comment: double‐blind, using a matched placebo |
| Blinding of participants and personnel (performance bias) | Low risk | Comment: double‐blind, using a matched placebo |
| Blinding of participants and personnel (performance bias) | Low risk | Comment: double‐blind, using a matched placebo |
| Blinding of participants and personnel (performance bias) | Low risk | Comment: double‐blind, using a matched placebo |
| Blinding of participants and personnel (performance bias) | Low risk | Comment: double‐blind, using a matched placebo |
| Blinding of participants and personnel (performance bias) | Low risk | Comment: double‐blind, using a matched placebo |
| Blinding of participants and personnel (performance bias) | Low risk | Comment: double‐blind, using a matched placebo |
| Blinding of outcome assessment (detection bias) | Low risk | Quote: "Potential cardiovascular endpoint events were reviewed and adjudicated by an independent cardiovascular endpoint adjudication committee, which was masked to treatment allocation" |
| Blinding of outcome assessment (detection bias) | Low risk | Quote: "...at subsequent study visits, investigators were instructed by the rTMS which study medication packet should be given to each participant. They were required to enter two letters printed alongside the unique code on the packet label so that the rTMS could confirm the correct study medication had been dispensed. Up until database lock, the assignation of A or B to active or placebo was known only to the Bayer AG study medication packaging group and the data and safety monitoring board" |
| Blinding of outcome assessment (detection bias) | Low risk | Quote: "An independent diabetes endpoint adjudication committee masked to treatment group allocation reviewed cases in which diabetes was diagnosed, or in which participants were commenced on other glucose‐lowering drugs, outside of the trial to decide if a diagnosis of diabetes was warranted" |
| Blinding of outcome assessment (detection bias) | Low risk | Quote: "...at subsequent study visits, investigators were instructed by the rTMS which study medication packet should be given to each participant. They were required to enter two letters printed alongside the unique code on the packet label so that the rTMS could confirm the correct study medication had been dispensed. Up until database lock, the assignation of A or B to active or placebo was known only to the Bayer AG study medication packaging group and the data and safety monitoring board" |
| Blinding of outcome assessment (detection bias) | Low risk | Quote: "Potential cardiovascular endpoint events were reviewed and adjudicated by an independent cardiovascular endpoint adjudication committee, which was masked to treatment allocation" |
| Blinding of outcome assessment (detection bias) | Low risk | Quote: "...at subsequent study visits, investigators were instructed by the rTMS which study medication packet should be given to each participant. They were required to enter two letters printed alongside the unique code on the packet label so that the rTMS could confirm the correct study medication had been dispensed. Up until database lock, the assignation of A or B to active or placebo was known only to the Bayer AG study medication packaging group and the data and safety monitoring board" |
| Blinding of outcome assessment (detection bias) | Low risk | Quote: "...at subsequent study visits, investigators were instructed by the rTMS which study medication packet should be given to each participant. They were required to enter two letters printed alongside the unique code on the packet label so that the rTMS could confirm the correct study medication had been dispensed. Up until database lock, the assignation of A or B to active or placebo was known only to the Bayer AG study medication packaging group and the data and safety monitoring board" |
| Incomplete outcome data (attrition bias) | Low risk | 3092 completers and 180 dropouts in treatment group, 3064 completers and 186 dropouts in control group. Dropout rate is < 15%. Difference in dropout rates between groups < 10% |
| Incomplete outcome data (attrition bias) | Low risk | 3092 completers and 180 dropouts in treatment group, 3064 completers and 186 dropouts in control group. Dropout rate is < 15%. Difference in dropout rates between groups < 10% |
| Incomplete outcome data (attrition bias) | Low risk | 3092 completers and 180 dropouts in treatment group, 3064 completers and 186 dropouts in control group. Dropout rate is < 15%. Difference in dropout rates between groups < 10% |
| Incomplete outcome data (attrition bias) | Low risk | 3092 completers and 180 dropouts in treatment group, 3064 completers and 186 dropouts in control group. Dropout rate is < 15%. Difference in dropout rates between groups < 10% |
| Incomplete outcome data (attrition bias) | Low risk | 3092 completers and 180 dropouts in treatment group, 3064 completers and 186 dropouts in control group. Dropout rate is < 15%. Difference in dropout rates between groups < 10% |
| Incomplete outcome data (attrition bias) | Low risk | 3092 completers and 180 dropouts in treatment group, 3064 completers and 186 dropouts in control group. Dropout rate is < 15%. Difference in dropout rates between groups < 10% |
| Incomplete outcome data (attrition bias) | Low risk | 3092 completers and 180 dropouts in treatment group, 3064 completers and 186 dropouts in control group. Dropout rate is < 15%. Difference in dropout rates between groups < 10% |
| Selective reporting (reporting bias) | Low risk | Comment: no changes between design paper and final publication, except for the original primary composite cardiovascular outcome, a 3‐point MACE outcome, which was changed to a 5‐point major cardiovascular event, but this change was explained in the final publication |
| Other bias | High risk | Comment: the main researcher received grants from Bayer |
| Methods | Parallel RCT, randomisation ratio 1:1, superiority design | |
| Participants | Inclusion criteria: IGT (a mean fasting plasma glucose level > 5.5 mmol/L and < 7.8 mmol/L, a mean 2‐h PG level of 8.6‐11.1 mmol/L, an HbA1c level ≤ 7.0% and aged 45–70 years) Exclusion criteria: diseases or conditions likely to prevent completion of the study, known uncorrected endocrine disorders, documented gastrointestinal diseases, cholesterol > 10 mmol/L or triglycerides > 10 mmol/L, treatment with lipid‐lowering medication (with the exception of statins), MI within the previous 6 months, impaired liver function (AST/ALT > 50 units/L), or impaired kidney function (creatinine > 150 mmol/L) Diagnostic criteria: FPG < 7.8 mmol/L (WHO 1985) | |
| Interventions | Number of study centres: single centre Run‐in period: a qualification period over 6 weeks with acarbose treatment for all participants, and a wash‐out period over 4 weeks with placebo treatment for all participants Extension period: no Intervention: AGI: 50 mg acarbose 3 times/d Control: placebo 3 times/d | |
| Outcomes | Composite outcome measures reported: no | |
| Study details | Trial terminated early: no Trial ID:NTR150 | |
| Publication details | Language of publication: English Funding: commercial funding (Bayer) Publication status: peer‐reviewed journal | |
| Stated aim for study | Quote from publication: "To investigate the effects of acarbose on the distribution of the 2‐h plasma glucose level following an intake of 75 g of glucose, the incidence of conversion to type 2 dm, on insulin secretion induced by hyperglycemia and on insulin sensitivity" | |
| Notes | ‐ | |
| Risk of bias | ||
| Bias | Authors' judgement | Support for judgement |
| Random sequence generation (selection bias) | Low risk | Quote: "Study numbers were randomly assigned to the placebo or the acarbose group generated by a computer at Bayer’s biometric unit. The numbers were assigned in ascending order in the sequence of the subject’s entry into the intervention study." |
| Allocation concealment (selection bias) | Low risk | Quote: "Study numbers were randomly assigned to the placebo or the acarbose group generated by a computer at Bayer’s biometric unit. The numbers were assigned in ascending order in the sequence of the subject’s entry into the intervention study." |
| Blinding of participants and personnel (performance bias) | Low risk | Quote: "Double‐blind. [...] Placebo tablets matched the acarbose tablets in size, shape, and colour" |
| Blinding of participants and personnel (performance bias) | Low risk | Quote: "Double‐blind. [...] Placebo tablets matched the acarbose tablets in size, shape, and colour" |
| Blinding of participants and personnel (performance bias) | Low risk | Quote: "Double‐blind. [...] Placebo tablets matched the acarbose tablets in size, shape, and colour" |
| Blinding of participants and personnel (performance bias) | Low risk | Quote: "Double‐blind. [...] Placebo tablets matched the acarbose tablets in size, shape, and colour" |
| Blinding of participants and personnel (performance bias) | Low risk | Quote: "Double‐blind. [...] Placebo tablets matched the acarbose tablets in size, shape, and colour" |
| Blinding of participants and personnel (performance bias) | Low risk | Quote: "Double‐blind. [...] Placebo tablets matched the acarbose tablets in size, shape, and colour" |
| Blinding of outcome assessment (detection bias) | Low risk | Quote: "The identity of the treatment groups was concealed until the final statistical analysis" |
| Blinding of outcome assessment (detection bias) | Low risk | Quote: "The identity of the treatment groups was concealed until the final statistical analysis" |
| Blinding of outcome assessment (detection bias) | Low risk | Quote: "The identity of the treatment groups was concealed until the final statistical analysis" |
| Blinding of outcome assessment (detection bias) | Low risk | Quote: "The identity of the treatment groups was concealed until the final statistical analysis" |
| Blinding of outcome assessment (detection bias) | Low risk | Quote: "The identity of the treatment groups was concealed until the final statistical analysis" |
| Blinding of outcome assessment (detection bias) | Low risk | Quote: "The identity of the treatment groups was concealed until the final statistical analysis" |
| Incomplete outcome data (attrition bias) | High risk | Comment: 30 completers and 30 dropouts in treatment group, 36 completers and 22 dropouts in control group. Dropout rate is > 15%. Difference in dropout rates between groups > 10% |
| Incomplete outcome data (attrition bias) | High risk | Comment: 30 completers and 30 dropouts in treatment group, 36 completers and 22 dropouts in control group. Dropout rate is > 15%. Difference in dropout rates between groups > 10% |
| Incomplete outcome data (attrition bias) | High risk | Comment: 30 completers and 30 dropouts in treatment group, 36 completers and 22 dropouts in control group. Dropout rate is > 15%. Difference in dropout rates between groups > 10% |
| Incomplete outcome data (attrition bias) | High risk | Comment: 30 completers and 30 dropouts in treatment group, 36 completers and 22 dropouts in control group. Dropout rate is > 15%. Difference in dropout rates between groups > 10% |
| Incomplete outcome data (attrition bias) | High risk | Comment: 30 completers and 30 dropouts in treatment group, 36 completers and 22 dropouts in control group. Dropout rate is > 15%. Difference in dropout rates between groups > 10% |
| Incomplete outcome data (attrition bias) | High risk | Comment: 30 completers and 30 dropouts in treatment group, 36 completers and 22 dropouts in control group. Dropout rate is > 15%. Difference in dropout rates between groups > 10% |
| Selective reporting (reporting bias) | Low risk | Comment: outcomes in trial register and publications are the same |
| Other bias | Unclear risk | Comment: possible funding bias |
| Methods | Factorial RCT, randomisation ratio 1:1, superiority design | |
| Participants | Inclusion criteria: 30‐70 years, "at risk for developing diabetes", 2 consecutive FPG levels of 5.5‐7.7 mmol/L Exclusion criteria: unclear Diagnostic criteria: FPG: 5.5 to 7.7 mmol/L | |
| Interventions | Number of study centres: 9 Run‐in period: unclear Extension period: no Intervention: AGI: 50 mg acarbose 3 times/d + placebo 3 times/d Control 1: placebo 3 times/d + placebo 3 times/d Control 2: 500 mg metformin 3 times/d + placebo 3 times/d Control 3: 500 mg metformin 3 times/d + 50 mg acarbose 3 times/d | |
| Outcomes | Composite outcome measures reported: no | |
| Study details | Trial terminated early: no Trial ID:ISRCTN96631607 | |
| Publication details | Language of publication: English Funding: commercial funding (Bayer and Merck‐Lipha) Publication status: other (website, abstracts) | |
| Stated aim for study | Quote from publication: "…to determine whether deterioration in glycaemic tolerance towards diabetes can be delayed or prevented using acarbose or metformin" | |
| Notes | ‐ | |
| Risk of bias | ||
| Bias | Authors' judgement | Support for judgement |
| Random sequence generation (selection bias) | Unclear risk | Comment: unclear |
| Allocation concealment (selection bias) | Unclear risk | Comment: unclear |
| Blinding of participants and personnel (performance bias) | Unclear risk | Quote: "Double‐blind" Comment: not enough information |
| Blinding of participants and personnel (performance bias) | Low risk | Quote: "Double‐blind" Comment: not enough information, but we judged the outcome unlikely to be influenced by lack of blinding |
| Blinding of participants and personnel (performance bias) | Low risk | Quote: "Double‐blind" Comment: not enough information, but we judged the outcome unlikely to be influenced by lack of blinding |
| Blinding of participants and personnel (performance bias) | Unclear risk | Quote: "Double‐blind" Comment: not enough information |
| Blinding of outcome assessment (detection bias) | Low risk | Comment: unclear, but we judged the outcome unlikely to be influenced by lack of blinding |
| Blinding of outcome assessment (detection bias) | Low risk | Comment: unclear, but we judged the outcome unlikely to be influenced by lack of blinding |
| Blinding of outcome assessment (detection bias) | Unclear risk | Comment: unclear |
| Incomplete outcome data (attrition bias) | Unclear risk | Comment: unclear |
| Incomplete outcome data (attrition bias) | Unclear risk | Comment: unclear |
| Incomplete outcome data (attrition bias) | Unclear risk | Comment: unclear |
| Incomplete outcome data (attrition bias) | Unclear risk | Comment: unclear |
| Selective reporting (reporting bias) | High risk | Comment: trial was finished over 10 years ago and has still not been published |
| Other bias | Unclear risk | Comment: possible funding bias |
| Methods | Parallel, 2x2 factorial RCT, randomisation ratio 1:1, superiority design | |
| Participants | Inclusion criteria: IGT in accordance with the diagnostic criteria of DM set by WHO in 1985 Exclusion criteria: severe somatological disease, mental disease or history of mental disease, severe intellectual or cognitive disorders, drug or alcohol dependence Diagnostic criteria: FPG < 7.8 mmol/L and/or 2hPG of 7.8 mmol/L‐11.1 mmol/L (WHO 1985) | |
| Interventions | Number of study centres: single centre Run‐in period: no Extension period: no Intervention: AGI: 25‐50 mg acarbose 3 times/d Control 1: no intervention ("common DM prevention education") Control 2: 125 to 250 mg flumamine (= metformin) 3 times/d Control 3: diet and exercise | |
| Outcomes | Composite outcome measures reported: no | |
| Study details | Trial terminated early: no Trial ID: ‐ | |
| Publication details | Language of publication: Chinese Funding: unclear Publication status: peer‐reviewed journal | |
| Stated aim for study | Quote from publication: "To observe influence of medicine intervention and non‐medicine intervention on the outcomes of the crowd with impaired glucose tolerance (IGT), and explore which intervention can prevent IGT from developing to diabetes mellitus more effectively" | |
| Notes | ‐ | |
| Risk of bias | ||
| Bias | Authors' judgement | Support for judgement |
| Random sequence generation (selection bias) | Unclear risk | Comment: trialists used random number table method, but there was baseline imbalance, which suggests randomisation was not adequate. |
| Allocation concealment (selection bias) | Unclear risk | Comment: not enough details |
| Blinding of participants and personnel (performance bias) | Low risk | Comment: unclear, but we judged the outcome unlikely to be influenced by lack of blinding |
| Blinding of participants and personnel (performance bias) | Low risk | Comment: unclear, but we judged the outcome unlikely to be influenced by lack of blinding |
| Blinding of participants and personnel (performance bias) | Low risk | Comment: unclear, but we judged the outcome unlikely to be influenced by lack of blinding |
| Blinding of outcome assessment (detection bias) | Low risk | Comment: unclear, but we judged the outcome unlikely to be influenced by lack of blinding |
| Blinding of outcome assessment (detection bias) | Low risk | Comment: unclear, but we judged the outcome unlikely to be influenced by lack of blinding |
| Blinding of outcome assessment (detection bias) | Low risk | Comment: unclear, but we judged the outcome unlikely to be influenced by lack of blinding |
| Incomplete outcome data (attrition bias) | Low risk | Comment: 45 completers and 5 dropouts in the treatment group, 35 completers and 5 dropouts in the no‐intervention group, 44 completers and 4 dropouts in the metformin group, and 36 completers and 4 dropouts in the diet and exercise group. Dropout rate is < 15%. Difference in dropout rates between groups < 10% |
| Incomplete outcome data (attrition bias) | Low risk | Comment: 45 completers and 5 dropouts in the treatment group, 35 completers and 5 dropouts in the no‐intervention group, 44 completers and 4 dropouts in the metformin group, and 36 completers and 4 dropouts in the diet and exercise group. Dropout rate is < 15%. Difference in dropout rates between groups < 10% |
| Incomplete outcome data (attrition bias) | Low risk | Comment: 45 completers and 5 dropouts in the treatment group, 35 completers and 5 dropouts in the no‐intervention group, 44 completers and 4 dropouts in the metformin group, and 36 completers and 4 dropouts in the diet and exercise group. Dropout rate is < 15%. Difference in dropout rates between groups < 10% |
| Selective reporting (reporting bias) | Unclear risk | Comment: no protocol available |
| Other bias | Low risk | Comment: no other bias determined |
| Methods | Parallel RCT, randomisation ratio 1:1, superiority design | |
| Participants | Inclusion criteria: IGT:
≥ 1 of the following risk factors for T2DM:
Exclusion criteria: diabetes or a disease likely to impair glucose tolerance Diagnostic criteria: FPG < 6.9 mmol/L and 2hPG of 7.8‐11.0 mmol/L (WHO/IDF 2006) | |
| Interventions | Number of study centres: 103 Japanese institutions Run‐in period: 4‐week observation. Moreover, "4–8 weeks before the start of treatment, each person was given advice about appropriate nutrition and exercise programmes (interview, survey of lifestyle, and individualised guidance on future lifestyle habits based on intensity of daily activity categories defined by the Japanese Ministry of Health and Labour)" Extension period: no Intervention: AGI: 0.2 mg voglibose 3 times/d Control: placebo 3 times/d Additional therapy: participants were given advice about appropriate nutrition and exercise programmes (interview, survey of lifestyle, and individualised guidance on future lifestyle habits based on intensity of daily activity categories defined by the Japanese Ministry of Health and Labour) and adherence to these was assessed at each visit. | |
| Outcomes | Composite outcome measures reported: no | |
| Study details | Trial terminated early (for benefit): yes Trial ID:UMIN000001109 | |
| Publication details | Language of publication: English Funding: non‐commercial funding Publication status: peer‐reviewed journal | |
| Stated aim for study | Quote from publication: "We therefore investigated the effectiveness of voglibose, an α‐glucosidase inhibitor that reduces diurnal insulin secretion, for prevention of the development of type 2 diabetes in Japanese patients with impaired glucose tolerance" | |
| Notes | ‐ | |
| Risk of bias | ||
| Bias | Authors' judgement | Support for judgement |
| Random sequence generation (selection bias) | Low risk | Quote: "Randomisation was done with a stratified allocation procedure designed to balance the two treatment groups in each institution with respect to the number of risk factors (≤ 2 or ≥ 3), which were hypertension or high normal blood pressure, dyslipidaemia, obesity, a family history of diabetes, and a 2hPG greater than 9.4 mmol/L (a concentration associated with an increased risk of developing type 2 diabetes in Japan) to 11.0 mmol/L. An independent statistician computer‐generated the random sequence and this was maintained securely until the study was unmasked" |
| Allocation concealment (selection bias) | Low risk | Quote: "Allocation was concealed with sealed opaque envelopes" |
| Blinding of participants and personnel (performance bias) | Low risk | Comment: double‐blind, with an identical‐looking placebo |
| Blinding of participants and personnel (performance bias) | Low risk | Comment: double‐blind, with an identical‐looking placebo |
| Blinding of participants and personnel (performance bias) | Low risk | Comment: double‐blind, with an identical‐looking placebo |
| Blinding of participants and personnel (performance bias) | Low risk | Comment: double‐blind, with an identical‐looking placebo |
| Blinding of participants and personnel (performance bias) | Low risk | Comment: double‐blind, with an identical‐looking placebo |
| Blinding of outcome assessment (detection bias) | Low risk | Comment: unclear, but we judged the outcome unlikely to be influenced by lack of blinding |
| Blinding of outcome assessment (detection bias) | Low risk | Comment: unclear, but we judged the outcome unlikely to be influenced by lack of blinding |
| Blinding of outcome assessment (detection bias) | Low risk | Comment: unclear, but we judged the outcome unlikely to be influenced by lack of blinding |
| Blinding of outcome assessment (detection bias) | Unclear risk | Comment: unclear |
| Blinding of outcome assessment (detection bias) | Low risk | Comment: unclear, but we judged the outcome unlikely to be influenced by lack of blinding |
| Incomplete outcome data (attrition bias) | High risk | Comment: 768 completers and 129 dropouts in the treatment group, 737 completers and 146 dropouts in the control group. Dropout rate is > 15%. Difference in dropout rates between groups < 10% |
| Incomplete outcome data (attrition bias) | High risk | Comment: 768 completers and 129 dropouts in the treatment group, 737 completers and 146 dropouts in the control group. Dropout rate is > 15%. Difference in dropout rates between groups < 10% |
| Incomplete outcome data (attrition bias) | High risk | Comment: 768 completers and 129 dropouts in the treatment group, 737 completers and 146 dropouts in the control group. Dropout rate is > 15%. Difference in dropout rates between groups < 10% |
| Incomplete outcome data (attrition bias) | High risk | Comment: 768 completers and 129 dropouts in the treatment group, 737 completers and 146 dropouts in the control group. Dropout rate is > 15%. Difference in dropout rates between groups < 10% |
| Incomplete outcome data (attrition bias) | High risk | Comment: 768 completers and 129 dropouts in the treatment group, 737 completers and 146 dropouts in the control group. Dropout rate is > 15%. Difference in dropout rates between groups < 10% |
| Selective reporting (reporting bias) | High risk | Comment: data were not reported for some measured outcomes (FPG, HbA1c, triglycerides, total cholesterol, HDL‐cholesterol, blood pressure, and body weight) |
| Other bias | High risk | Comment: the trial was terminated early |
| Methods | Parallel RCT, randomisation ratio 1:1, superiority design | |
| Participants | Inclusion criteria: stable angina pectoris, CAD (≥ 50% stenosis on quantitative coronary angiography), and newly diagnosed IGT or mild T2DM Exclusion criteria: age > 70 years, active inflammatory disease, previous treatment with antidiabetic agents, a previous diagnosis of DM, HbA1c ≥ 6.5%, previous cerebrovascular disease, acute coronary syndrome, renal dysfunction (serum creatinine > 1.5 mg/dL), and history or presence of cancer Diagnostic criteria: IGT: FPG < 7 mmol/L and 2hPG 7.77 to 11.05 mmol/L (WHO/IDF 2006) | |
| Interventions | Number of study centres: single centre Run‐in period: no Extension period: no Intervention: AGI: 50 mg acarbose 3 times/d Control: no intervention Additional therapy: participants were encouraged to exercise, stop smoking, restrict fat intake, increase dietary fibre intake, and reduce between‐meal snacks | |
| Outcomes | Composite outcome measures reported: no | |
| Study details | Trial terminated early: no Trial ID:UMIN000000544 | |
| Publication details | Language of publication: English Funding: non‐commercial funding Publication status: peer‐reviewed journal | |
| Stated aim for study | Quote from publication: "The present study examined the effect of acarbose therapy on carotid IMT in patients with established CAD who had been newly diagnosed with IGT or mild T2DM" | |
| Notes | ‐ | |
| Risk of bias | ||
| Bias | Authors' judgement | Support for judgement |
| Random sequence generation (selection bias) | Unclear risk | Quote: "Randomization was performed using a simple sealed‐envelope method" Comment: not enough information |
| Allocation concealment (selection bias) | Unclear risk | Quote: "Randomization was performed using a simple sealed‐envelope method." Comment: not enough information |
| Blinding of participants and personnel (performance bias) | Low risk | Quote: "This was a 1‐year, prospective, randomised, open‐label, parallel‐group study..." Comment: we judged the outcome unlikely to be influenced by lack of blinding |
| Blinding of participants and personnel (performance bias) | Low risk | Quote: "This was a 1‐year, prospective, randomised, open‐label, parallel‐group study..." Comment: we judged the outcome unlikely to be influenced by lack of blinding |
| Blinding of participants and personnel (performance bias) | Low risk | Quote: "This was a 1‐year, prospective, randomised, open‐label, parallel‐group study..." Comment: we judged the outcome unlikely to be influenced by lack of blinding |
| Blinding of outcome assessment (detection bias) | Low risk | Quote: "The primary and secondary end points were evaluated by blinded evaluators" |
| Blinding of outcome assessment (detection bias) | Low risk | Quote: "The primary and secondary end points were evaluated by blinded evaluators" |
| Blinding of outcome assessment (detection bias) | Low risk | Quote: "The primary and secondary end points were evaluated by blinded evaluators" |
| Incomplete outcome data (attrition bias) | Low risk | Comment: 42 completers and 3 dropouts in the treatment group, 39 completers and 6 dropouts in the control group. Dropout rate is < 15%. Difference in dropout rates between groups < 10% |
| Incomplete outcome data (attrition bias) | Low risk | Comment: 42 completers and 3 dropouts in the treatment group, 39 completers and 6 dropouts in the control group. Dropout rate is < 15%. Difference in dropout rates between groups < 10% |
| Incomplete outcome data (attrition bias) | Low risk | Comment: 42 completers and 3 dropouts in the treatment group, 39 completers and 6 dropouts in the control group. Dropout rate is < 15%. Difference in dropout rates between groups < 10% |
| Selective reporting (reporting bias) | High risk | Comment: the primary outcomes in the trial register are: the incidence of cardiovascular events (defined as "new onset myocardial infarction, worsening anginal status and/or angiographic restenosis") and the carotid intima‐medial thickness (IMT). In the publication the only primary outcome is the change in IMT measured in the right and left common carotid arteries. There are also differences in the secondary outcomes |
| Other bias | Low risk | Comment: no other bias determined |
| Methods | Parallel RCT, randomisation ratio 1:1, superiority design | |
| Participants | Inclusion criteria: men and women aged 40‐70 years, with BMI of 25‐40 kg/m², IGT, and FPG of 5.6‐7.7 mmol/L Exclusion criteria: serum creatinine level ≥ 130 µmol/L, a fasting serum triglycerides ≥ 10 mmol/L, liver enzymes elevated to ≥ 1.8 times the ULN or a TSH ≥ 1.5 times above ULN or below the lower limit of normal (< 0.3 mU/L). Participants who had been treated within the last 3 months with systemic glucocorticoids, beta‐blockers, thiazide diuretics, and nicotinic acid were also excluded. Key exclusion criteria were based on the use of drugs that were likely to be associated with abnormal intestinal motility or altered absorption of nutrients. All participants with a recent cardiovascular event were also excluded Diagnostic criteria: 2hPG: 7.8 to 11.1 mmol/L (WHO 1985) FPG: 5.6 to 7.7 mmol/L | |
| Interventions | Number of study centres: multicentre Run‐in period: no Extension period: no Intervention: AGI: 100 mg or maximum tolerated dose acarbose 3 times/d Control: placebo Additional therapy: all participants were instructed to go on a weight‐reduction or weight‐maintenance diet and were encouraged to exercise regularly; these instructions were reinforced at each visit. | |
| Outcomes | Composite outcome measures reported: yes, major cardiovascular events, including coronary heart disease (MI, new angina, revascularisation procedures), cardiovascular death, congestive heart failure, cerebrovascular events, and peripheral vascular disease | |
| Study details | Trial terminated early: no Trial ID: ‐ | |
| Publication details | Language of publication: English Funding: commercial funding (Bayer) Publication status: peer‐reviewed journal | |
| Stated aim for study | Quote from publication: "…to assess the effect of acarbose on conversion of impaired glucose tolerance to type 2 diabetes" | |
| Notes | ‐ | |
| Risk of bias | ||
| Bias | Authors' judgement | Support for judgement |
| Random sequence generation (selection bias) | Low risk | Quote: "We used a computer program to generate the random allocation sequence, which was stratified by centre. Randomisation was done in blocks of four and six" |
| Allocation concealment (selection bias) | Low risk | Quote: "Numbered drug containers were used to implement the random allocation process. Since the random code was stratified by center, the patients were randomized sequentially at each center. The random codes were concealed in 4‐part container labels that were stored separately in the event that the investigator needed to know the treatment of a patient. The allocation sequence was generated by an independent statistician who was a member of the data safety and quality review committee" |
| Blinding of participants and personnel (performance bias) | Low risk | Comment: double‐blind, with a placebo similar in size, shape and colour |
| Blinding of participants and personnel (performance bias) | Low risk | Comment: double‐blind, with a placebo similar in size, shape and colour |
| Blinding of participants and personnel (performance bias) | Low risk | Comment: double‐blind, with a placebo similar in size, shape and colour |
| Blinding of participants and personnel (performance bias) | Low risk | Comment: double‐blind, with a placebo similar in size, shape and colour |
| Blinding of participants and personnel (performance bias) | Low risk | Comment: double‐blind, with a placebo similar in size, shape and colour |
| Blinding of outcome assessment (detection bias) | Low risk | Quote: "These events were ascertained by an independent adjudicating committee of 3 cardiologists blinded to treatment" |
| Blinding of outcome assessment (detection bias) | Low risk | Quote: "These events were ascertained by an independent adjudicating committee of 3 cardiologists blinded to treatment" |
| Blinding of outcome assessment (detection bias) | Low risk | Quote: "These events were ascertained by an independent adjudicating committee of 3 cardiologists blinded to treatment" |
| Blinding of outcome assessment (detection bias) | Low risk | Quote: "These events were ascertained by an independent adjudicating committee of 3 cardiologists blinded to treatment" |
| Blinding of outcome assessment (detection bias) | Low risk | Quote: "These events were ascertained by an independent adjudicating committee of 3 cardiologists blinded to treatment" |
| Incomplete outcome data (attrition bias) | High risk | Comment: 471 completers and 211 dropouts in the treatment group, 556 completers and 130 dropouts in the control group. Dropout rate is > 15%. Difference in dropout rates between groups > 10% |
| Incomplete outcome data (attrition bias) | High risk | Comment: 471 completers and 211 dropouts in the treatment group, 556 completers and 130 dropouts in the control group. Dropout rate is > 15%. Difference in dropout rates between groups > 10% |
| Incomplete outcome data (attrition bias) | High risk | Comment: 471 completers and 211 dropouts in the treatment group, 556 completers and 130 dropouts in the control group. Dropout rate is > 15%. Difference in dropout rates between groups > 10% |
| Incomplete outcome data (attrition bias) | High risk | Comment: 471 completers and 211 dropouts in the treatment group, 556 completers and 130 dropouts in the control group. Dropout rate is > 15%. Difference in dropout rates between groups > 10% |
| Incomplete outcome data (attrition bias) | High risk | Comment: 471 completers and 211 dropouts in the treatment group, 556 completers and 130 dropouts in the control group. Dropout rate is > 15%. Difference in dropout rates between groups > 10% |
| Selective reporting (reporting bias) | High risk | Comment: the definition of the outcome cardiovascular events was different in the publication (coronary heart disease, cardiovascular death, congestive heart failure, cerebrovascular event, and peripheral arterial disease) compared to the design paper (RCT, cerebrovascular accident, congestive heart failure) |
| Other bias | Unclear risk | Comment: possible funding bias |
| Methods | Parallel RCT, randomisation ratio 1:1, superiority design | |
| Participants | Inclusion criteria: unclear Exclusion criteria: unclear Diagnostic criteria: FPG < 7.8 mmol/L and/or 2hPG of 7.8 to 11.1 mmol/L (WHO 1985) | |
| Interventions | Number of study centres: unclear Run‐in period: unclear Extension period: unclear Intervention: AGI: 50 mg acarbose 3 times/d Control: no intervention Additional therapy: participants received a minimal of 5 h training about diet to treat and prevent T2DM | |
| Outcomes | Composite outcome measures reported: no | |
| Study details | Trial terminated early: no Trial ID: ‐ | |
| Publication details | Language of publication: Chinese Funding: unclear Publication status: peer‐reviewed journal | |
| Stated aim for study | Quote from publication: "Observe the change of acarbose to IGT and explore the possibility of DM second class prevention" | |
| Notes | ‐ | |
| Risk of bias | ||
| Bias | Authors' judgement | Support for judgement |
| Random sequence generation (selection bias) | Unclear risk | Quote: "divide them into 2 groups stochastically" Comment: not enough information |
| Allocation concealment (selection bias) | Unclear risk | Comment: unclear |
| Blinding of participants and personnel (performance bias) | Low risk | Comment: no blinding, but we judged the outcome unlikely to be influenced by lack of blinding |
| Blinding of participants and personnel (performance bias) | High risk | Comment: no blinding |
| Blinding of participants and personnel (performance bias) | Low risk | Comment: no blinding, but we judged the outcome unlikely to be influenced by lack of blinding |
| Blinding of outcome assessment (detection bias) | Low risk | Comment: unclear, but we judged the outcome unlikely to be influenced by lack of blinding |
| Blinding of outcome assessment (detection bias) | Unclear risk | Comment: unclear |
| Blinding of outcome assessment (detection bias) | Low risk | Comment: unclear, but we judged the outcome unlikely to be influenced by lack of blinding |
| Incomplete outcome data (attrition bias) | Low risk | Comment: 30 completers and 1 dropout in the treatment group, 30 completers and no dropouts in the control group. Dropout rate is < 15%. Difference in dropout rates between groups < 10% |
| Incomplete outcome data (attrition bias) | Low risk | Comment: 30 completers and 1 dropout in the treatment group, 30 completers and no dropouts in the control group. Dropout rate is < 15%. Difference in dropout rates between groups < 10% |
| Incomplete outcome data (attrition bias) | Low risk | Comment: 30 completers and 1 dropout in the treatment group, 30 completers and no dropouts in the control group. Dropout rate is < 15%. Difference in dropout rates between groups < 10 |
| Selective reporting (reporting bias) | Unclear risk | Comment: no protocol available |
| Other bias | Low risk | Comment: no other bias determined |
| Methods | Parallel RCT, randomisation ratio 1:1, superiority design | |
| Participants | Inclusion criteria: admission to hospital with acute coronary syndrome (ACS) and IGT. ACS was diagnosed by the presence of acute ischaemic symptoms lasting ≥ 20 min within 48 h before admission to hospital and electrocardiographic changes consistent with ACS. Acute RCT (AMI) was diagnosed when creatine kinase‐muscle/brain levels increased to at least twice the ULN or when troponin T levels were > 0.1 ng/mL. Participants without AMI were considered to have unstable angina pectoris (all cases confirmed by percutaneous or computed tomography coronary angiography) Exclusion criteria: cardiogenic shock or pulmonary edema (Killip classification ≥ II) at admission; history of diabetes; history of hepatic diseases or/and renal dysfunction (serum creatinine level > 2 mg/dL); severe gastrointestinal disease or malignant tumours; female participants given sex hormone replacement therapy Diagnostic criteria: FPG < 6.1 mmol/L | |
| Interventions | Number of study centres: 2 centres Run‐in period: unclear Extension period: no Intervention: AGI: 50 mg acarbose 3 times/d Control: no intervention Additional therapy: all participants were guided to take diet and exercise therapy, and having outpatient clinic or telephone follow‐up for 1.0‐4.5 years. Each group was given standard medical therapy of CAD (including nitrate medications, ACE‐I/ARB, β‐blockers, statins, and antiplatelet drugs) | |
| Outcomes | Composite outcome measures reported: yes, MACE: cardiovascular death, non‐fatal reinfarction, new‐onset angina, cerebral stroke, and severe heart failure | |
| Study details | Trial terminated early: no Trial ID: ‐ | |
| Publication details | Language of publication: English Funding: unclear Publication status: peer‐reviewed journal | |
| Stated aim for study | Quote from publication: "the goal of present study is to determine whether acarbose can reduce the risk of recurrent MACE in ACS patients with newly diagnosed IGT" | |
| Notes | ‐ | |
| Risk of bias | ||
| Bias | Authors' judgement | Support for judgement |
| Random sequence generation (selection bias) | Low risk | Quote: "135 IGT patients were randomly allocated, using random numbers generated by a computer" |
| Allocation concealment (selection bias) | Unclear risk | Comment: unclear |
| Blinding of participants and personnel (performance bias) | Low risk | Comment: no blinding, but we judged the outcome unlikely to be influenced by lack of blinding |
| Blinding of participants and personnel (performance bias) | Low risk | Comment: no blinding, but we judged the outcome unlikely to be influenced by lack of blinding |
| Blinding of participants and personnel (performance bias) | Low risk | Comment: no blinding, but we judged the outcome unlikely to be influenced by lack of blinding |
| Blinding of participants and personnel (performance bias) | High risk | Comment: no blinding |
| Blinding of participants and personnel (performance bias) | Low risk | Comment: no blinding, but we judged the outcome unlikely to be influenced by lack of blinding |
| Blinding of outcome assessment (detection bias) | Low risk | Comment: unclear, but we judged the outcome unlikely to be influenced by lack of blinding |
| Blinding of outcome assessment (detection bias) | Low risk | Comment: unclear, but we judged the outcome unlikely to be influenced by lack of blinding |
| Blinding of outcome assessment (detection bias) | Low risk | Comment: unclear, but we judged the outcome unlikely to be influenced by lack of blinding |
| Blinding of outcome assessment (detection bias) | Unclear risk | Comment: unclear |
| Blinding of outcome assessment (detection bias) | Low risk | Comment: unclear, but we judged the outcome unlikely to be influenced by lack of blinding |
| Incomplete outcome data (attrition bias) | Low risk | Comment: 60 completers and 7 dropouts in the treatment group, 64 completers and 4 dropouts in the control group. Dropout rate is < 15%. Difference in dropout rates between groups < 10% |
| Incomplete outcome data (attrition bias) | Low risk | Comment: 60 completers and 7 dropouts in the treatment group, 64 completers and 4 dropouts in the control group. Dropout rate is < 15%. Difference in dropout rates between groups < 10% |
| Incomplete outcome data (attrition bias) | Low risk | Comment: 60 completers and 7 dropouts in the treatment group, 64 completers and 4 dropouts in the control group. Dropout rate is < 15%. Difference in dropout rates between groups < 10% |
| Incomplete outcome data (attrition bias) | Low risk | Comment: 60 completers and 7 dropouts in the treatment group, 64 completers and 4 dropouts in the control group. Dropout rate is < 15%. Difference in dropout rates between groups < 10% |
| Incomplete outcome data (attrition bias) | Low risk | Comment: 60 completers and 7 dropouts in the treatment group, 64 completers and 4 dropouts in the control group. Dropout rate is < 15%. Difference in dropout rates between groups < 10% |
| Selective reporting (reporting bias) | Unclear risk | Comment: no protocol available |
| Other bias | Low risk | Comment: no other bias determined |
"‐" denotes not reported
2hPG: 2‐hour plasma glucose; ACE‐I: angiotensin‐converting‐enzyme inhibitor; ACS: acute coronary syndrome; AGI: alpha‐glucosidase inhibitor
ARB: angiotensin II receptor blocker; AST/ALT: aspartate transaminase/alanine transaminase; BMI: body mass index; CT: computed tomography; CAD: coronary artery disease; DAISI: Dutch Acarbose Intervention Study in IGT; DM: diabetes mellitus; ECG: electrocardiogram; eGFR: estimated glomerular filtration rate; FPG: fasting plasma glucose; HbA1c: glycosylated haemoglobin A1c; HDL: high‐density lipoprotein; IGT: impaired glucose tolerance; LVEF: left ventricular ejection fraction; MACE: major adverse cardiovascular events; MDRD: modification of diet and renal disease; MI: myocardial infarction; NYHA: New York Heart Association classification; RCT: randomised controlled trial; rTMS: rave Trial Management System; T2DM: type 2 diabetes mellitus; TIA: transient ischaemic attack; TSH: thyroid‐stimulating hormone; UA: unstable angina; ULN: upper limit of normal
Characteristics of excluded studies [ordered by study ID]
| Study | Reason for exclusion |
| All enrolled participants had T2DM | |
| All enrolled participants had T2DM | |
| All enrolled participants had T2DM (as defined by a 2‐h post‐load plasma glucose ≥ 11.1 mmol/L) | |
| Trial never completed | |
| Population consisted of both people with T2DM and people with IGT. Attempts to contact the trial author failed (no reply) | |
| Trial was not randomised | |
| Trial never completed | |
| All enrolled participants had T2DM | |
| All enrolled participants had T2DM | |
| Trial never completed | |
| All enrolled participants had T2DM | |
| All enrolled participants had T2DM | |
| No mention of randomisation in the translated manuscript. Attempts to contact the trial authors failed (emails were rejected) |
EDIP: Early Diabetes Intervention Program; JEDIS: Japan Early Diabetes Intervention Study; MM: miglitol and mitiglinide; T2DM: type 2 diabetes
Characteristics of studies awaiting assessment [ordered by study ID]
| Methods | Randomised open‐label clinical trial with 300 participants |
| Participants | Patients with abnormal glucose tolerance and recent coronary artery stents due to coronary artery disease |
| Interventions | Acarbose versus standard lifestyle modification |
| Outcomes | Primary outcome: cardiovascular event free survival time Secondary outcomes: 1. conversion of abnormal glucose tolerance to type 2 diabetes; 2. all cause of death; 3. occurrence of every cardiovascular event; 4. occurrence of in‐stent restenosis; 5. change in fasting, 2‐hour blood glucose and insulin level; 6. change in homeostasis model assessment of insulin resistance; 7. change in hemoglobin A1c (HbA1c); 8. change in lipid profile |
| Study details | Trials register identifier:NCT00221156 |
| Notes | As of December 2018 there were no publications available on this trial |
Data and analyses
| Outcome or subgroup title | No. of studies | No. of participants | Statistical method | Effect size |
| 1 All‐cause mortality Show forest plot | 4 | 9847 | Risk Ratio (M‐H, Random, 95% CI) | 1.24 [0.53, 2.90] |
| Analysis 1.1  Comparison 1 AGI versus placebo, Outcome 1 All‐cause mortality. | ||||
| 1.1 Acarbose | 3 | 8069 | Risk Ratio (M‐H, Random, 95% CI) | 0.98 [0.82, 1.18] |
| 1.2 Voglibose | 1 | 1778 | Risk Ratio (M‐H, Random, 95% CI) | 12.77 [0.72, 226.31] |
| 2 Incidence of type 2 diabetes Show forest plot | 4 | 9786 | Risk Ratio (M‐H, Random, 95% CI) | 0.73 [0.59, 0.90] |
| Analysis 1.2  Comparison 1 AGI versus placebo, Outcome 2 Incidence of type 2 diabetes. | ||||
| 2.1 Acarbose | 3 | 8008 | Risk Ratio (M‐H, Random, 95% CI) | 0.82 [0.75, 0.89] |
| 2.2 Voglibose | 1 | 1778 | Risk Ratio (M‐H, Random, 95% CI) | 0.46 [0.34, 0.64] |
| 3 Serious adverse events Show forest plot | 3 | 8403 | Risk Ratio (M‐H, Random, 95% CI) | 1.12 [0.97, 1.30] |
| Analysis 1.3  Comparison 1 AGI versus placebo, Outcome 3 Serious adverse events. | ||||
| 3.1 Acarbose | 2 | 6625 | Risk Ratio (M‐H, Random, 95% CI) | 1.12 [0.97, 1.29] |
| 3.2 Voglibose | 1 | 1778 | Risk Ratio (M‐H, Random, 95% CI) | 2.46 [0.48, 12.62] |
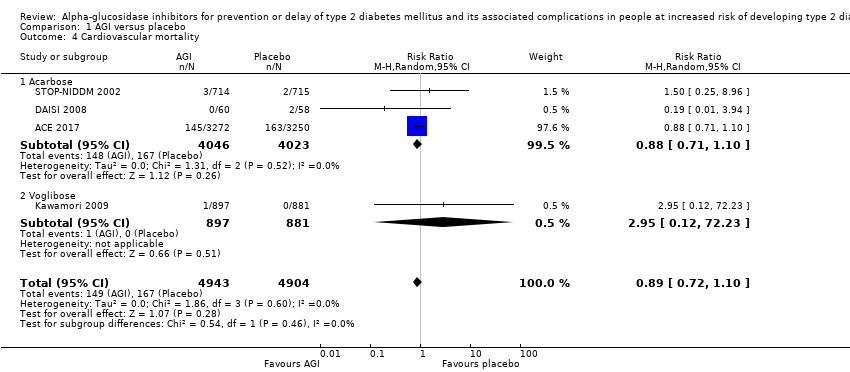
| 4 Cardiovascular mortality Show forest plot | 4 | 9847 | Risk Ratio (M‐H, Random, 95% CI) | 0.89 [0.72, 1.10] |
| Analysis 1.4  Comparison 1 AGI versus placebo, Outcome 4 Cardiovascular mortality. | ||||
| 4.1 Acarbose | 3 | 8069 | Risk Ratio (M‐H, Random, 95% CI) | 0.88 [0.71, 1.10] |
| 4.2 Voglibose | 1 | 1778 | Risk Ratio (M‐H, Random, 95% CI) | 2.95 [0.12, 72.23] |
| 5 Non‐fatal myocardial infarction Show forest plot | 2 | 1486 | Risk Ratio (M‐H, Random, 95% CI) | 0.10 [0.02, 0.53] |
| Analysis 1.5  Comparison 1 AGI versus placebo, Outcome 5 Non‐fatal myocardial infarction. | ||||
| 6 Non‐fatal stroke Show forest plot | 1 | 1368 | Risk Ratio (M‐H, Random, 95% CI) | 0.50 [0.09, 2.74] |
| Analysis 1.6  Comparison 1 AGI versus placebo, Outcome 6 Non‐fatal stroke. | ||||
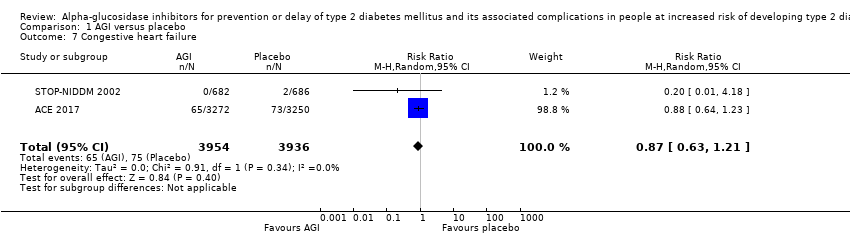
| 7 Congestive heart failure Show forest plot | 2 | 7890 | Risk Ratio (M‐H, Random, 95% CI) | 0.87 [0.63, 1.21] |
| Analysis 1.7  Comparison 1 AGI versus placebo, Outcome 7 Congestive heart failure. | ||||
| 8 Non‐serious adverse events Show forest plot | 3 | 3328 | Risk Ratio (M‐H, Random, 95% CI) | 1.04 [1.02, 1.06] |
| Analysis 1.8  Comparison 1 AGI versus placebo, Outcome 8 Non‐serious adverse events. | ||||
| 8.1 Acarbose | 2 | 1550 | Risk Ratio (M‐H, Random, 95% CI) | 1.04 [1.01, 1.06] |
| 8.2 Voglibose | 1 | 1778 | Risk Ratio (M‐H, Random, 95% CI) | 1.06 [1.02, 1.10] |
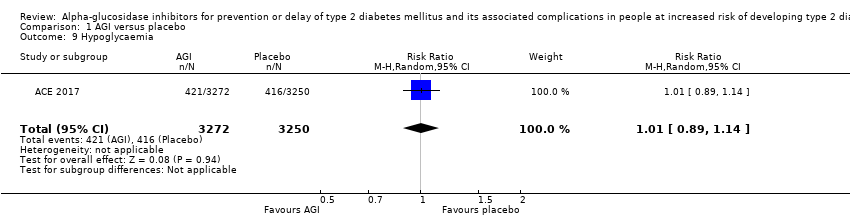
| 9 Hypoglycaemia Show forest plot | 1 | 6522 | Risk Ratio (M‐H, Random, 95% CI) | 1.01 [0.89, 1.14] |
| Analysis 1.9  Comparison 1 AGI versus placebo, Outcome 9 Hypoglycaemia. | ||||
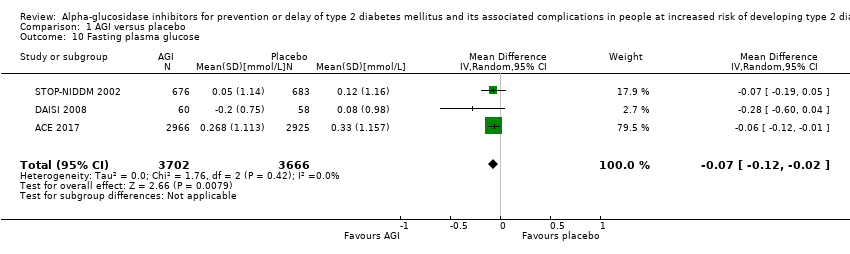
| 10 Fasting plasma glucose Show forest plot | 3 | 7368 | Mean Difference (IV, Random, 95% CI) | ‐0.07 [‐0.12, ‐0.02] |
| Analysis 1.10  Comparison 1 AGI versus placebo, Outcome 10 Fasting plasma glucose. | ||||
| 11 2‐h glucose measurements Show forest plot | 3 | 6498 | Mean Difference (IV, Random, 95% CI) | ‐0.53 [‐0.92, ‐0.14] |
| Analysis 1.11  Comparison 1 AGI versus placebo, Outcome 11 2‐h glucose measurements. | ||||
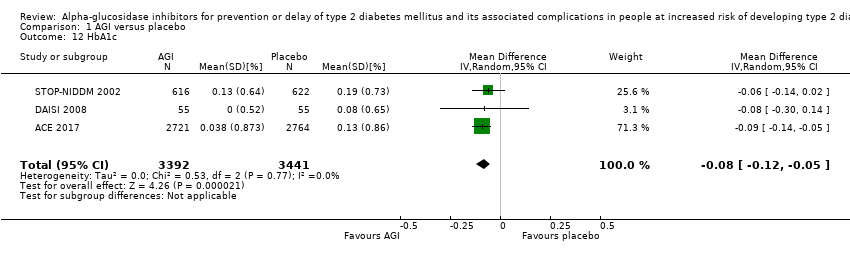
| 12 HbA1c Show forest plot | 3 | 6833 | Mean Difference (IV, Random, 95% CI) | ‐0.08 [‐0.12, ‐0.05] |
| Analysis 1.12  Comparison 1 AGI versus placebo, Outcome 12 HbA1c. | ||||
| 13 Change in total cholesterol Show forest plot | 3 | 6815 | Mean Difference (IV, Random, 95% CI) | ‐0.05 [‐0.10, 0.00] |
| Analysis 1.13  Comparison 1 AGI versus placebo, Outcome 13 Change in total cholesterol. | ||||
| 14 Change in HDL‐cholesterol Show forest plot | 3 | 6807 | Mean Difference (IV, Random, 95% CI) | 0.01 [‐0.00, 0.03] |
| Analysis 1.14  Comparison 1 AGI versus placebo, Outcome 14 Change in HDL‐cholesterol. | ||||
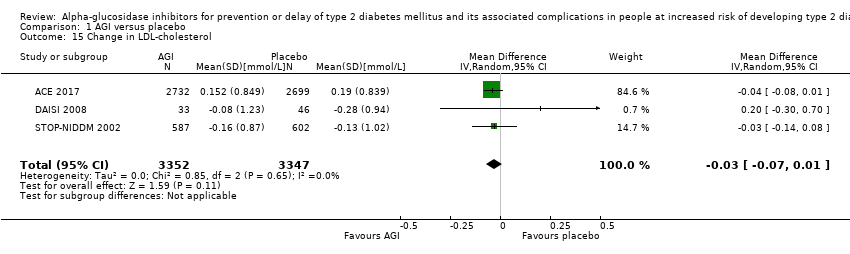
| 15 Change in LDL‐cholesterol Show forest plot | 3 | 6699 | Mean Difference (IV, Random, 95% CI) | ‐0.03 [‐0.07, 0.01] |
| Analysis 1.15  Comparison 1 AGI versus placebo, Outcome 15 Change in LDL‐cholesterol. | ||||
| 16 Change in triglycerides Show forest plot | 3 | 6843 | Mean Difference (IV, Random, 95% CI) | ‐0.07 [‐0.17, 0.03] |
| Analysis 1.16  Comparison 1 AGI versus placebo, Outcome 16 Change in triglycerides. | ||||
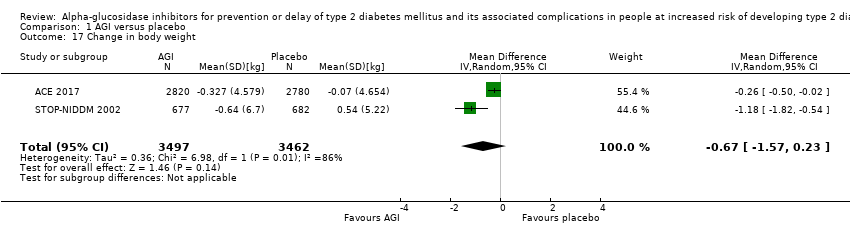
| 17 Change in body weight Show forest plot | 2 | 6959 | Mean Difference (IV, Random, 95% CI) | ‐0.67 [‐1.57, 0.23] |
| Analysis 1.17  Comparison 1 AGI versus placebo, Outcome 17 Change in body weight. | ||||
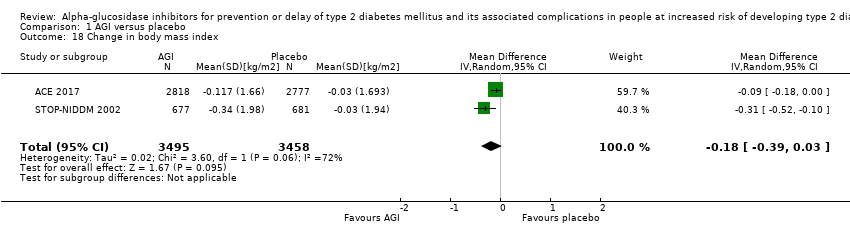
| 18 Change in body mass index Show forest plot | 2 | 6953 | Mean Difference (IV, Random, 95% CI) | ‐0.18 [‐0.39, 0.03] |
| Analysis 1.18  Comparison 1 AGI versus placebo, Outcome 18 Change in body mass index. | ||||
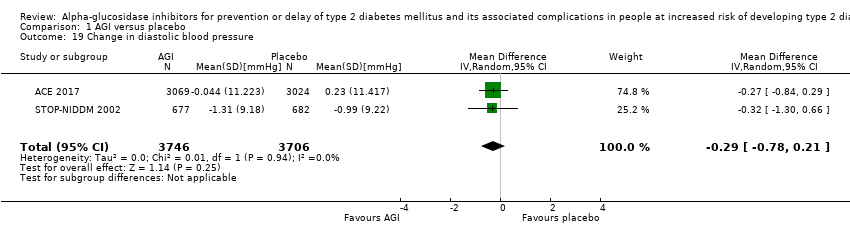
| 19 Change in diastolic blood pressure Show forest plot | 2 | 7452 | Mean Difference (IV, Random, 95% CI) | ‐0.29 [‐0.78, 0.21] |
| Analysis 1.19  Comparison 1 AGI versus placebo, Outcome 19 Change in diastolic blood pressure. | ||||
| 20 Change in systolic blood pressure Show forest plot | 2 | 7452 | Mean Difference (IV, Random, 95% CI) | ‐0.47 [‐1.26, 0.32] |
| Analysis 1.20  Comparison 1 AGI versus placebo, Outcome 20 Change in systolic blood pressure. | ||||
| Outcome or subgroup title | No. of studies | No. of participants | Statistical method | Effect size |
| 1 All‐cause mortality Show forest plot | 1 | Risk Ratio (M‐H, Fixed, 95% CI) | Totals not selected | |
| Analysis 2.1  Comparison 2 AGI versus metformin, Outcome 1 All‐cause mortality. | ||||
| 2 Incidence of type 2 diabetes Show forest plot | 1 | Risk Ratio (M‐H, Fixed, 95% CI) | Totals not selected | |
| Analysis 2.2  Comparison 2 AGI versus metformin, Outcome 2 Incidence of type 2 diabetes. | ||||
| 3 Fasting plasma glucose Show forest plot | 1 | Mean Difference (IV, Fixed, 95% CI) | Totals not selected | |
| Analysis 2.3  Comparison 2 AGI versus metformin, Outcome 3 Fasting plasma glucose. | ||||
| 4 2‐h glucose measurements Show forest plot | 1 | Mean Difference (IV, Fixed, 95% CI) | Totals not selected | |
| Analysis 2.4  Comparison 2 AGI versus metformin, Outcome 4 2‐h glucose measurements. | ||||
| 5 Change in total cholesterol Show forest plot | 1 | Mean Difference (IV, Fixed, 95% CI) | Totals not selected | |
| Analysis 2.5  Comparison 2 AGI versus metformin, Outcome 5 Change in total cholesterol. | ||||
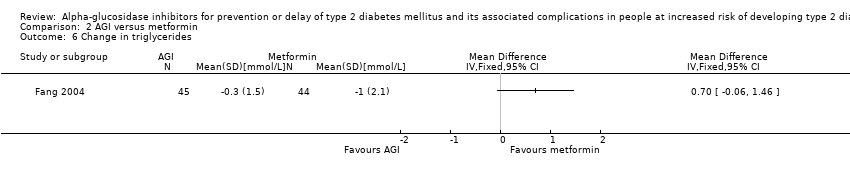
| 6 Change in triglycerides Show forest plot | 1 | Mean Difference (IV, Fixed, 95% CI) | Totals not selected | |
| Analysis 2.6  Comparison 2 AGI versus metformin, Outcome 6 Change in triglycerides. | ||||
| 7 Change in body mass index Show forest plot | 1 | Mean Difference (IV, Fixed, 95% CI) | Totals not selected | |
| Analysis 2.7  Comparison 2 AGI versus metformin, Outcome 7 Change in body mass index. | ||||
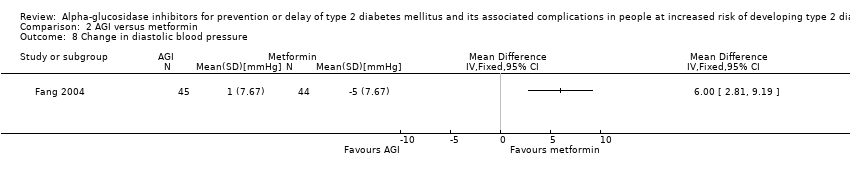
| 8 Change in diastolic blood pressure Show forest plot | 1 | Mean Difference (IV, Fixed, 95% CI) | Totals not selected | |
| Analysis 2.8  Comparison 2 AGI versus metformin, Outcome 8 Change in diastolic blood pressure. | ||||
| 9 Change in systolic blood pressure Show forest plot | 1 | Mean Difference (IV, Fixed, 95% CI) | Totals not selected | |
| Analysis 2.9  Comparison 2 AGI versus metformin, Outcome 9 Change in systolic blood pressure. | ||||
| Outcome or subgroup title | No. of studies | No. of participants | Statistical method | Effect size |
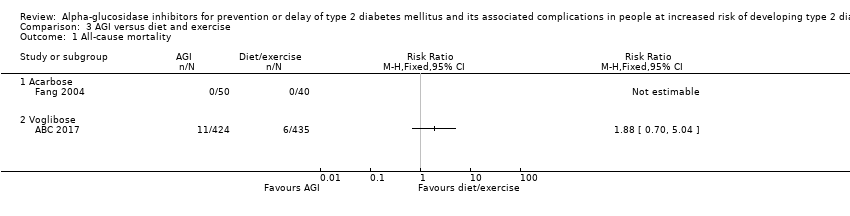
| 1 All‐cause mortality Show forest plot | 2 | Risk Ratio (M‐H, Fixed, 95% CI) | Totals not selected | |
| Analysis 3.1  Comparison 3 AGI versus diet and exercise, Outcome 1 All‐cause mortality. | ||||
| 1.1 Acarbose | 1 | Risk Ratio (M‐H, Fixed, 95% CI) | 0.0 [0.0, 0.0] | |
| 1.2 Voglibose | 1 | Risk Ratio (M‐H, Fixed, 95% CI) | 0.0 [0.0, 0.0] | |
| 2 Incidence of type 2 diabetes Show forest plot | 1 | Risk Ratio (M‐H, Fixed, 95% CI) | Totals not selected | |
| Analysis 3.2  Comparison 3 AGI versus diet and exercise, Outcome 2 Incidence of type 2 diabetes. | ||||
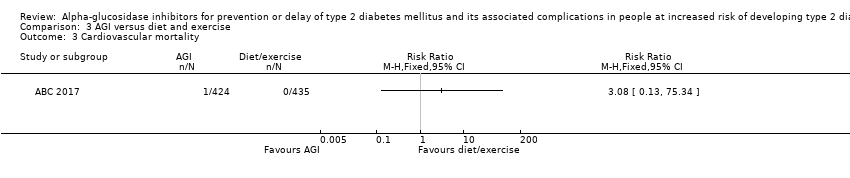
| 3 Cardiovascular mortality Show forest plot | 1 | Risk Ratio (M‐H, Fixed, 95% CI) | Totals not selected | |
| Analysis 3.3  Comparison 3 AGI versus diet and exercise, Outcome 3 Cardiovascular mortality. | ||||
| 4 Non‐fatal myocardial infarction Show forest plot | 1 | Risk Ratio (M‐H, Fixed, 95% CI) | Totals not selected | |
| Analysis 3.4  Comparison 3 AGI versus diet and exercise, Outcome 4 Non‐fatal myocardial infarction. | ||||
| 5 Non‐fatal stroke Show forest plot | 1 | Risk Ratio (M‐H, Fixed, 95% CI) | Totals not selected | |
| Analysis 3.5  Comparison 3 AGI versus diet and exercise, Outcome 5 Non‐fatal stroke. | ||||
| 6 Congestive heart failure Show forest plot | 1 | Risk Ratio (M‐H, Fixed, 95% CI) | Totals not selected | |
| Analysis 3.6  Comparison 3 AGI versus diet and exercise, Outcome 6 Congestive heart failure. | ||||
| 7 Non‐serious adverse events Show forest plot | 1 | Risk Ratio (M‐H, Fixed, 95% CI) | Totals not selected | |
| Analysis 3.7  Comparison 3 AGI versus diet and exercise, Outcome 7 Non‐serious adverse events. | ||||
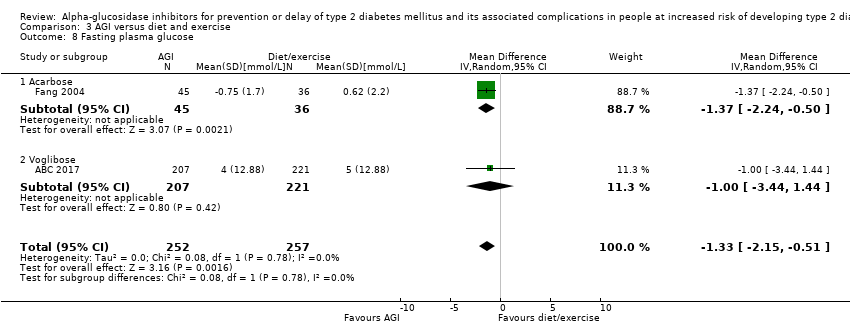
| 8 Fasting plasma glucose Show forest plot | 2 | 509 | Mean Difference (IV, Random, 95% CI) | ‐1.33 [‐2.15, ‐0.51] |
| Analysis 3.8  Comparison 3 AGI versus diet and exercise, Outcome 8 Fasting plasma glucose. | ||||
| 8.1 Acarbose | 1 | 81 | Mean Difference (IV, Random, 95% CI) | ‐1.37 [‐2.24, ‐0.50] |
| 8.2 Voglibose | 1 | 428 | Mean Difference (IV, Random, 95% CI) | ‐1.0 [‐3.44, 1.44] |
| 9 2‐h glucose measurements Show forest plot | 2 | 472 | Mean Difference (IV, Random, 95% CI) | ‐2.74 [‐3.74, ‐1.74] |
| Analysis 3.9  Comparison 3 AGI versus diet and exercise, Outcome 9 2‐h glucose measurements. | ||||
| 9.1 Acarbose | 1 | 81 | Mean Difference (IV, Random, 95% CI) | ‐2.79 [‐3.79, ‐1.79] |
| 9.2 Voglibose | 1 | 391 | Mean Difference (IV, Random, 95% CI) | 0.7 [‐7.53, 8.93] |
| 10 HbA1c Show forest plot | 1 | Mean Difference (IV, Fixed, 95% CI) | Totals not selected | |
| Analysis 3.10  Comparison 3 AGI versus diet and exercise, Outcome 10 HbA1c. | ||||
| 11 Change in total cholesterol Show forest plot | 2 | 586 | Mean Difference (IV, Random, 95% CI) | ‐0.49 [‐1.32, 0.33] |
| Analysis 3.11  Comparison 3 AGI versus diet and exercise, Outcome 11 Change in total cholesterol. | ||||
| 11.1 Acarbose | 1 | 81 | Mean Difference (IV, Random, 95% CI) | ‐0.50 [‐1.33, 0.33] |
| 11.2 Voglibose | 1 | 505 | Mean Difference (IV, Random, 95% CI) | 0.0 [‐6.47, 6.47] |
| 12 Change in triglycerides Show forest plot | 2 | 612 | Mean Difference (IV, Random, 95% CI) | ‐0.10 [‐0.76, 0.56] |
| Analysis 3.12  Comparison 3 AGI versus diet and exercise, Outcome 12 Change in triglycerides. | ||||
| 12.1 Acarbose | 1 | 81 | Mean Difference (IV, Random, 95% CI) | ‐0.10 [‐0.76, 0.56] |
| 12.2 Voglibose | 1 | 531 | Mean Difference (IV, Random, 95% CI) | ‐0.1 [‐17.03, 16.83] |
| 13 Change in HDL‐cholesterol [mmol/L] Show forest plot | 1 | 545 | Mean Difference (IV, Random, 95% CI) | 0.0 [‐2.51, 2.51] |
| Analysis 3.13 ![Comparison 3 AGI versus diet and exercise, Outcome 13 Change in HDL‐cholesterol [mmol/L].](/cdsr/doi/10.1002/14651858.CD005061.pub3/media/CDSR/CD005061/image_n/nCD005061-CMP-003-13.png) Comparison 3 AGI versus diet and exercise, Outcome 13 Change in HDL‐cholesterol [mmol/L]. | ||||
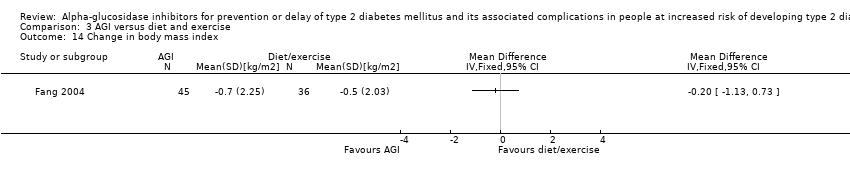
| 14 Change in body mass index Show forest plot | 1 | Mean Difference (IV, Fixed, 95% CI) | Totals not selected | |
| Analysis 3.14  Comparison 3 AGI versus diet and exercise, Outcome 14 Change in body mass index. | ||||
| 15 Change in diastolic blood pressure Show forest plot | 2 | 667 | Mean Difference (IV, Random, 95% CI) | 1.25 [‐1.65, 4.15] |
| Analysis 3.15  Comparison 3 AGI versus diet and exercise, Outcome 15 Change in diastolic blood pressure. | ||||
| 16 Change in systolic blood pressure Show forest plot | 2 | 668 | Mean Difference (IV, Random, 95% CI) | ‐1.94 [‐8.71, 4.83] |
| Analysis 3.16  Comparison 3 AGI versus diet and exercise, Outcome 16 Change in systolic blood pressure. | ||||
| 16.1 Acarbose | 1 | 81 | Mean Difference (IV, Random, 95% CI) | ‐6.00 [‐12.23, 0.23] |
| 16.2 Voglibose | 1 | 587 | Mean Difference (IV, Random, 95% CI) | 1.0 [‐1.92, 3.92] |
| Outcome or subgroup title | No. of studies | No. of participants | Statistical method | Effect size |
| 1 All‐cause mortality Show forest plot | 2 | 171 | Risk Ratio (M‐H, Random, 95% CI) | 0.0 [0.0, 0.0] |
| Analysis 4.1  Comparison 4 AGI versus no intervention, Outcome 1 All‐cause mortality. | ||||
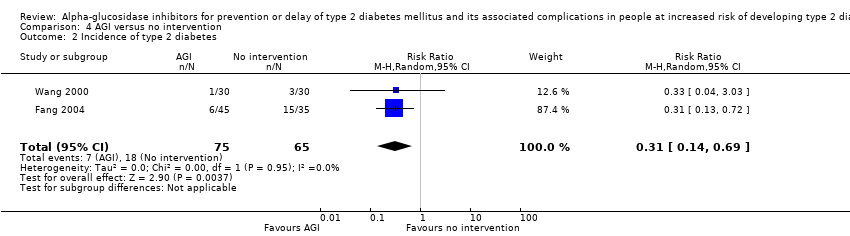
| 2 Incidence of type 2 diabetes Show forest plot | 2 | 140 | Risk Ratio (M‐H, Random, 95% CI) | 0.31 [0.14, 0.69] |
| Analysis 4.2  Comparison 4 AGI versus no intervention, Outcome 2 Incidence of type 2 diabetes. | ||||
| 3 Cardiovascular mortality Show forest plot | 2 | Risk Ratio (M‐H, Fixed, 95% CI) | Totals not selected | |
| Analysis 4.3  Comparison 4 AGI versus no intervention, Outcome 3 Cardiovascular mortality. | ||||
| 4 Non‐fatal myocardial infarction Show forest plot | 2 | Risk Ratio (M‐H, Fixed, 95% CI) | Subtotals only | |
| Analysis 4.4  Comparison 4 AGI versus no intervention, Outcome 4 Non‐fatal myocardial infarction. | ||||
| 5 Non‐fatal stroke Show forest plot | 2 | Risk Ratio (M‐H, Fixed, 95% CI) | Subtotals only | |
| Analysis 4.5  Comparison 4 AGI versus no intervention, Outcome 5 Non‐fatal stroke. | ||||
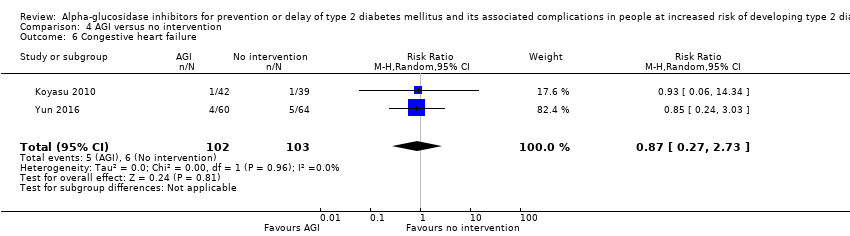
| 6 Congestive heart failure Show forest plot | 2 | 205 | Risk Ratio (M‐H, Random, 95% CI) | 0.87 [0.27, 2.73] |
| Analysis 4.6  Comparison 4 AGI versus no intervention, Outcome 6 Congestive heart failure. | ||||
| 7 Non‐serious adverse events Show forest plot | 1 | Risk Ratio (M‐H, Fixed, 95% CI) | Totals not selected | |
| Analysis 4.7  Comparison 4 AGI versus no intervention, Outcome 7 Non‐serious adverse events. | ||||
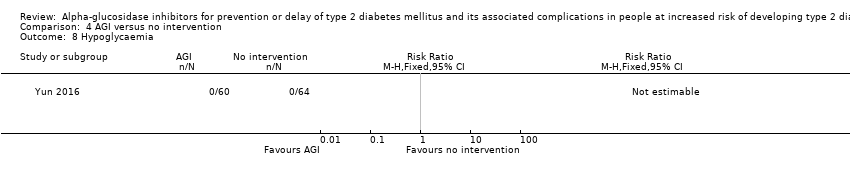
| 8 Hypoglycaemia Show forest plot | 1 | Risk Ratio (M‐H, Fixed, 95% CI) | Totals not selected | |
| Analysis 4.8  Comparison 4 AGI versus no intervention, Outcome 8 Hypoglycaemia. | ||||
| 9 Fasting plasma glucose Show forest plot | 3 | 285 | Mean Difference (IV, Random, 95% CI) | ‐0.35 [‐0.79, 0.08] |
| Analysis 4.9  Comparison 4 AGI versus no intervention, Outcome 9 Fasting plasma glucose. | ||||
| 10 2‐h glucose measurements Show forest plot | 3 | 285 | Mean Difference (IV, Random, 95% CI) | ‐2.50 [‐4.18, ‐0.83] |
| Analysis 4.10  Comparison 4 AGI versus no intervention, Outcome 10 2‐h glucose measurements. | ||||
| 11 HbA1c Show forest plot | 2 | Mean Difference (IV, Random, 95% CI) | Subtotals only | |
| Analysis 4.11  Comparison 4 AGI versus no intervention, Outcome 11 HbA1c. | ||||
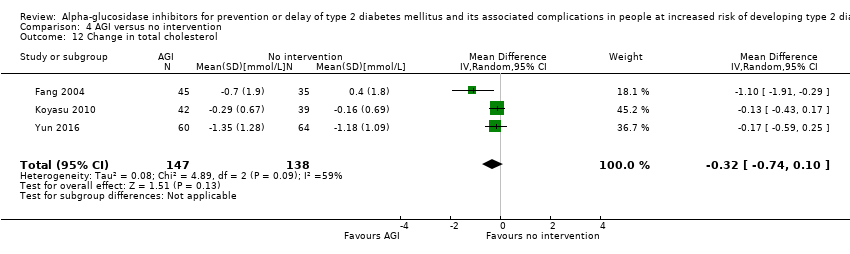
| 12 Change in total cholesterol Show forest plot | 3 | 285 | Mean Difference (IV, Random, 95% CI) | ‐0.32 [‐0.74, 0.10] |
| Analysis 4.12  Comparison 4 AGI versus no intervention, Outcome 12 Change in total cholesterol. | ||||
| 13 Change in HDL‐cholesterol Show forest plot | 1 | Mean Difference (IV, Fixed, 95% CI) | Totals not selected | |
| Analysis 4.13  Comparison 4 AGI versus no intervention, Outcome 13 Change in HDL‐cholesterol. | ||||
| 14 Change in LDL‐cholesterol Show forest plot | 2 | 205 | Mean Difference (IV, Random, 95% CI) | ‐0.03 [‐0.22, 0.15] |
| Analysis 4.14  Comparison 4 AGI versus no intervention, Outcome 14 Change in LDL‐cholesterol. | ||||
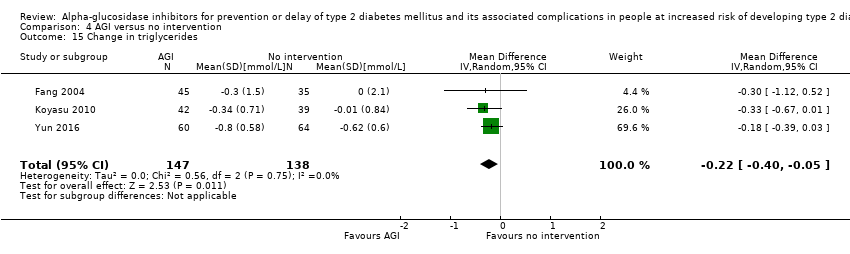
| 15 Change in triglycerides Show forest plot | 3 | 285 | Mean Difference (IV, Random, 95% CI) | ‐0.22 [‐0.40, ‐0.05] |
| Analysis 4.15  Comparison 4 AGI versus no intervention, Outcome 15 Change in triglycerides. | ||||
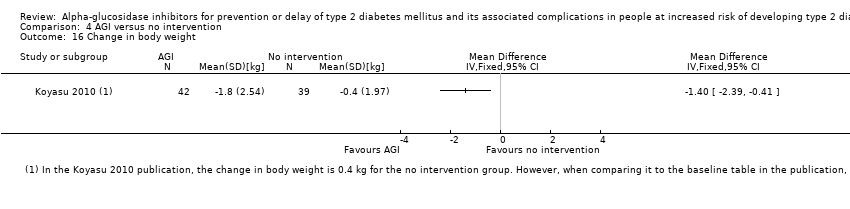
| 16 Change in body weight Show forest plot | 1 | Mean Difference (IV, Fixed, 95% CI) | Totals not selected | |
| Analysis 4.16  Comparison 4 AGI versus no intervention, Outcome 16 Change in body weight. | ||||
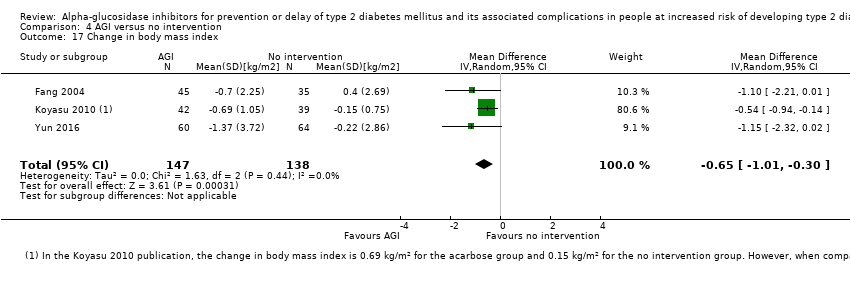
| 17 Change in body mass index Show forest plot | 3 | 285 | Mean Difference (IV, Random, 95% CI) | ‐0.65 [‐1.01, ‐0.30] |
| Analysis 4.17  Comparison 4 AGI versus no intervention, Outcome 17 Change in body mass index. | ||||
| 18 Change in diastolic blood pressure Show forest plot | 3 | 285 | Mean Difference (IV, Random, 95% CI) | ‐0.26 [‐3.80, 3.28] |
| Analysis 4.18  Comparison 4 AGI versus no intervention, Outcome 18 Change in diastolic blood pressure. | ||||
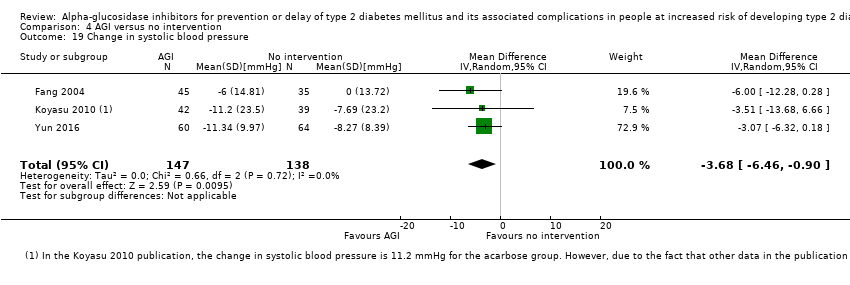
| 19 Change in systolic blood pressure Show forest plot | 3 | 285 | Mean Difference (IV, Random, 95% CI) | ‐3.68 [‐6.46, ‐0.90] |
| Analysis 4.19  Comparison 4 AGI versus no intervention, Outcome 19 Change in systolic blood pressure. | ||||
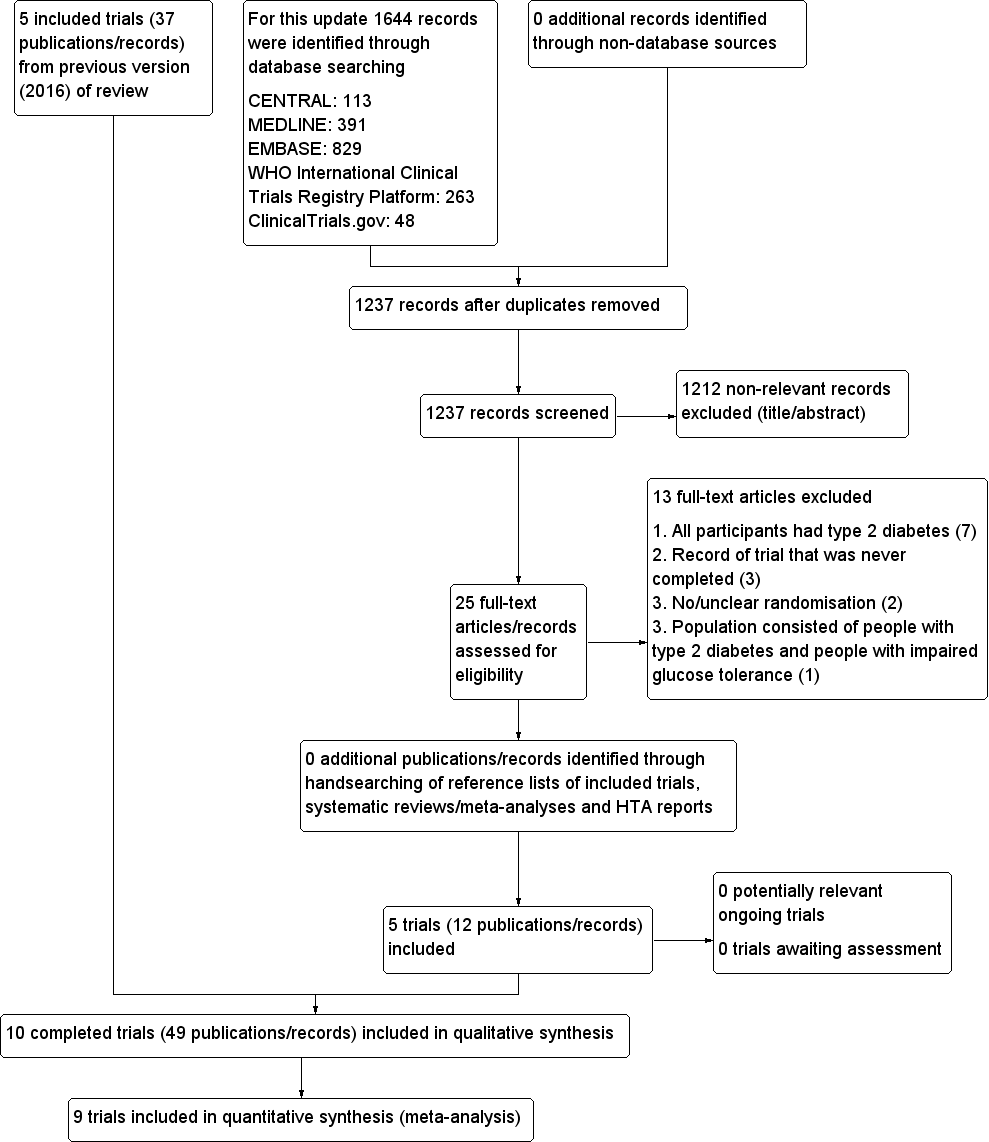
Trial flow diagram
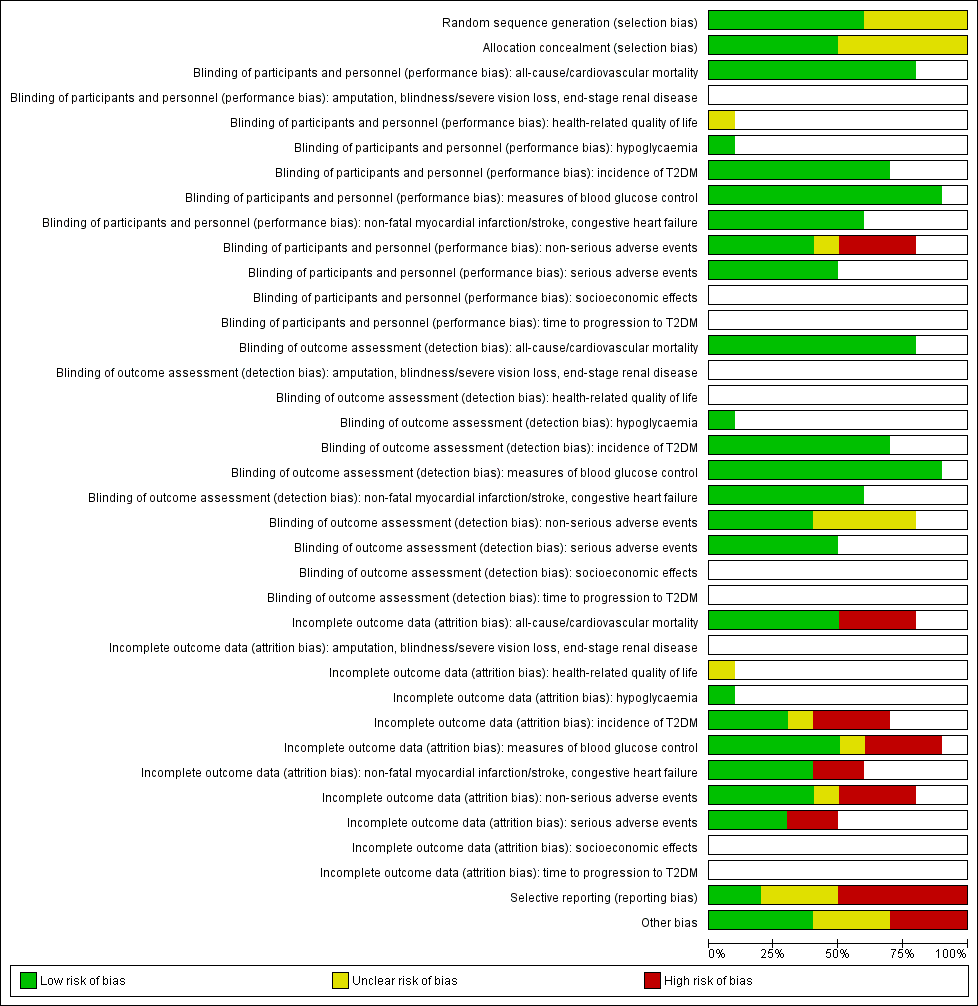
Risk of bias graph: review authors' judgements about each risk of bias item presented as percentages across all included trials (blank cells indicate that the particular outcome was not measured in some trials).
T2DM: type 2 diabetes mellitus

Risk of bias summary: review authors' judgements about each risk of bias item for each included trial (blank cells indicate that the particular outcome was not measured in some trials)
ABC: Alpha‐glucosidase‐inhiT2DM: type 2 diabetes mellitus
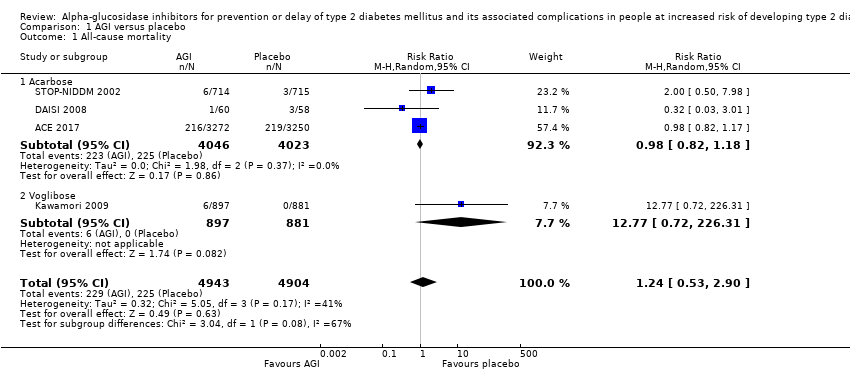
Comparison 1 AGI versus placebo, Outcome 1 All‐cause mortality.
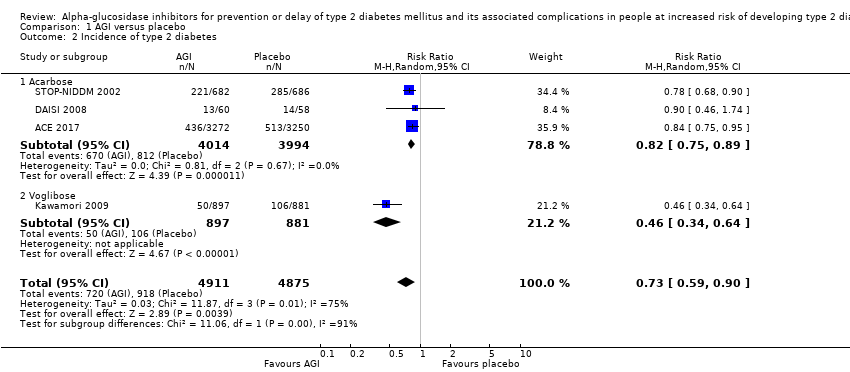
Comparison 1 AGI versus placebo, Outcome 2 Incidence of type 2 diabetes.

Comparison 1 AGI versus placebo, Outcome 3 Serious adverse events.
Comparison 1 AGI versus placebo, Outcome 4 Cardiovascular mortality.

Comparison 1 AGI versus placebo, Outcome 5 Non‐fatal myocardial infarction.

Comparison 1 AGI versus placebo, Outcome 6 Non‐fatal stroke.
Comparison 1 AGI versus placebo, Outcome 7 Congestive heart failure.

Comparison 1 AGI versus placebo, Outcome 8 Non‐serious adverse events.
Comparison 1 AGI versus placebo, Outcome 9 Hypoglycaemia.
Comparison 1 AGI versus placebo, Outcome 10 Fasting plasma glucose.

Comparison 1 AGI versus placebo, Outcome 11 2‐h glucose measurements.
Comparison 1 AGI versus placebo, Outcome 12 HbA1c.

Comparison 1 AGI versus placebo, Outcome 13 Change in total cholesterol.

Comparison 1 AGI versus placebo, Outcome 14 Change in HDL‐cholesterol.
Comparison 1 AGI versus placebo, Outcome 15 Change in LDL‐cholesterol.

Comparison 1 AGI versus placebo, Outcome 16 Change in triglycerides.
Comparison 1 AGI versus placebo, Outcome 17 Change in body weight.
Comparison 1 AGI versus placebo, Outcome 18 Change in body mass index.
Comparison 1 AGI versus placebo, Outcome 19 Change in diastolic blood pressure.

Comparison 1 AGI versus placebo, Outcome 20 Change in systolic blood pressure.

Comparison 2 AGI versus metformin, Outcome 1 All‐cause mortality.

Comparison 2 AGI versus metformin, Outcome 2 Incidence of type 2 diabetes.

Comparison 2 AGI versus metformin, Outcome 3 Fasting plasma glucose.

Comparison 2 AGI versus metformin, Outcome 4 2‐h glucose measurements.

Comparison 2 AGI versus metformin, Outcome 5 Change in total cholesterol.
Comparison 2 AGI versus metformin, Outcome 6 Change in triglycerides.

Comparison 2 AGI versus metformin, Outcome 7 Change in body mass index.
Comparison 2 AGI versus metformin, Outcome 8 Change in diastolic blood pressure.

Comparison 2 AGI versus metformin, Outcome 9 Change in systolic blood pressure.
Comparison 3 AGI versus diet and exercise, Outcome 1 All‐cause mortality.

Comparison 3 AGI versus diet and exercise, Outcome 2 Incidence of type 2 diabetes.
Comparison 3 AGI versus diet and exercise, Outcome 3 Cardiovascular mortality.

Comparison 3 AGI versus diet and exercise, Outcome 4 Non‐fatal myocardial infarction.

Comparison 3 AGI versus diet and exercise, Outcome 5 Non‐fatal stroke.

Comparison 3 AGI versus diet and exercise, Outcome 6 Congestive heart failure.

Comparison 3 AGI versus diet and exercise, Outcome 7 Non‐serious adverse events.
Comparison 3 AGI versus diet and exercise, Outcome 8 Fasting plasma glucose.

Comparison 3 AGI versus diet and exercise, Outcome 9 2‐h glucose measurements.

Comparison 3 AGI versus diet and exercise, Outcome 10 HbA1c.

Comparison 3 AGI versus diet and exercise, Outcome 11 Change in total cholesterol.

Comparison 3 AGI versus diet and exercise, Outcome 12 Change in triglycerides.
![Comparison 3 AGI versus diet and exercise, Outcome 13 Change in HDL‐cholesterol [mmol/L].](/es/cdsr/doi/10.1002/14651858.CD005061.pub3/media/CDSR/CD005061/image_n/nCD005061-CMP-003-13.png)
Comparison 3 AGI versus diet and exercise, Outcome 13 Change in HDL‐cholesterol [mmol/L].
Comparison 3 AGI versus diet and exercise, Outcome 14 Change in body mass index.

Comparison 3 AGI versus diet and exercise, Outcome 15 Change in diastolic blood pressure.

Comparison 3 AGI versus diet and exercise, Outcome 16 Change in systolic blood pressure.

Comparison 4 AGI versus no intervention, Outcome 1 All‐cause mortality.
Comparison 4 AGI versus no intervention, Outcome 2 Incidence of type 2 diabetes.

Comparison 4 AGI versus no intervention, Outcome 3 Cardiovascular mortality.

Comparison 4 AGI versus no intervention, Outcome 4 Non‐fatal myocardial infarction.

Comparison 4 AGI versus no intervention, Outcome 5 Non‐fatal stroke.
Comparison 4 AGI versus no intervention, Outcome 6 Congestive heart failure.

Comparison 4 AGI versus no intervention, Outcome 7 Non‐serious adverse events.
Comparison 4 AGI versus no intervention, Outcome 8 Hypoglycaemia.

Comparison 4 AGI versus no intervention, Outcome 9 Fasting plasma glucose.

Comparison 4 AGI versus no intervention, Outcome 10 2‐h glucose measurements.

Comparison 4 AGI versus no intervention, Outcome 11 HbA1c.
Comparison 4 AGI versus no intervention, Outcome 12 Change in total cholesterol.

Comparison 4 AGI versus no intervention, Outcome 13 Change in HDL‐cholesterol.

Comparison 4 AGI versus no intervention, Outcome 14 Change in LDL‐cholesterol.
Comparison 4 AGI versus no intervention, Outcome 15 Change in triglycerides.
Comparison 4 AGI versus no intervention, Outcome 16 Change in body weight.
Comparison 4 AGI versus no intervention, Outcome 17 Change in body mass index.

Comparison 4 AGI versus no intervention, Outcome 18 Change in diastolic blood pressure.
Comparison 4 AGI versus no intervention, Outcome 19 Change in systolic blood pressure.
| Acarbose for prevention or delay of type 2 diabetes mellitus and its associated complications in people at risk of developing of type 2 diabetes mellitus | ||||||
| Population: people at risk of developing type 2 diabetes mellitus Settings: outpatients Intervention: alpha‐glucosidase inhibitors (acarbose) Comparison: placebo | ||||||
| Outcomes | Placebo | Acarbose | Relative effect | Number of participants Trials | Certainty of the evidence | Comments |
| All‐cause mortality Follow‐up: 3‐5 years | 56 per 1000 | 55 per 1000 (44 to 66) | RR 0.98 (0.82 to 1.18) | 8069 3 RCTs | ⊕⊝⊝⊝ | ‐ |
| Incidence of T2DM Follow‐up: 3‐5 years Definition of intermediate hyperglycaemia (definition of T2DM incidence): ACE 2017: FPG < 7.0 mmol/L; 2hPG ≥ 7.8 ‐ < 11.1 mmol/L (FPG ≥7.0 mmol/L; 2hPG ≥ 11.1 mmol/L) | 203 per 1000 | 167 per 1000 (152 to 181) | RR 0.82 (0.75 to 0.89) (95% prediction interval: 0.48 to 1.40) | 8008 3 RCTs | ⊕⊕⊕⊝ | ACE 2017 included participants with coronary heart disease and contributed 64.0% of cases |
| Serious adverse events Follow‐up: 3.3‐5 years | 95 per 1000 | 106 per 1000 (92 to 122) | RR 1.12 (0.97 to 1.29) | 6625 2 RCTs | ⊕⊕⊝⊝ | ‐ |
| Cardiovascular mortality Follow‐up: 3.3‐5 years | 42 per 1000 | 37 per 1000 (29 to 46) | RR 0.88 (0.71 to 1.10) | 8069 3 RCTs | ⊕⊝⊝⊝ | ‐ |
| (a)Non‐fatal myocardial infarction (b)Non‐fatal stroke (c)Congestive heart failure Follow‐up: 3.3 years | (a) 20 per 1000 (b) 6 per 1000 (c) 19 per 1000 | (a) 1 per 1000 (0 to 11) (b) 3 per 1000 (1 to 16) (c) 16 per 1000 (12 to 21) | (a) RR 0.10 (0.02 to 0.53) (b) RR 0.50 (0.09 to 2.74) (c) RR 0.87 (0.63 to 1.12) | (a) 1486 2 RCTs (b) 1368 1 RCT (c) 7890 2 RCTs | (a) ⊕⊝⊝⊝ Very lowd (c) ⊕⊕⊝⊝ | ‐ |
| Health‐related quality of life | Not reported | |||||
| Socioeconomic effects | Not reported | |||||
| *The basis for the assumed risk (e.g. the median control group risk across trials) is provided in footnotes. The corresponding risk (and its 95% confidence interval) is based on the assumed risk in the comparison group and the relative effect of the intervention (and its 95% CI). 2hPG: 2‐hour plasma glucose; CI: confidence interval; FPG: fasting plasma glucose;HbA1c: glycosylated haemoglobin A1c; IGT: impaired glucose tolerance; RCT: randomised controlled trial; RR: risk ratio; T2DM: type 2 diabetes mellitus | ||||||
| GRADE Working Group grades of evidence | ||||||
| aDowngraded by one level because of inconsistency in direction of effect and by two levels because of serious imprecision (confidence interval consistent with benefit and harm and small number of trials). See Appendix 17. | ||||||
| Acarbose for prevention or delay of type 2 diabetes mellitus and its associated complications in people at risk of developing type 2 diabetes mellitus | ||||||
| Population: people at risk of developing type 2 diabetes mellitus Settings: outpatients Intervention: alpha‐glucosidase inhibitors (acarbose) Comparison: no intervention | ||||||
| Outcomes | No intervention | Acarbose | Relative effect | Number of participants Trials | Certainty of the evidence | Comments |
| All‐cause mortality Follow‐up: 1‐5 years | See comment | 171 2 RCTs | ⊕⊝⊝⊝ | 2 of 4 trials reported mortality. No deaths occurred. | ||
| Incidence of T2DM Follow‐up: 1‐5 years Definition of intermediate hyperglycaemia (definition of T2DM incidence): Fang 2004 and Wang 2000: FPG < 7.8 mmol/L; 2hPG ≥ 7.8 ≤ 11.1 mmol/L (FPG ≥ 7.8 mmol/L; 2hPG ≥ 11.1 mmol/L) | 277 per 1000 | 86 per 1000 (39 to 191) | RR 0.31 (0.14 to 0.69) | 140 2 RCTs | ⊕⊝⊝⊝ | ‐ |
| Serious adverse events | Not reported | |||||
| Cardiovascular mortality Follow‐up: 1‐4.5 years | 49 per 1000 | 31 per 1000 (8 to 124) | RR 0.64 (0.16 to 2.56) | 205 2 RCTs | ⊕⊝⊝⊝ | ‐ |
| (a)Non‐fatal myocardial infarction (b)Non‐fatal stroke (c)Congestive heart failure Follow‐up: 1‐4.5 years | (a) 68 per 1000 (b) 39 per 1000 (c) 58 per 1000 | (a) 20 per 1000 (5 to 96) (b) 21 per 1000 (4 to 109) (c) 51per 1000 (16 to 159) | (a) RR 0.30 (0.07 to 1.41) (b) RR 0.53 (0.10 to 2.81) (c) RR 0.87 (0.27 to 2.73) | (a) 205 2 RCTs (b) 205 2 RCTs (c) 205 2 RCTs | (a) ⊕⊝⊝⊝ Very lowc (c) ⊕⊝⊝⊝ | ‐ |
| Health‐related quality of life | Not reported | |||||
| Socioeconomic effects | Not reported | |||||
| *The basis for the assumed risk (e.g. the median control group risk across trials) is provided in footnotes. The corresponding risk (and its 95% confidence interval) is based on the assumed risk in the comparison group and the relative effect of the intervention (and its 95% CI). | ||||||
| GRADE Working Group grades of evidence | ||||||
| aDowngraded by one level because of risk of bias (unclear selection bias and selective reporting), and by two levels because of serious imprecision (small number of trials, small sample size and the outcome not being a common event). See Appendix 18. | ||||||
| Trial ID | Intervention(s) and comparator(s) | Short description of power and sample size calculation | Screened/eligible | Randomised | ITT | Analysed | Finishing trial | Randomised finishing trial | Follow‐up |
| ABC 2017 (parallel RCT) | Intervention 1: voglibose | "Given a hazard ratio (HR) of 0.717 with survival rates of 89% at 24 months in the control group, we estimated the total sample size of 3000 subjects along with 325 events (1500 per group), providing 85% power of one‐sided log‐rank test of 2.5% significance level to detect the assumed reduction, assuming the loss of patients during the follow‐up to be 15%" | ‐/870 | 428 | 424 | 424 | 424 | 99.1 | 2 years |
| Comparator 1: diet and exercise | 442 | 435 | 435 | 435 | 98.4 | ||||
| total: | 870 | 859 | 859 | 859 | 98.7 | ||||
| ACE 2017(parallel RCT) | Intervention 1: acarbose | "7268 patients were required with 904 adjudicated primary composite cardiovascular end points to achieve 90% power. The population size was reduced from 7500 to 6500, with an estimated 728 confirmed composite primary outcome required to have at least 85% power to detect a 20% risk reduction for acarbose, compared with placebo (two‐sided α=0·05)" | 15204/7671 | 3272 | 3272 | 3272 | 3092 | 94.5 | Median of 5 years |
| Comparator 1: placebo | 3250 | 3250 | 3250 | 3064 | 94.3 | ||||
| total: | 6522 | 6522 | 6522 | 6156 | 94.3 | ||||
| Yun 2016(parallel RCT) | Intervention 1: acarbose | ‐ | 426/135 | 67 | ‐ | 60 | 60 | 89.55 | 1‐4.5 years |
| Comparator 1: no intervention | 68 | ‐ | 64 | 64 | 94.12 | ||||
| total: | 135 | ‐ | 124 | 124 | 91.85 | ||||
| Koyasu 2010(parallel RCT) | Intervention 1: acarbose | ‐ | ‐/90 | 45 | ‐ | 42 | 42 | 93.33 | 1 year |
| Comparator 1: no intervention | 45 | ‐ | 39 | 39 | 86.67 | ||||
| total: | 90 | ‐ | 81 | 81 | 90 | ||||
| Kawamori 2009(parallel RCT) | Intervention 1: voglibose | "Assuming a conversion rate of 7.7% per year, a study duration of 4.9 years, and a drop‐out rate of 5%, the planned sample size was 864 (90% power to detect a 40% reduction in the primary endpoint with a two‐sided type I error of 0·05). Due to greater improvement to normoglycaemia than expected, sample size increased to 1728" | 4582/1780 | 897 | ‐ | 897 | 768 | 85.62 | Until diagnosis of normoglycaemia or diabetes type 2, or at least 3 years |
| Comparator 1: placebo | 883 | ‐ | 881 | 737 | 83.47 | ||||
| total: | 1780 | ‐ | 1778 | 1505 | 84.55 | ||||
| Fang 2004(parallel RCT) | Intervention 1: acarbose | ‐ | ‐/‐ | 50 | ‐ | 45 | 45 | 90 | 5 years |
| Comparator 1: no intervention | 40 | ‐ | 35 | 35 | 87.5 | ||||
| Comparator 2: metformin | 48 | ‐ | 44 | 44 | 91.67 | ||||
| Comparator 3: diet and exercise | 40 | ‐ | 36 | 36 | 90 | ||||
| total: | 178 | ‐ | 160 | 160 | 89.89 | ||||
| Wang 2000(parallel RCT) | Intervention 1: acarbose | ‐ | ‐/61 | 31 | ‐ | 30 | 30 | 96.77 | 1 year |
| Comparator 1: No intervention | 30 | ‐ | 30 | 30 | 100 | ||||
| total: | 61 | ‐ | 60 | 60 | 98.36 | ||||
| DAISI 2008(parallel RCT) | Intervention 1: acarbose | 47 participants in each treatment group with alpha (2‐sided) = 0.05 and beta = 0.05 | 6651/118 | 60 | 60 | 60 | 30 | 50 | 3 years |
| Comparator 1: placebo | p8 | 58 | 58 | 36 | 62.07 | ||||
| total: | 118 | 118 | 118 | 66 | 55.93 | ||||
| EDIT 1997(factorial RCT) | Intervention 1: acarbose + placebo | ‐ | ‐/631 | 157 | ‐ | ‐ | ‐ | ‐ | 6 years |
| Comparator 1: placebo + placebo | 159 | ‐ | ‐ | ‐ | ‐ | ||||
| Comparator 2: metformin + placebo | 160 | ‐ | ‐ | ‐ | ‐ | ||||
| Comparator 3: metformin + acarbose | 155 | ‐ | ‐ | ‐ | ‐ | ||||
| total: | 631 | ‐ | ‐ | 522 | 82.73 | ||||
| STOP‐NIDDM 2002(parallel RCT) | Intervention 1: acarbose | "It was estimated that 600 patients would be required in each treatment group for a 2‐tailed alpha of .05 and a 1‐beta of 90% assuming a conversion rate of 7% per year, a 36% risk reduction, and a drop‐out rate of 10%" | 14742/1429 | 714 | 682 | 682 | 471 | 65.97 | mean 3.3 years |
| Comparator 1: placebo | 715 | 686 | 686 | 556 | 77.76 | ||||
| total: | 1429 | 1368 | 1368 | 1027 | 71.87 | ||||
| Grand total | All interventions | 5721 | 4962 (excl. EDIT 1997) | ||||||
| All comparators | 6093 | 5076 (excl. EDIT 1997) | |||||||
| All interventions and comparators | 11,814 | 10,038 (excl. EDIT 1997) 10,560 (incl. EDIT 1997) | |||||||
| ‐ denotes not reported; ITT: intention‐to‐treat; RCT: randomised controlled trial aFollow‐up under randomised conditions until end of trial ( (= duration of intervention + follow‐up post‐intervention or identical to duration of intervention); extended follow‐up refers to follow‐up of participants once the original trial was terminated as specified in the power calculation. | |||||||||
| Outcome or subgroup title | No. of studies | No. of participants | Statistical method | Effect size |
| 1 All‐cause mortality Show forest plot | 4 | 9847 | Risk Ratio (M‐H, Random, 95% CI) | 1.24 [0.53, 2.90] |
| 1.1 Acarbose | 3 | 8069 | Risk Ratio (M‐H, Random, 95% CI) | 0.98 [0.82, 1.18] |
| 1.2 Voglibose | 1 | 1778 | Risk Ratio (M‐H, Random, 95% CI) | 12.77 [0.72, 226.31] |
| 2 Incidence of type 2 diabetes Show forest plot | 4 | 9786 | Risk Ratio (M‐H, Random, 95% CI) | 0.73 [0.59, 0.90] |
| 2.1 Acarbose | 3 | 8008 | Risk Ratio (M‐H, Random, 95% CI) | 0.82 [0.75, 0.89] |
| 2.2 Voglibose | 1 | 1778 | Risk Ratio (M‐H, Random, 95% CI) | 0.46 [0.34, 0.64] |
| 3 Serious adverse events Show forest plot | 3 | 8403 | Risk Ratio (M‐H, Random, 95% CI) | 1.12 [0.97, 1.30] |
| 3.1 Acarbose | 2 | 6625 | Risk Ratio (M‐H, Random, 95% CI) | 1.12 [0.97, 1.29] |
| 3.2 Voglibose | 1 | 1778 | Risk Ratio (M‐H, Random, 95% CI) | 2.46 [0.48, 12.62] |
| 4 Cardiovascular mortality Show forest plot | 4 | 9847 | Risk Ratio (M‐H, Random, 95% CI) | 0.89 [0.72, 1.10] |
| 4.1 Acarbose | 3 | 8069 | Risk Ratio (M‐H, Random, 95% CI) | 0.88 [0.71, 1.10] |
| 4.2 Voglibose | 1 | 1778 | Risk Ratio (M‐H, Random, 95% CI) | 2.95 [0.12, 72.23] |
| 5 Non‐fatal myocardial infarction Show forest plot | 2 | 1486 | Risk Ratio (M‐H, Random, 95% CI) | 0.10 [0.02, 0.53] |
| 6 Non‐fatal stroke Show forest plot | 1 | 1368 | Risk Ratio (M‐H, Random, 95% CI) | 0.50 [0.09, 2.74] |
| 7 Congestive heart failure Show forest plot | 2 | 7890 | Risk Ratio (M‐H, Random, 95% CI) | 0.87 [0.63, 1.21] |
| 8 Non‐serious adverse events Show forest plot | 3 | 3328 | Risk Ratio (M‐H, Random, 95% CI) | 1.04 [1.02, 1.06] |
| 8.1 Acarbose | 2 | 1550 | Risk Ratio (M‐H, Random, 95% CI) | 1.04 [1.01, 1.06] |
| 8.2 Voglibose | 1 | 1778 | Risk Ratio (M‐H, Random, 95% CI) | 1.06 [1.02, 1.10] |
| 9 Hypoglycaemia Show forest plot | 1 | 6522 | Risk Ratio (M‐H, Random, 95% CI) | 1.01 [0.89, 1.14] |
| 10 Fasting plasma glucose Show forest plot | 3 | 7368 | Mean Difference (IV, Random, 95% CI) | ‐0.07 [‐0.12, ‐0.02] |
| 11 2‐h glucose measurements Show forest plot | 3 | 6498 | Mean Difference (IV, Random, 95% CI) | ‐0.53 [‐0.92, ‐0.14] |
| 12 HbA1c Show forest plot | 3 | 6833 | Mean Difference (IV, Random, 95% CI) | ‐0.08 [‐0.12, ‐0.05] |
| 13 Change in total cholesterol Show forest plot | 3 | 6815 | Mean Difference (IV, Random, 95% CI) | ‐0.05 [‐0.10, 0.00] |
| 14 Change in HDL‐cholesterol Show forest plot | 3 | 6807 | Mean Difference (IV, Random, 95% CI) | 0.01 [‐0.00, 0.03] |
| 15 Change in LDL‐cholesterol Show forest plot | 3 | 6699 | Mean Difference (IV, Random, 95% CI) | ‐0.03 [‐0.07, 0.01] |
| 16 Change in triglycerides Show forest plot | 3 | 6843 | Mean Difference (IV, Random, 95% CI) | ‐0.07 [‐0.17, 0.03] |
| 17 Change in body weight Show forest plot | 2 | 6959 | Mean Difference (IV, Random, 95% CI) | ‐0.67 [‐1.57, 0.23] |
| 18 Change in body mass index Show forest plot | 2 | 6953 | Mean Difference (IV, Random, 95% CI) | ‐0.18 [‐0.39, 0.03] |
| 19 Change in diastolic blood pressure Show forest plot | 2 | 7452 | Mean Difference (IV, Random, 95% CI) | ‐0.29 [‐0.78, 0.21] |
| 20 Change in systolic blood pressure Show forest plot | 2 | 7452 | Mean Difference (IV, Random, 95% CI) | ‐0.47 [‐1.26, 0.32] |
| Outcome or subgroup title | No. of studies | No. of participants | Statistical method | Effect size |
| 1 All‐cause mortality Show forest plot | 1 | Risk Ratio (M‐H, Fixed, 95% CI) | Totals not selected | |
| 2 Incidence of type 2 diabetes Show forest plot | 1 | Risk Ratio (M‐H, Fixed, 95% CI) | Totals not selected | |
| 3 Fasting plasma glucose Show forest plot | 1 | Mean Difference (IV, Fixed, 95% CI) | Totals not selected | |
| 4 2‐h glucose measurements Show forest plot | 1 | Mean Difference (IV, Fixed, 95% CI) | Totals not selected | |
| 5 Change in total cholesterol Show forest plot | 1 | Mean Difference (IV, Fixed, 95% CI) | Totals not selected | |
| 6 Change in triglycerides Show forest plot | 1 | Mean Difference (IV, Fixed, 95% CI) | Totals not selected | |
| 7 Change in body mass index Show forest plot | 1 | Mean Difference (IV, Fixed, 95% CI) | Totals not selected | |
| 8 Change in diastolic blood pressure Show forest plot | 1 | Mean Difference (IV, Fixed, 95% CI) | Totals not selected | |
| 9 Change in systolic blood pressure Show forest plot | 1 | Mean Difference (IV, Fixed, 95% CI) | Totals not selected | |
| Outcome or subgroup title | No. of studies | No. of participants | Statistical method | Effect size |
| 1 All‐cause mortality Show forest plot | 2 | Risk Ratio (M‐H, Fixed, 95% CI) | Totals not selected | |
| 1.1 Acarbose | 1 | Risk Ratio (M‐H, Fixed, 95% CI) | 0.0 [0.0, 0.0] | |
| 1.2 Voglibose | 1 | Risk Ratio (M‐H, Fixed, 95% CI) | 0.0 [0.0, 0.0] | |
| 2 Incidence of type 2 diabetes Show forest plot | 1 | Risk Ratio (M‐H, Fixed, 95% CI) | Totals not selected | |
| 3 Cardiovascular mortality Show forest plot | 1 | Risk Ratio (M‐H, Fixed, 95% CI) | Totals not selected | |
| 4 Non‐fatal myocardial infarction Show forest plot | 1 | Risk Ratio (M‐H, Fixed, 95% CI) | Totals not selected | |
| 5 Non‐fatal stroke Show forest plot | 1 | Risk Ratio (M‐H, Fixed, 95% CI) | Totals not selected | |
| 6 Congestive heart failure Show forest plot | 1 | Risk Ratio (M‐H, Fixed, 95% CI) | Totals not selected | |
| 7 Non‐serious adverse events Show forest plot | 1 | Risk Ratio (M‐H, Fixed, 95% CI) | Totals not selected | |
| 8 Fasting plasma glucose Show forest plot | 2 | 509 | Mean Difference (IV, Random, 95% CI) | ‐1.33 [‐2.15, ‐0.51] |
| 8.1 Acarbose | 1 | 81 | Mean Difference (IV, Random, 95% CI) | ‐1.37 [‐2.24, ‐0.50] |
| 8.2 Voglibose | 1 | 428 | Mean Difference (IV, Random, 95% CI) | ‐1.0 [‐3.44, 1.44] |
| 9 2‐h glucose measurements Show forest plot | 2 | 472 | Mean Difference (IV, Random, 95% CI) | ‐2.74 [‐3.74, ‐1.74] |
| 9.1 Acarbose | 1 | 81 | Mean Difference (IV, Random, 95% CI) | ‐2.79 [‐3.79, ‐1.79] |
| 9.2 Voglibose | 1 | 391 | Mean Difference (IV, Random, 95% CI) | 0.7 [‐7.53, 8.93] |
| 10 HbA1c Show forest plot | 1 | Mean Difference (IV, Fixed, 95% CI) | Totals not selected | |
| 11 Change in total cholesterol Show forest plot | 2 | 586 | Mean Difference (IV, Random, 95% CI) | ‐0.49 [‐1.32, 0.33] |
| 11.1 Acarbose | 1 | 81 | Mean Difference (IV, Random, 95% CI) | ‐0.50 [‐1.33, 0.33] |
| 11.2 Voglibose | 1 | 505 | Mean Difference (IV, Random, 95% CI) | 0.0 [‐6.47, 6.47] |
| 12 Change in triglycerides Show forest plot | 2 | 612 | Mean Difference (IV, Random, 95% CI) | ‐0.10 [‐0.76, 0.56] |
| 12.1 Acarbose | 1 | 81 | Mean Difference (IV, Random, 95% CI) | ‐0.10 [‐0.76, 0.56] |
| 12.2 Voglibose | 1 | 531 | Mean Difference (IV, Random, 95% CI) | ‐0.1 [‐17.03, 16.83] |
| 13 Change in HDL‐cholesterol [mmol/L] Show forest plot | 1 | 545 | Mean Difference (IV, Random, 95% CI) | 0.0 [‐2.51, 2.51] |
| 14 Change in body mass index Show forest plot | 1 | Mean Difference (IV, Fixed, 95% CI) | Totals not selected | |
| 15 Change in diastolic blood pressure Show forest plot | 2 | 667 | Mean Difference (IV, Random, 95% CI) | 1.25 [‐1.65, 4.15] |
| 16 Change in systolic blood pressure Show forest plot | 2 | 668 | Mean Difference (IV, Random, 95% CI) | ‐1.94 [‐8.71, 4.83] |
| 16.1 Acarbose | 1 | 81 | Mean Difference (IV, Random, 95% CI) | ‐6.00 [‐12.23, 0.23] |
| 16.2 Voglibose | 1 | 587 | Mean Difference (IV, Random, 95% CI) | 1.0 [‐1.92, 3.92] |
| Outcome or subgroup title | No. of studies | No. of participants | Statistical method | Effect size |
| 1 All‐cause mortality Show forest plot | 2 | 171 | Risk Ratio (M‐H, Random, 95% CI) | 0.0 [0.0, 0.0] |
| 2 Incidence of type 2 diabetes Show forest plot | 2 | 140 | Risk Ratio (M‐H, Random, 95% CI) | 0.31 [0.14, 0.69] |
| 3 Cardiovascular mortality Show forest plot | 2 | Risk Ratio (M‐H, Fixed, 95% CI) | Totals not selected | |
| 4 Non‐fatal myocardial infarction Show forest plot | 2 | Risk Ratio (M‐H, Fixed, 95% CI) | Subtotals only | |
| 5 Non‐fatal stroke Show forest plot | 2 | Risk Ratio (M‐H, Fixed, 95% CI) | Subtotals only | |
| 6 Congestive heart failure Show forest plot | 2 | 205 | Risk Ratio (M‐H, Random, 95% CI) | 0.87 [0.27, 2.73] |
| 7 Non‐serious adverse events Show forest plot | 1 | Risk Ratio (M‐H, Fixed, 95% CI) | Totals not selected | |
| 8 Hypoglycaemia Show forest plot | 1 | Risk Ratio (M‐H, Fixed, 95% CI) | Totals not selected | |
| 9 Fasting plasma glucose Show forest plot | 3 | 285 | Mean Difference (IV, Random, 95% CI) | ‐0.35 [‐0.79, 0.08] |
| 10 2‐h glucose measurements Show forest plot | 3 | 285 | Mean Difference (IV, Random, 95% CI) | ‐2.50 [‐4.18, ‐0.83] |
| 11 HbA1c Show forest plot | 2 | Mean Difference (IV, Random, 95% CI) | Subtotals only | |
| 12 Change in total cholesterol Show forest plot | 3 | 285 | Mean Difference (IV, Random, 95% CI) | ‐0.32 [‐0.74, 0.10] |
| 13 Change in HDL‐cholesterol Show forest plot | 1 | Mean Difference (IV, Fixed, 95% CI) | Totals not selected | |
| 14 Change in LDL‐cholesterol Show forest plot | 2 | 205 | Mean Difference (IV, Random, 95% CI) | ‐0.03 [‐0.22, 0.15] |
| 15 Change in triglycerides Show forest plot | 3 | 285 | Mean Difference (IV, Random, 95% CI) | ‐0.22 [‐0.40, ‐0.05] |
| 16 Change in body weight Show forest plot | 1 | Mean Difference (IV, Fixed, 95% CI) | Totals not selected | |
| 17 Change in body mass index Show forest plot | 3 | 285 | Mean Difference (IV, Random, 95% CI) | ‐0.65 [‐1.01, ‐0.30] |
| 18 Change in diastolic blood pressure Show forest plot | 3 | 285 | Mean Difference (IV, Random, 95% CI) | ‐0.26 [‐3.80, 3.28] |
| 19 Change in systolic blood pressure Show forest plot | 3 | 285 | Mean Difference (IV, Random, 95% CI) | ‐3.68 [‐6.46, ‐0.90] |