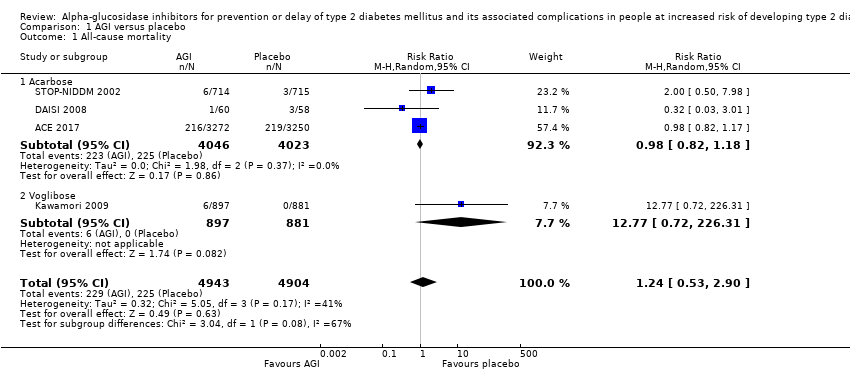
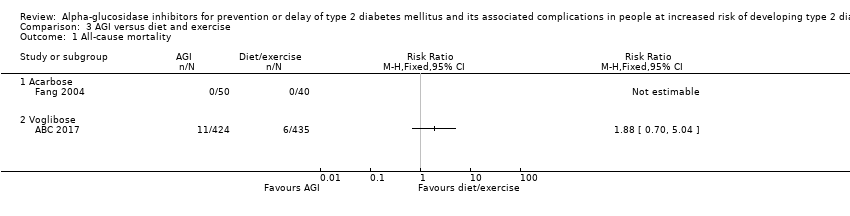
| 1 All‐cause mortality Show forest plot | 4 | 9847 | Risk Ratio (M‐H, Random, 95% CI) | 1.24 [0.53, 2.90] |
|
| 1.1 Acarbose | 3 | 8069 | Risk Ratio (M‐H, Random, 95% CI) | 0.98 [0.82, 1.18] |
| 1.2 Voglibose | 1 | 1778 | Risk Ratio (M‐H, Random, 95% CI) | 12.77 [0.72, 226.31] |
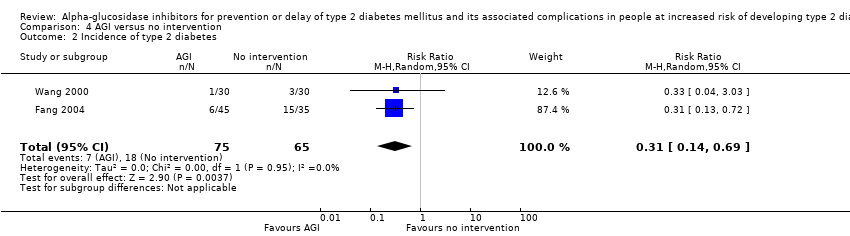
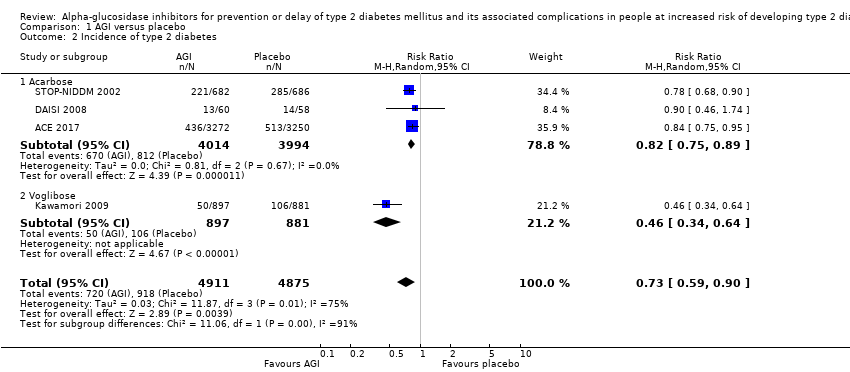
| 2 Incidence of type 2 diabetes Show forest plot | 4 | 9786 | Risk Ratio (M‐H, Random, 95% CI) | 0.73 [0.59, 0.90] |
|
| 2.1 Acarbose | 3 | 8008 | Risk Ratio (M‐H, Random, 95% CI) | 0.82 [0.75, 0.89] |
| 2.2 Voglibose | 1 | 1778 | Risk Ratio (M‐H, Random, 95% CI) | 0.46 [0.34, 0.64] |
| 3 Serious adverse events Show forest plot | 3 | 8403 | Risk Ratio (M‐H, Random, 95% CI) | 1.12 [0.97, 1.30] |
|
| 3.1 Acarbose | 2 | 6625 | Risk Ratio (M‐H, Random, 95% CI) | 1.12 [0.97, 1.29] |
| 3.2 Voglibose | 1 | 1778 | Risk Ratio (M‐H, Random, 95% CI) | 2.46 [0.48, 12.62] |
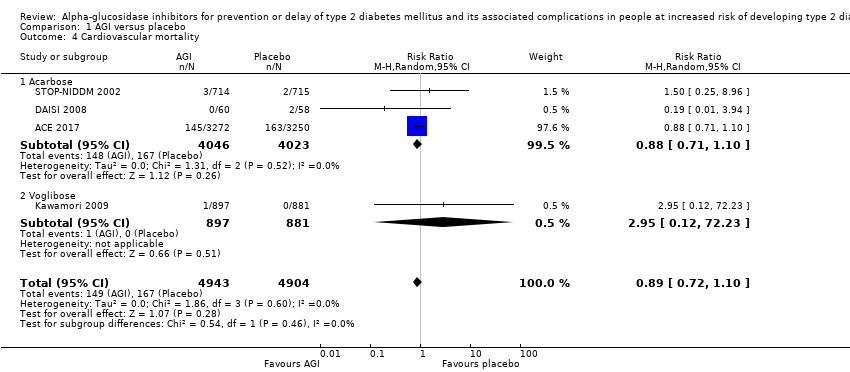
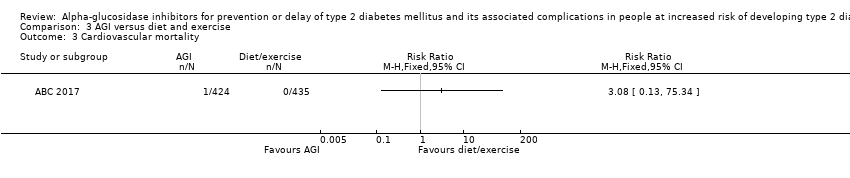
| 4 Cardiovascular mortality Show forest plot | 4 | 9847 | Risk Ratio (M‐H, Random, 95% CI) | 0.89 [0.72, 1.10] |
|
| 4.1 Acarbose | 3 | 8069 | Risk Ratio (M‐H, Random, 95% CI) | 0.88 [0.71, 1.10] |
| 4.2 Voglibose | 1 | 1778 | Risk Ratio (M‐H, Random, 95% CI) | 2.95 [0.12, 72.23] |
| 5 Non‐fatal myocardial infarction Show forest plot | 2 | 1486 | Risk Ratio (M‐H, Random, 95% CI) | 0.10 [0.02, 0.53] |
|
| 6 Non‐fatal stroke Show forest plot | 1 | 1368 | Risk Ratio (M‐H, Random, 95% CI) | 0.50 [0.09, 2.74] |
|
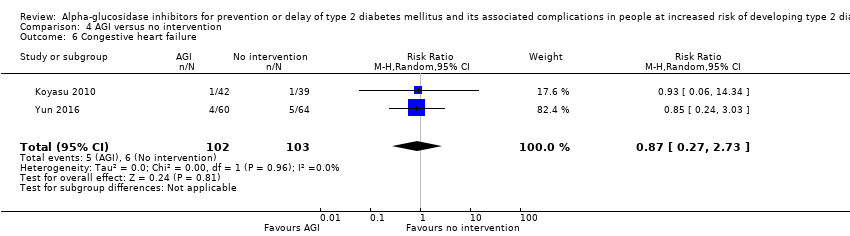
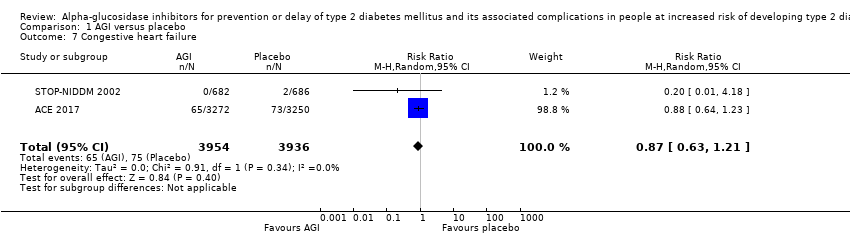
| 7 Congestive heart failure Show forest plot | 2 | 7890 | Risk Ratio (M‐H, Random, 95% CI) | 0.87 [0.63, 1.21] |
|
| 8 Non‐serious adverse events Show forest plot | 3 | 3328 | Risk Ratio (M‐H, Random, 95% CI) | 1.04 [1.02, 1.06] |
|
| 8.1 Acarbose | 2 | 1550 | Risk Ratio (M‐H, Random, 95% CI) | 1.04 [1.01, 1.06] |
| 8.2 Voglibose | 1 | 1778 | Risk Ratio (M‐H, Random, 95% CI) | 1.06 [1.02, 1.10] |
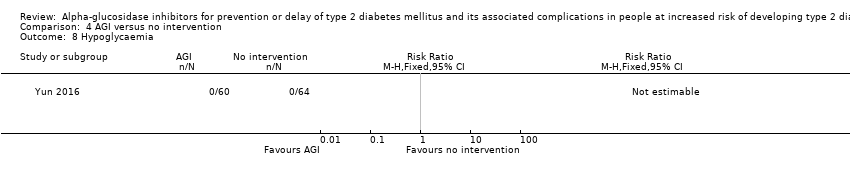
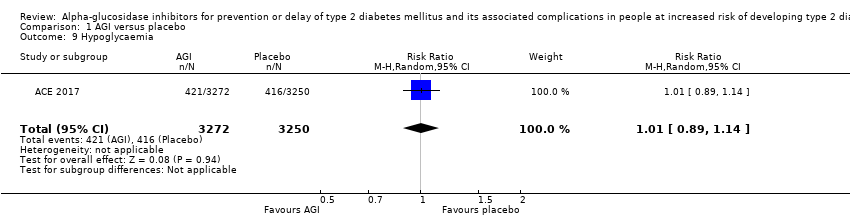
| 9 Hypoglycaemia Show forest plot | 1 | 6522 | Risk Ratio (M‐H, Random, 95% CI) | 1.01 [0.89, 1.14] |
|
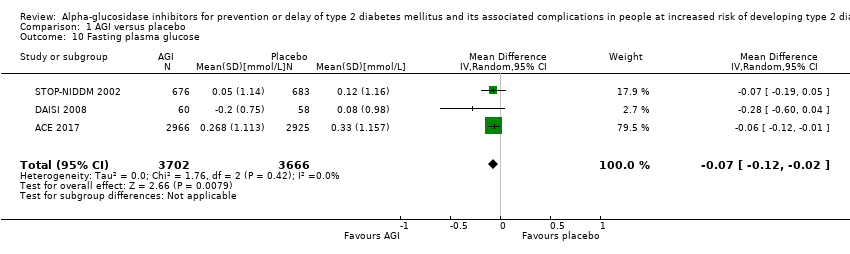
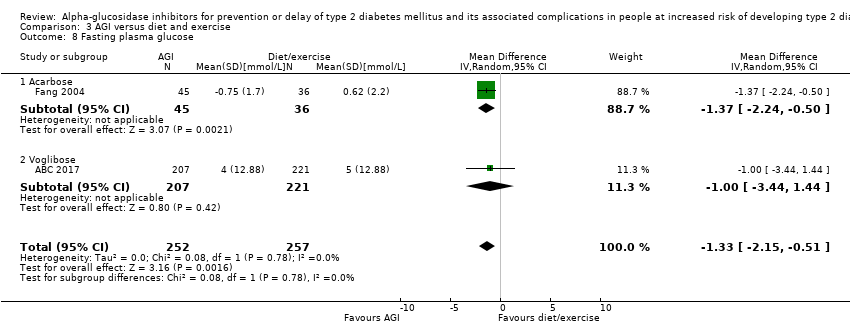
| 10 Fasting plasma glucose Show forest plot | 3 | 7368 | Mean Difference (IV, Random, 95% CI) | ‐0.07 [‐0.12, ‐0.02] |
|
| 11 2‐h glucose measurements Show forest plot | 3 | 6498 | Mean Difference (IV, Random, 95% CI) | ‐0.53 [‐0.92, ‐0.14] |
|
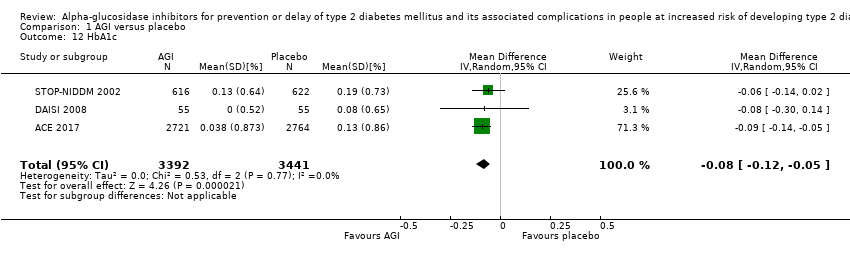
| 12 HbA1c Show forest plot | 3 | 6833 | Mean Difference (IV, Random, 95% CI) | ‐0.08 [‐0.12, ‐0.05] |
|
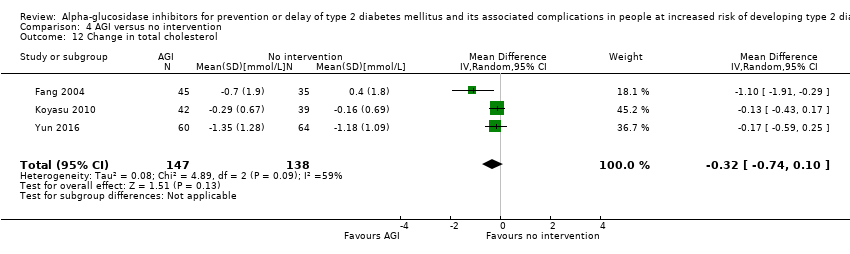
| 13 Change in total cholesterol Show forest plot | 3 | 6815 | Mean Difference (IV, Random, 95% CI) | ‐0.05 [‐0.10, 0.00] |
|
| 14 Change in HDL‐cholesterol Show forest plot | 3 | 6807 | Mean Difference (IV, Random, 95% CI) | 0.01 [‐0.00, 0.03] |
|
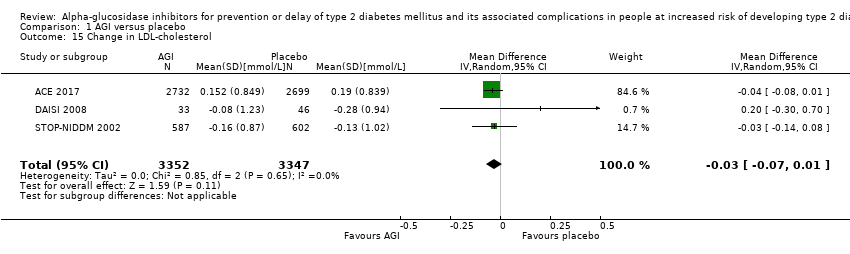
| 15 Change in LDL‐cholesterol Show forest plot | 3 | 6699 | Mean Difference (IV, Random, 95% CI) | ‐0.03 [‐0.07, 0.01] |
|
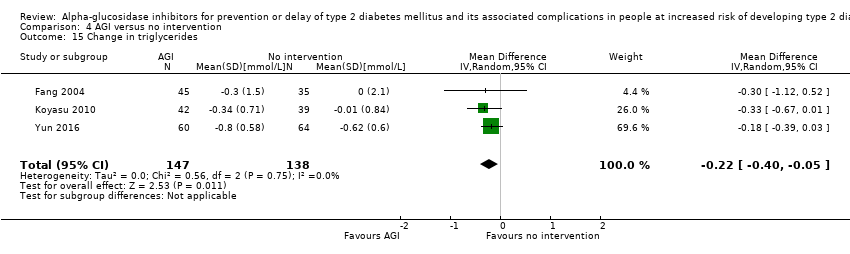
| 16 Change in triglycerides Show forest plot | 3 | 6843 | Mean Difference (IV, Random, 95% CI) | ‐0.07 [‐0.17, 0.03] |
|
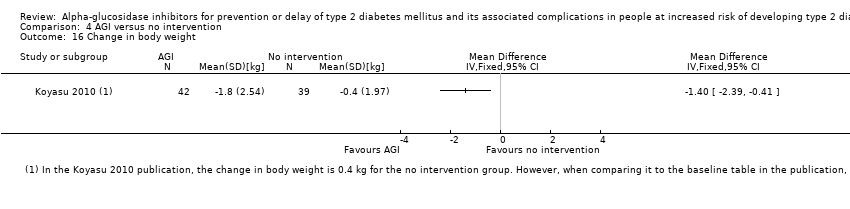
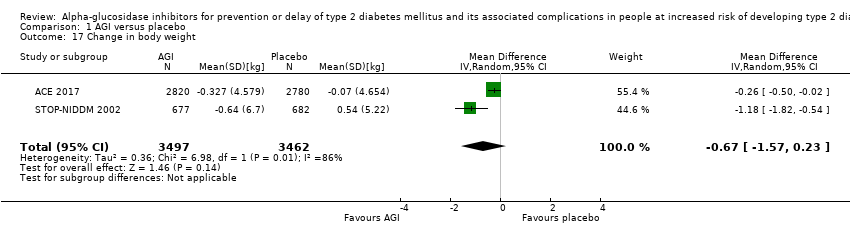
| 17 Change in body weight Show forest plot | 2 | 6959 | Mean Difference (IV, Random, 95% CI) | ‐0.67 [‐1.57, 0.23] |
|
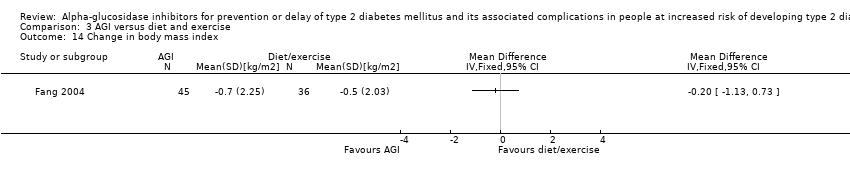
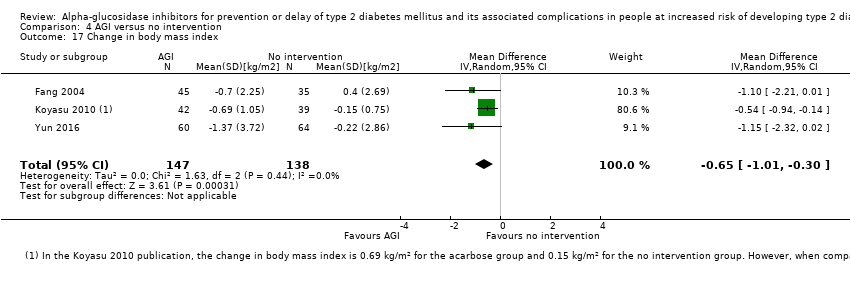
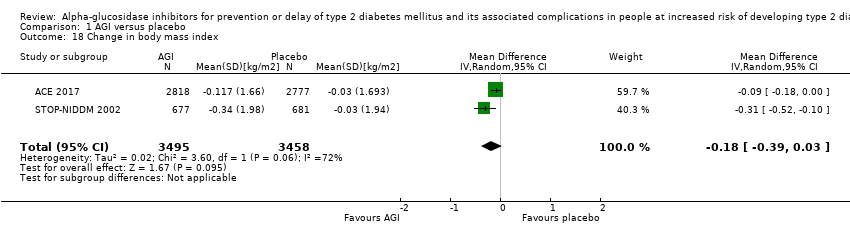
| 18 Change in body mass index Show forest plot | 2 | 6953 | Mean Difference (IV, Random, 95% CI) | ‐0.18 [‐0.39, 0.03] |
|
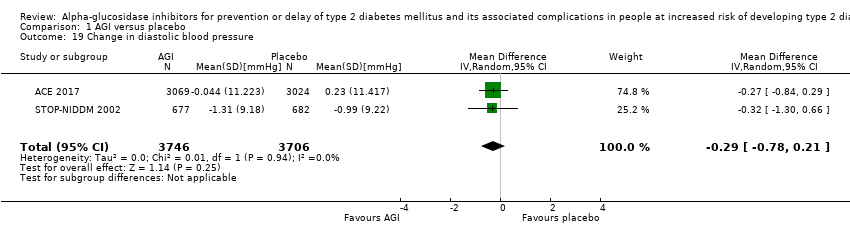
| 19 Change in diastolic blood pressure Show forest plot | 2 | 7452 | Mean Difference (IV, Random, 95% CI) | ‐0.29 [‐0.78, 0.21] |
|
| 20 Change in systolic blood pressure Show forest plot | 2 | 7452 | Mean Difference (IV, Random, 95% CI) | ‐0.47 [‐1.26, 0.32] |
|


![Comparison 3 AGI versus diet and exercise, Outcome 13 Change in HDL‐cholesterol [mmol/L].](/es/cdsr/doi/10.1002/14651858.CD005061.pub3/media/CDSR/CD005061/image_n/nCD005061-CMP-003-13.png)