نقش مهار کنندههای آلفا‐گلوکوزیداز در پیشگیری یا به تاخیر انداختن بروز دیابت ملیتوس نوع 2 و عوارض مرتبط با آن در افراد در معرض خطر بالای ابتلا به دیابت ملیتوس نوع 2
چکیده
پیشینه
مهار کنندههای آلفا‐گلوکوزیداز (alpha‐glucosidase; AGI) میتوانند سطوح گلوکز خون را کاهش داده و بنابراین منجر به پیشگیری یا تاخیر در بروز دیابت ملیتوس نوع 2 (T2DM) و عوارض مرتبط با آن در افراد در معرض خطر بالای ابتلا به T2DM شوند.
اهداف
ارزیابی اثرات AGI در افراد مبتلا به اختلال تحمل گلوکز (impaired glucose tolerance; IGT)، اختلال در قند خون ناشتا (impaired fasting blood glucose; IFG)، افزایش متوسط هموگلوبین گلیکوزیله A1c؛ (glycosylated haemoglobin A1c; HbA1c) یا هر ترکیبی از اینها.
روشهای جستوجو
ما CENTRAL؛ MEDLINE؛ Embase؛ ClinicalTrials.gov؛ پلتفرم بینالمللی پایگاه ثبت کارآزماییهای بالینی سازمان جهانی بهداشت (WHO)؛ و فهرست منابع مرورهای سیستماتیک، مقالات و گزارشهای ارزیابی فنآوریهای سلامت را جستوجو کردیم. تاریخ آخرین جستوجو در تمام بانکهای اطلاعاتی دسامبر 2017 بود.
معیارهای انتخاب
کارآزماییهای تصادفیسازی و کنترل شدهای (randomised controlled trials; RCTs) را وارد کردیم که به مدت حداقل یک سال یا بیشتر انجام شده، و به مقایسه AGI با هر نوع مداخله دارویی کاهش دهنده گلوکز، مداخلات تغییر دهنده رفتاری، دارونما (placebo) یا عدم مداخله در افراد مبتلا به IFG؛ IGT؛ HbA1c نسبتا بالا یا ترکیبی از اینها پرداختند.
گردآوری و تجزیهوتحلیل دادهها
دو نویسنده مرور تمام خلاصه مقالات و متن کامل مقالات و رکوردها را مطالعه کردند، کیفیت دادهها را ارزیابی و استخراج دادههای پیامد را مستقلا انجام دادند. یک نویسنده مرور دادهها را استخراج کرد، که توسط نویسنده دوم مرور بررسی شد. اختلافات را با اجماع نظر یا دخالت نویسنده سوم مرور حلوفصل کردیم. برای متاآنالیزها، از یک مدل اثرات تصادفی با بررسی خطرهای نسبی (RRs) برای پیامدهای دو‐حالتی و تفاوتهای میانگین (MDs) برای پیامدهای پیوسته، با استفاده از 95% فاصله اطمینان (CIs) برای برآوردهای اثر، استفاده کردیم. کیفیت کلی شواهد را با استفاده از ابزار درجهبندی توصیه، ارزیابی، توسعه و ارزشیابی (GRADE) ارزیابی کردیم.
نتایج اصلی
برای این بهروزرسانی مرور کاکرین (اولین بار در سال 2006، شماره 4 منتشر شد)، 10 RCT (11,814 شرکتکننده)، هشت مورد با محوریت آکاربوز (acarbose) و دو مورد پیرامون وگلیبوز (voglibose)، را وارد کردیم که شامل افراد مبتلا به IGT یا افراد «در معرض خطر ابتلا به دیابت» بودند. مدت زمان کارآزمایی از یک تا شش ماه متفاوت بود. بیشتر کارآزماییها AGI را با دارونما (4 = N) یا عدم مداخله (4 = N) مقایسه کردند.
آکاربوز در مقایسه با دارونما بروز T2DM را کاهش داد: 670 مورد از 4014 نفر (16.7%) در گروههای آکاربوز و 812 مورد از 3994 نفر (20.3%) در گروههای دارونما به T2DM مبتلا شدند (RR: 0.82؛ 95% CI؛ 0.75 تا 0.89؛ P <0.0001؛ 3 کارآزمایی؛ 8008 شرکتکننده؛ شواهد با قطعیت متوسط). یک کارآزمایی شامل شرکتکنندگان مبتلا به بیماری کرونری قلب و IGT حدود 64% موارد را برای این پیامد فراهم کرد. آکاربوز خطر T2DM را در مقایسه با عدم مداخله کاهش داد: 7 مورد از 75 نفر (9.3%) در گروههای آکاربوز و 18 مورد از 65 نفر (27.7%) در گروههای عدم مداخله دچار T2DM شدند (RR: 0.31؛ 95% CI؛ 0.14 تا 0.69؛ P = 0.004؛ 2 کارآزمایی؛ 140 شرکتکننده؛ شواهد با قطعیت بسیار پائین).
آکاربوز در مقایسه با دارونما خطر مورتالیتی به هر علتی (RR: 0.98؛ 95% CI؛ 0.82 تا 1.18؛ P = 0.86؛ 3 کارآزمایی؛ 8069 شرکتکننده؛ شواهد با قطعیت بسیار پائین)، مورتالیتی قلبیعروقی (RR: 0.88؛ 95% CI؛ 0.71 تا 1.10؛ P = 0.26؛ 3 کارآزمایی؛ 8069 شرکتکننده؛ شواهد با قطعیت بسیار پائین)، عوارض جانبی جدی (RR: 1.12؛ 95% CI؛ 0.97 تا 1.29؛ P = 0.13؛ 2 کارآزمایی؛ 6625 شرکتکننده؛ شواهد با قطعیت پائین)، سکته مغزی غیر‐کشنده (RR: 0.50؛ 95% CI؛ 0.09 تا 2.74؛ P = 0.43؛ 1 کارآزمایی؛ 1368 شرکتکننده؛ شواهد با قطعیت بسیار پائین) یا نارسایی احتقانی قلب (RR: 0.87؛ 95% CI؛ 0.63 تا 1.12؛ P = 0.40؛ 2 کارآزمایی؛ 7890 شرکتکننده؛ شواهد با قطعیت پائین) را کاهش یا افزایش نمیدهد. آکاربوز در مقایسه با دارونما انفارکتوس میوکارد غیر‐کشنده را کاهش داد: یک نفر از 742 شرکتکننده (0.1%) در گروههای آکاربوز در مقایسه با 15 نفر از 744 شرکتکننده (2%) در گروههای دارونما دچار این عارضه شدند (RR: 0.10؛ 95% CI؛ 0.02 تا 0.53؛ P = 0.007؛ 2 کارآزمایی؛ 1486 شرکتکننده؛ شواهد با قطعیت بسیار پائین). درمان با آکاربوز در مقایسه با دارونما افزایش خطر وقوع عوارض جانبی غیر‐جدی (عمدتا حوادث گوارشی) را نشان داد: 751 مورد از 775 نفر (96.9%) در گروههای آکاربوز و 723 مورد از 775 نفر (93.3%) در گروههای دارونما دچار یک عارضه شدند (RR: 1.04؛ 95% CI؛ 1.01 تا 1.06؛ P = 0.0008؛ 2 کارآزمایی؛ 1550 شرکتکننده). آکاربوز در مقایسه با عدم مداخله هیچ مزیت یا ضرری را برای هیچ یک از این معیارهای پیامد (شواهد با قطعیت بسیار پائین) نشان نداد.
یک کارآزمایی وگلیبوز را با دارونما (1780 شرکتکننده) یا رژیم غذایی و ورزش (870 شرکتکننده) مقایسه کرد. وگلیبوز در مقایسه با دارونما بروز T2DM را کاهش داد: 50 نفر از 897 شرکتکننده (5.6%) در گروه وگلیبوز در برابر 106 نفر از 881 شرکتکننده (12%) در گروه دارونما مبتلا به T2DM شدند (RR: 0.46؛ 95% CI؛ 0.34 تا 0.64؛ P < 0.0001؛ 1 کارآزمایی؛ 1778 شرکتکننده؛ شواهد با قطعیت پائین). برای سایر معیارهای گزارش شده پیامد، هیچ تفاوت واضحی بین گروههای وگلیبوز و مقایسه کننده دیده نشد. یک کارآزمایی با 90 شرکتکننده، آکاربوز را با رژیم غذایی و ورزش مقایسه کرده و یک کارآزمایی دیگر با 98 شرکتکننده، اطلاعات مربوط به مقایسه آکاربوز و متفورمین را گزارش کرد. هیچ تفاوت واضحی برای هر یک از معیارهای پیامد بین این دو مداخله آکاربوز و گروههای مقایسه کننده مرتبط با آن وجود ندارد.
در هیچ یک از کارآزماییها، آمپوتاسیون اندام تحتانی، نابینایی یا کاهش شدید بینایی، بیماری کلیه مرحله نهایی، کیفیت زندگی مرتبط با سلامت، زمان لازم تا پیشرفت به T2DM، یا اثرات اجتماعیاقتصادی گزارش نشد.
نتیجهگیریهای نویسندگان
AGI ممکن است از ابتلا به T2DM در افراد مبتلا به IGT پیشگیری کرده یا آن را به تعویق اندازد. هیچ شواهد محکمی وجود ندارد که نشان دهد AGI تأثیر مفیدی بر مورتالیتی قلبیعروقی یا حوادث قلبیعروقی دارد.
PICO
خلاصه به زبان ساده
نقش مهار کنندههای آلفا‐گلوکوزیداز در پیشگیری یا به تاخیر انداختن بروز دیابت نوع 2 و عوارض مرتبط با آن در افراد در معرض خطر بالای ابتلا به دیابت نوع 2
سوال مطالعه مروری
آیا مهار کنندههای آلفا‐گلوکوزیداز (alpha‐glucosidase) میتوانند بروز دیابت ملیتوس نوع 2 و عوارض مرتبط با آن را در افراد در معرض خطر بالای ابتلا به دیابت ملیتوس نوع 2 به تاخیر اندازند یا از آنها پیشگیری کنند؟
پیشینه
گفته میشود افرادی با افزایش سطح گلوکز به میزان متوسطی در معرض خطر ابتلا به دیابت نوع 2 قرار دارند. بنابراین، مکررا به این افراد توصیه میشود که برای پیشگیری از ابتلا به دیابت نوع 2، میزان ورزش را افزایش و مصرف کالری را کاهش دهند. از مهار کنندههای آلفا‐گلوکوزیداز (آکاربوز (acarbose)، میگلیتول (miglitol)، وگلیبوز (voglibose)) برای کاهش قند خون در افراد مبتلا به دیابت ملیتوس نوع 2 استفاده میشود. در حال حاضر مشخص نیست که مهار کنندههای آلفا‐گلوکوزیداز باید برای افرادی که سطح گلوکز خون آنها به میزان متوسطی افزایش یافته، تجویز شود یا خیر. ما میخواستیم دریابیم که مهار کنندههای آلفا‐گلوکوزیداز میتوانند از ابتلا به دیابت نوع 2 در افرادی که سطح گلوکز نسبتا بالایی دارند، پیشگیری کنند یا آن را به تأخیر اندازند یا خیر. برای یافتن کارآزماییهای تصادفیسازی و کنترل شده (randomised controlled trials; RCTs) (کارآزماییهای بالینی که افراد بهطور تصادفی در یکی از دو یا چند گروه درمانی قرار میگیرند)، با حداقل یک سال دوره مطالعه، که مهار کنندههای آلفا‐گلوکوزیداز را در افراد مبتلا به سطوح بالاتر از حد نرمال گلوکز خون، اما پائینتر از معیار تشخیصی برای دیابت ملیتوس نوع 2 بررسی کردند، به جستوجو در منابع علمی پزشکی پرداختیم.
ویژگیهای کارآزمایی
ما 10 کارآزمایی تصادفیسازی و کنترل شده را با حضور 11,814 شرکتکننده یافتیم، که هشت مطالعه در مورد آکاربوز و دو مطالعه در مورد وگلیبوز بودند. مدت زمان کارآزمایی از یک تا شش ماه متفاوت بود.
این شواهد تا دسامبر 2017 بهروز است.
نتایج کلیدی
هنگام مقایسه آکاربوز با دارونما (placebo) (مادهای که هیچ تأثیری درمانی ندارد)، 670 نفر از 4014 شرکتکننده (17%) که آکاربوز دریافت کردند، و 812 نفر از 3994 شرکتکننده (20%) تحت درمان با دارونما مبتلا به دیابت نوع 2 شدند. بیشتر دادهها برای این مقایسه از یک کارآزمایی شامل افراد مبتلا به بیماری قلبی به دست آمد. هنگام مقایسه آکاربوز با عدم مداخله، هفت نفر از 75 شرکتکننده (9%) که آکاربوز دریافت کردند، و 18 نفر از 65 شرکتکننده (28%) تحت درمان با دارونما مبتلا به دیابت نوع 2 شدند. درمان با آکاربوز خطر مرگومیر ناشی از هر علتی، مرگومیر ناشی از بیماری قلبی، عوارض جانبی جدی، سکته مغزی یا نارسایی قلبی را کاهش یا افزایش نداد. آکاربوز در مقایسه با دارونما خطر حملات قلبی را کاهش داد (یک نفر از 742 شرکتکننده (0.1%) که آکاربوز دریافت کردند، در مقایسه با 15 نفر از 744 شرکتکننده (2%) تحت درمان با دارونما دچار حمله قلبی شدند). درمان با آکاربوز در مقایسه با دارونما افزایش خطر عوارض جانبی غیر‐جدی (عمدتا عوارض گوارشی) را نشان داد: 751 نفر از 775 شرکتکننده (97%) تحت درمان با آکاربوز و 723 نفر از 775 شرکتکننده (93%) دریافت کننده دارونما دچار یک عارضه جانبی غیر‐جدی شدند.
در یک کارآزمایی وگلیبوز با دارونما و در یک کارآزمایی دیگر ووگیبوز با رژیم غذایی و ورزش مقایسه شد. هنگام مقایسه وگلیبوز با دارونما، 50 نفر از 897 شرکتکننده (5.6%) که وگلیبوز دریافت کردند، و 106 نفر از 881 شرکتکننده (12%) تحت درمان با دارونما مبتلا به دیابت نوع 2 شدند.
یک کارآزمایی با 90 شرکتکننده، آکاربوز را با رژیم غذایی و ورزش، و کارآزمایی دیگر با 98 شرکتکننده، آکاربوز را با متفورمین مقایسه کرد. هیچ تفاوت مهمی برای هیچ یک از پیامدها برای این مقایسهها وجود نداشت.
در هیچ یک از کارآزماییها، آمپوتاسیون اندام تحتانی، نابینایی یا از دست دادن شدید بینایی، بیماری کلیوی، کیفیت زندگی مرتبط با سلامت، زمان لازم تا پیشرفت به سوی دیابت نوع 2، یا اثرات اجتماعیاقتصادی (از قبیل غیبت از کار یا هزینهها) گزارش نشد.
کیفیت شواهد
برای اکثر پیامدها، ما نامطمئن یا بسیار نامطمئن هستیم که نتایج مقایسههای ما تا چه اندازه معتبر هستند. دلایل این عدم قطعیت، خطاهای سیستماتیک در برخی از کارآزماییهای وارد شده، تعداد کلی اندک کارآزماییها برای یک پیامد خاص، نتایج غیر‐دقیق و دادههای ازدسترفته یک کارآزمایی وارد شده است.
Authors' conclusions
Summary of findings
| Acarbose for prevention or delay of type 2 diabetes mellitus and its associated complications in people at risk of developing of type 2 diabetes mellitus | ||||||
| Population: people at risk of developing type 2 diabetes mellitus Settings: outpatients Intervention: alpha‐glucosidase inhibitors (acarbose) Comparison: placebo | ||||||
| Outcomes | Placebo | Acarbose | Relative effect | Number of participants Trials | Certainty of the evidence | Comments |
| All‐cause mortality Follow‐up: 3‐5 years | 56 per 1000 | 55 per 1000 (44 to 66) | RR 0.98 (0.82 to 1.18) | 8069 3 RCTs | ⊕⊝⊝⊝ | ‐ |
| Incidence of T2DM Follow‐up: 3‐5 years Definition of intermediate hyperglycaemia (definition of T2DM incidence): ACE 2017: FPG < 7.0 mmol/L; 2hPG ≥ 7.8 ‐ < 11.1 mmol/L (FPG ≥7.0 mmol/L; 2hPG ≥ 11.1 mmol/L) | 203 per 1000 | 167 per 1000 (152 to 181) | RR 0.82 (0.75 to 0.89) (95% prediction interval: 0.48 to 1.40) | 8008 3 RCTs | ⊕⊕⊕⊝ | ACE 2017 included participants with coronary heart disease and contributed 64.0% of cases |
| Serious adverse events Follow‐up: 3.3‐5 years | 95 per 1000 | 106 per 1000 (92 to 122) | RR 1.12 (0.97 to 1.29) | 6625 2 RCTs | ⊕⊕⊝⊝ | ‐ |
| Cardiovascular mortality Follow‐up: 3.3‐5 years | 42 per 1000 | 37 per 1000 (29 to 46) | RR 0.88 (0.71 to 1.10) | 8069 3 RCTs | ⊕⊝⊝⊝ | ‐ |
| (a)Non‐fatal myocardial infarction (b)Non‐fatal stroke (c)Congestive heart failure Follow‐up: 3.3 years | (a) 20 per 1000 (b) 6 per 1000 (c) 19 per 1000 | (a) 1 per 1000 (0 to 11) (b) 3 per 1000 (1 to 16) (c) 16 per 1000 (12 to 21) | (a) RR 0.10 (0.02 to 0.53) (b) RR 0.50 (0.09 to 2.74) (c) RR 0.87 (0.63 to 1.12) | (a) 1486 2 RCTs (b) 1368 1 RCT (c) 7890 2 RCTs | (a) ⊕⊝⊝⊝ Very lowd (c) ⊕⊕⊝⊝ | ‐ |
| Health‐related quality of life | Not reported | |||||
| Socioeconomic effects | Not reported | |||||
| *The basis for the assumed risk (e.g. the median control group risk across trials) is provided in footnotes. The corresponding risk (and its 95% confidence interval) is based on the assumed risk in the comparison group and the relative effect of the intervention (and its 95% CI). 2hPG: 2‐hour plasma glucose; CI: confidence interval; FPG: fasting plasma glucose;HbA1c: glycosylated haemoglobin A1c; IGT: impaired glucose tolerance; RCT: randomised controlled trial; RR: risk ratio; T2DM: type 2 diabetes mellitus | ||||||
| GRADE Working Group grades of evidence | ||||||
| aDowngraded by one level because of inconsistency in direction of effect and by two levels because of serious imprecision (confidence interval consistent with benefit and harm and small number of trials). See Appendix 17. | ||||||
| Acarbose for prevention or delay of type 2 diabetes mellitus and its associated complications in people at risk of developing type 2 diabetes mellitus | ||||||
| Population: people at risk of developing type 2 diabetes mellitus Settings: outpatients Intervention: alpha‐glucosidase inhibitors (acarbose) Comparison: no intervention | ||||||
| Outcomes | No intervention | Acarbose | Relative effect | Number of participants Trials | Certainty of the evidence | Comments |
| All‐cause mortality Follow‐up: 1‐5 years | See comment | 171 2 RCTs | ⊕⊝⊝⊝ | 2 of 4 trials reported mortality. No deaths occurred. | ||
| Incidence of T2DM Follow‐up: 1‐5 years Definition of intermediate hyperglycaemia (definition of T2DM incidence): Fang 2004 and Wang 2000: FPG < 7.8 mmol/L; 2hPG ≥ 7.8 ≤ 11.1 mmol/L (FPG ≥ 7.8 mmol/L; 2hPG ≥ 11.1 mmol/L) | 277 per 1000 | 86 per 1000 (39 to 191) | RR 0.31 (0.14 to 0.69) | 140 2 RCTs | ⊕⊝⊝⊝ | ‐ |
| Serious adverse events | Not reported | |||||
| Cardiovascular mortality Follow‐up: 1‐4.5 years | 49 per 1000 | 31 per 1000 (8 to 124) | RR 0.64 (0.16 to 2.56) | 205 2 RCTs | ⊕⊝⊝⊝ | ‐ |
| (a)Non‐fatal myocardial infarction (b)Non‐fatal stroke (c)Congestive heart failure Follow‐up: 1‐4.5 years | (a) 68 per 1000 (b) 39 per 1000 (c) 58 per 1000 | (a) 20 per 1000 (5 to 96) (b) 21 per 1000 (4 to 109) (c) 51per 1000 (16 to 159) | (a) RR 0.30 (0.07 to 1.41) (b) RR 0.53 (0.10 to 2.81) (c) RR 0.87 (0.27 to 2.73) | (a) 205 2 RCTs (b) 205 2 RCTs (c) 205 2 RCTs | (a) ⊕⊝⊝⊝ Very lowc (c) ⊕⊝⊝⊝ | ‐ |
| Health‐related quality of life | Not reported | |||||
| Socioeconomic effects | Not reported | |||||
| *The basis for the assumed risk (e.g. the median control group risk across trials) is provided in footnotes. The corresponding risk (and its 95% confidence interval) is based on the assumed risk in the comparison group and the relative effect of the intervention (and its 95% CI). | ||||||
| GRADE Working Group grades of evidence | ||||||
| aDowngraded by one level because of risk of bias (unclear selection bias and selective reporting), and by two levels because of serious imprecision (small number of trials, small sample size and the outcome not being a common event). See Appendix 18. | ||||||
Background
Description of the condition
'Prediabetes' or 'intermediate hyperglycaemia' are terms that are used to indicate a blood glucose level below the cut‐off value for diabetes, but higher than is considered normal. It is considered to be a risk factor for the development of type 2 diabetes mellitus (T2DM), with a higher predictive value than other known risk factors, such as obesity or a family history of T2DM (Colditz 1995; Meigs 2000; Nguyen 2011; InterAct Consortium 2013; Tabak 2012).
Intermediate hyperglycaemia is often characterised by various measurements of elevated blood glucose concentrations, such as isolated impaired fasting glucose (IFG), isolated impaired glucose tolerance (IGT), isolated elevated glycosylated haemoglobin A1c (HbA1c), or combinations thereof (WHO/IDF 2006). IGT is defined by the World Health Organisation (WHO), and the American Diabetes Association (ADA), as plasma glucose concentrations between 7.8 to 11.1 mmol/L (140 to 200 mg/dL), two hours after ingestion of 75 g of glucose. Trials indicate that IGT is caused by insulin resistance and defective insulin secretion (Abdul‐Ghani 2006; Jensen 2002). The WHO defines IFG as fasting plasma glucose concentrations between 6.1 to 6.9 mmol/L (110 to 125 mg/dL). The ADA definition has a lower threshold for defining IFG, namely 5.6 mmol/L (100 mg/dL; ADA 2003). IFG seems to be associated with β‐cell dysfunction (impaired insulin secretion), and an increase in the hepatic glucose output (DeFronzo 1989). More recently, HbA1c has been introduced to identify people at high risk of developing T2DM. People with HbA1c measurements between 6.0% and 6.4% (42 and 46 mmol/mol) fulfilled this criterion (IEC 2009). Shortly afterwards, the ADA re‐defined this HbA1c range as 5.7% to 6.4% (39 and 46 mmol/mol; ADA 2010), a decision not endorsed by the WHO, the International Expert Committee (IEC) or other organisations.
Trials have shown poor correlations between HbA1c and IFG/IGT (Gosmanov 2014; Selvin 2011). Notably, the various glycaemic tests do not seem to identify the same people, as there is an imperfect overlap among the glycaemic modalities available to define intermediate hyperglycaemia (Gosmanov 2014; Selvin 2011). The risk of progression from people at risk of T2DM depends on the diagnostic criteria used to identify the risk. Some people with intermediate hyperglycaemia will never develop T2DM and some people will return to normoglycaemia. IGT is often accepted as the best glycaemic variable to predict progression to T2DM. Trials indicate that fewer than half of the people defined as 'prediabetic' by means of IGT or IFG will develop T2DM in the following 10 years (Morris 2013). Of the people with both IGT and IFG, around 70% is estimated to develop T2DM (Morris 2013). Most importantly, intermediate hyperglycaemia is commonly an asymptomatic condition and consequently often remains 'undiagnosed' (CDC 2015).
In 2017, the International Diabetes Federation (IDF) estimated the prevalence of IGT to be 352 million people and this is predicted to increase to more than half a billion people by 2045. The current prevalence of T2DM is estimated to be 425 million people (IDF 2017). Thus, there is a need to address this growing number of (potential) patients. However, it has not been clarified whether or not any particular intervention, especially glucose‐lowering drugs, should be recommended for people with IGT (Yudkin 2014). Trials have indicated that the progression to T2DM is reduced, or possibly only delayed, with behavioural interventions, such as increased physical activity, dietary changes or both (Diabetes Prevention Program 2002; Diabetes Prevention Program FU 2009; Finnish Diabetes Prevention Study Group 2001). However, the effect on longer‐term development of diabetes is not clear (Dunkley 2014).
Current clinical practice recommends a healthy lifestyle such as regular physical activity, not smoking, and balanced food choices, to prevent the development of T2DM (ADA 2014). International diabetes associations and clinicians do not generally accept the prescription of pharmacological glucose‐lowering interventions for the prevention of T2DM. Several groups of pharmacological glucose‐lowering interventions have been investigated for people at risk of T2DM. Some findings indicate that the progression to T2DM is reduced or may only be delayed when using these pharmacological interventions (Diabetes Prevention Program 2002; Diabetes Prevention Program FU 2009). However, the ADA recommends metformin for people at risk of T2DM, especially for those with body mass index over 35 kg/m², aged less than 60 years, and women with prior gestational diabetes mellitus (ADA 2015).
Description of the intervention
Alpha‐glucosidase inhibitors (AGI) are reversible inhibitors of alpha‐glucosidase, an enzyme present in the brush border of the small intestine. Currently, three AGI exist: acarbose, miglitol and voglibose. AGI delay absorption of complex carbohydrates and thus inhibit postprandial glucose peaks and consequently lower postprandial insulin levels. In the treatment of T2DM AGI have been proven to lower blood glucose and post‐load insulin levels but there is no evidence for a reduction of mortality or morbidity (Van de Laar 2005).
Potential adverse effects are of special importance in the use of medications in people with intermediate hyperglycaemia, who are asymptomatic, and would not therefore, in contrast to potential adverse effects, notice any direct benefits from the medication. In addition, because of the chronic and long‐lasting character of intermediate hyperglycaemia, medication will have to be used for a long period of time. Therefore, long‐term safety is very important.
Adverse effects of the intervention
AGI cause unfavourable dose‐dependent adverse effects, mostly flatulence and other gastro‐intestinal adverse effects. There is no evidence for long‐term detrimental effects of AGI (Caballero 2016; Van de Laar 2005).
How the intervention might work
In people with insulin resistance, post‐prandial blood glucose is not properly stored in the muscle, adipose, and liver cells, and hepatic glucose production is not inhibited (Stumvoll 2005). This leads to a post‐prandial glucose spike. In the long term, hyperglycaemia increases the risk of microvascular and cardiovascular morbidity (Laakso 1999). AGI prevent hyperglycaemia and thus hyperinsulinaemia, and therefore might decrease the risk of microvascular and cardiovascular morbidities (Turnbull 2009).
The mechanism by which the intervention might prevent T2DM is less clear. As mentioned, AGI lower blood glucose. Consequently, if a person has lower blood glucose due to the medication and therefore does not have T2DM diagnosed, that does not necessarily mean that the underlying cause of T2DM has been treated.
Trials on whether AGI improve insulin sensitivity are contradictory. Multiple trials that compared an AGI to a placebo in people with (early) T2DM found little to no improvement of insulin sensitivity (Jenney 1993; Johnson 1996; Kirkman 2006; Matsumoto 1998). However, other trials found that AGI improved insulin sensitivity (Chiasson 1996; Meneilly 2000; Shinozaki 1996).
Why it is important to do this review
A recent systematic review with network meta‐analysis looked at various interventions (behaviour changing, pharmacological and surgical), and their effects in reducing progression to T2DM in people with intermediate hyperglycaemia (Stevens 2015). The most effective interventions according to this review were glipizide (hazard ratio (HR) 0.16, 95% credible interval 0.02 to 1.62), and diet plus pioglitazone (HR 0.17, 95% credible interval 0.09 to 0.33). They also included three trials with AGI as an intervention (Kawamori 2009; Pan 2003; STOP‐NIDDM 2002). Their meta‐analysis led to a HR of 0.74 (95% confidence interval (CI) 0.57 to 0.93), for acarbose compared to placebo and a HR of 0.39 (95% CI 0.26 to 0.57), for voglibose compared to placebo, suggesting that AGI reduced or delayed the development of T2DM. A more recent Cochrane review looked at the effect of diet, physical activity, or both on delaying or preventing T2DM and its complications. They found that the combination of diet and physical activity reduced the incidence of T2DM in people with IGT compared to standard or no intervention (RR 0.57, 95% CI 0.50 to 0.64) (Hemmingsen 2017a). Other Cochrane Reviews did not find firm evidence that DPP‐4 inhibitors, GLP‐1 analogues, insulin secretagogues, or SGLT 2 inhibitors delayed or prevented T2DM in people at risk of T2DM (Hemmingsen 2016a; Hemmingsen 2016b; Hemmingsen 2017b).
However, besides the original version of this review (New Reference), there has been no systematic review looking solely at whether AGI are effective (in the long‐term), in preventing not only T2DM, but also cardiovascular morbidity and mortality. One review looked at the effect of both pharmacological and behaviour‐changing interventions on the prevention of cardiovascular events in people with intermediate hyperglycaemia, and one of the included trials used acarbose as the intervention (STOP‐NIDDM 2002). This review concluded that both pharmacological and behaviour‐changing interventions prevented or delayed T2DM, but neither prevented nor delayed all‐cause and cardiovascular mortality or myocardial infarctions (Hopper 2011).
Intermediate hyperglycaemia is a risk factor for T2DM and is asymptomatic. However, AGI are accompanied by adverse effects. Therefore, treating intermediate hyperglycaemia with AGI can only be justified by strong proof that this treatment does in fact prevent or delay T2DM or its subsequent cardiovascular morbidity and mortality.
Objectives
To assess the effects of AGI in people with impaired glucose tolerance (IGT), impaired fasting blood glucose (IFG), moderately elevated glycosylated haemoglobin A1c (HbA1c) or any combination of these.
Methods
Criteria for considering studies for this review
Types of studies
We included randomised controlled trials with a minimum duration of one year. Because the common adverse effects of AGI make true blinding difficult, we included both blinded and non‐blinded trials. We investigated trials published in any language, and all identified trials, published or unpublished.
Types of participants
We included non‐diabetic individuals with increased risk of T2DM. We defined increased risk as having the condition of intermediate hyperglycaemia.
Diagnostic criteria for people at risk of T2DM development
To be consistent with changes to the classification of, and diagnostic criteria for intermediate hyperglycaemia (IFG, IGT, and elevated HbA1c), over the years, the diagnosis should have been established using the standard criteria valid at the trial start (e.g. ADA 2010; WHO 1985). Ideally, the diagnostic criteria should have been described. If necessary, we used the trial authors' definition of risk but we contacted trial authors for additional information. Differences in the glycaemic measurements used to define risk may introduce substantial heterogeneity. Therefore we planned to subject the diagnostic criteria to a subgroup analysis.
Types of interventions
We investigated the following comparisons of AGI versus all other pharmacological glucose‐lowering interventions, behaviour‐changing interventions, placebo or no intervention (usual care).
-
AGI as monotherapy compared with any pharmacological glucose‐lowering intervention (e.g. metformin, sulphonylurea), behaviour‐changing interventions (e.g. diet, exercise, diet and exercise), placebo or no intervention
-
AGI as a part of a combination therapy compared with any pharmacological glucose‐lowering agent if this glucose‐lowering agent was the same in both the intervention and comparator groups (e.g. acarbose + metformin versus metformin)
Other concomitant interventions (e.g. educational programmes or additional pharmacotherapy), had to be the same in both the intervention and comparator groups to establish fair comparisons.
Minimum duration of intervention
We included trials with a duration of the intervention of one year or more.
Exclusion criteria
-
We excluded trials of people diagnosed with 'metabolic syndrome' because this is a special population that is not representative of people with just intermediate hyperglycaemia. Also, the composite of risk indicators such as elevated blood lipids, insulin resistance, obesity, and high blood pressure, which is termed 'metabolic syndrome' is of doubtful clinical usefulness and uncertain distinct disease entity. However, in case we identified trials investigating participants with any definition of metabolic syndrome, we would have summarised some basic trial information in an additional table.
-
We excluded trials evaluating participants with raised blood glucose levels because of other medical conditions or interventions, for example, polycystic ovary syndrome or use of glucocorticoids.
We aimed to include trials explicitly describing that a portion of the included participants had intermediate hyperglycaemia. We contacted the trial investigators in order to obtain separate data on the group with intermediate hyperglycaemia and planned to include these in the meta‐analyses.
We planned to include trials in obese people and participants with previous gestational diabetes, if trial investigators described that the participants had intermediate hyperglycaemia.
We planned to initially include a trial even if it did not report one or more of our primary or secondary outcome measures in the publication. If a trial did not report any of our primary or secondary outcomes, we would have included this trial and contacted the corresponding trial author for supplementary data. If no additional data were available, we planned to present this trial in a supplementary table.
Types of outcome measures
Primary outcomes
-
All‐cause mortality
-
Incidence of T2DM
-
Serious adverse events
Secondary outcomes
-
Cardiovascular mortality
-
Non‐fatal myocardial infarction
-
Non‐fatal stroke
-
Congestive heart failure
-
Amputation of lower extremity
-
Blindness or severe vision loss
-
End‐stage renal disease
-
Non‐serious adverse events
-
Hypoglycaemia
-
Health‐related quality of life
-
Time to progression to T2DM
-
Measures of blood glucose control
-
Socioeconomic effects
-
Total cholesterol, high‐density lipoprotein (HDL) cholesterol, low‐density lipoprotein (LDL) cholesterol, triglycerides, body mass index (BMI), body weight, and blood pressure
Method of outcome measurement
-
All‐cause mortality: defined as death from any cause
-
Incidence of T2DM and time to progression to T2DM: defined according to diagnostic criteria valid at the time the diagnosis was established, using the standard criteria valid at the time of the trial commencing (e.g. ADA 2010; WHO 1998). If necessary, we used the trial authors' definition of T2DM.
-
Serious adverse events: defined according to the International Conference on Harmonization Guidelines as any event that leads to death, that is life‐threatening, required inpatient hospitalisation or prolongation of existing hospitalisation, resulted in persistent or significant disability, or any important medical event that may have had jeopardised the patient or required intervention to prevent it (ICH 1997), or as reported in trials.
-
Cardiovascular mortality, non‐fatal myocardial infarction, congestive heart failure, non‐fatal stroke, amputation of lower extremity, blindness or severe vision loss, hypoglycaemia (mild, moderate, severe/serious): defined as reported in trials
-
End‐stage renal disease: defined as dialysis, renal transplantation, or death due to renal disease
-
Non‐serious adverse events: defined as the number of participants with any untoward medical occurrence not necessarily having a causal relationship with the intervention
-
Health‐related quality of life: defined as mental and physical health‐related quality of life as separate domains and combined, evaluated by a validated instrument such as Short‐Form 36
-
Measures of blood glucose control: fasting blood glucose, blood glucose two hours after ingestion of 75 g glucose, and HbA1c measurements
-
Socioeconomic effects: for example, costs of the intervention, absence from work, medication consumption
-
Total cholesterol, HDL‐cholesterol, LDL‐cholesterol, triglycerides, BMI, body weight in kg, and blood pressure (systolic and diastolic blood pressure)
Timing of outcome measurement
Trials measured the following outcomes at any time during the intervention and during follow‐up: all‐cause mortality, serious adverse events and non‐serious adverse events.
Trials measured the following outcomes at the end of the intervention and at the end of follow‐up: incidence of T2DM, cardiovascular mortality, non‐fatal myocardial infarction, congestive heart failure, non‐fatal stroke, amputation of lower extremity, blindness or severe vision loss, hypoglycaemia, end‐stage renal disease, health‐related quality of life, measures of blood glucose control, socioeconomic effects, total cholesterol, HDL‐cholesterol, LDL‐cholesterol, triglycerides, BMI, body weight, and blood pressure.
Specification of key prognostic variables
-
Age
-
Gender
-
Equity issues (access to health care, social determinants)
-
Ethnicity
-
Hypertension
-
Cardiovascular disease
-
Obesity
-
Previous gestational diabetes
Search methods for identification of studies
Electronic searches
For this update, the search strategies were revised and tested against the included studies identified in the previous version of this review. Due to substantial revision of the search strategies the search was run again from inception of each database to 7 December 2017. We placed no restrictions on the language of publication.
-
Cochrane Central Register of Controlled Trials (CENTRAL; 2017, Issue 12), via Cochrane Register of Studies Online
-
Ovid MEDLINE(R) In‐Process & Other Non‐Indexed Citations; and Ovid MEDLINE(R) <1946 to Present>
-
Embase <1974 to 6 December 2017>
-
World Health Organization (WHO) International Clinical Trials Registry Platform (ICTRP) Search Portal (apps.who.int/trialsearch/)
For detailed search strategies, see Appendix 1. We continuously applied an email alert service for MEDLINE via OvidSP to identify newly published trials using the search strategy detailed in Appendix 1. We obtained evaluations of all relevant non‐English articles.
Searching other resources
For the original version of this review (Van de Laar 2006), we tried to identify other potentially eligible trials or ancillary publications by searching the reference lists of retrieved included trials, systematic reviews and meta‐analyses. In addition we contacted authors of included trials and other experts to identify any additional information on the retrieved trials and if further trials existed that we might have missed. Similarly, we contacted manufacturers and patent holders (Bayer AG, Sanofi‐Synthelabo, Pfizer, Takeda), in order to retrieve information on published and unpublished AGI trials.
For the updated review, we tried to identify other potentially eligible trials or ancillary publications by searching the reference lists of relevant systematic reviews and meta‐analyses.
Data collection and analysis
Selection of studies
Two review authors (SM and FL), independently scanned the abstract, title, or both of every record we retrieved in the literature searches to determine which trials should be assessed further. We investigated the full text of all potentially relevant articles. We resolved discrepancies through consensus or by recourse to a third review author (WG). We prepared a flow diagram of the number of trials identified and excluded at each stage in accordance with the PRISMA flow diagram of trial selection (Liberati 2009).
Data extraction and management
For trials that fulfilled the inclusion criteria, two review authors (SM and FL), independently extracted outcome data and assessed the risk of bias. One review author (SM), extracted key characteristics of participants and interventions and another (FL), checked them. We reported data on efficacy outcomes and adverse events using standard data extraction sheets from Cochrane Metabolic and Endocrine Disorders (CMED). We resolved any disagreements by discussion or, if required, by consultation with a third review author (WG). For details see Characteristics of included studies; Table 1; Appendix 2; Appendix 3; Appendix 4; Appendix 5; Appendix 6; Appendix 7; Appendix 8; Appendix 9; Appendix 10; Appendix 11; Appendix 12; Appendix 13; Appendix 14; Appendix 15; Appendix 16; Appendix 17; Appendix 18; Appendix 19).
| Trial ID | Intervention(s) and comparator(s) | Short description of power and sample size calculation | Screened/eligible | Randomised | ITT | Analysed | Finishing trial | Randomised finishing trial | Follow‐up |
| ABC 2017 (parallel RCT) | Intervention 1: voglibose | "Given a hazard ratio (HR) of 0.717 with survival rates of 89% at 24 months in the control group, we estimated the total sample size of 3000 subjects along with 325 events (1500 per group), providing 85% power of one‐sided log‐rank test of 2.5% significance level to detect the assumed reduction, assuming the loss of patients during the follow‐up to be 15%" | ‐/870 | 428 | 424 | 424 | 424 | 99.1 | 2 years |
| Comparator 1: diet and exercise | 442 | 435 | 435 | 435 | 98.4 | ||||
| total: | 870 | 859 | 859 | 859 | 98.7 | ||||
| ACE 2017(parallel RCT) | Intervention 1: acarbose | "7268 patients were required with 904 adjudicated primary composite cardiovascular end points to achieve 90% power. The population size was reduced from 7500 to 6500, with an estimated 728 confirmed composite primary outcome required to have at least 85% power to detect a 20% risk reduction for acarbose, compared with placebo (two‐sided α=0·05)" | 15204/7671 | 3272 | 3272 | 3272 | 3092 | 94.5 | Median of 5 years |
| Comparator 1: placebo | 3250 | 3250 | 3250 | 3064 | 94.3 | ||||
| total: | 6522 | 6522 | 6522 | 6156 | 94.3 | ||||
| Yun 2016(parallel RCT) | Intervention 1: acarbose | ‐ | 426/135 | 67 | ‐ | 60 | 60 | 89.55 | 1‐4.5 years |
| Comparator 1: no intervention | 68 | ‐ | 64 | 64 | 94.12 | ||||
| total: | 135 | ‐ | 124 | 124 | 91.85 | ||||
| Koyasu 2010(parallel RCT) | Intervention 1: acarbose | ‐ | ‐/90 | 45 | ‐ | 42 | 42 | 93.33 | 1 year |
| Comparator 1: no intervention | 45 | ‐ | 39 | 39 | 86.67 | ||||
| total: | 90 | ‐ | 81 | 81 | 90 | ||||
| Kawamori 2009(parallel RCT) | Intervention 1: voglibose | "Assuming a conversion rate of 7.7% per year, a study duration of 4.9 years, and a drop‐out rate of 5%, the planned sample size was 864 (90% power to detect a 40% reduction in the primary endpoint with a two‐sided type I error of 0·05). Due to greater improvement to normoglycaemia than expected, sample size increased to 1728" | 4582/1780 | 897 | ‐ | 897 | 768 | 85.62 | Until diagnosis of normoglycaemia or diabetes type 2, or at least 3 years |
| Comparator 1: placebo | 883 | ‐ | 881 | 737 | 83.47 | ||||
| total: | 1780 | ‐ | 1778 | 1505 | 84.55 | ||||
| Fang 2004(parallel RCT) | Intervention 1: acarbose | ‐ | ‐/‐ | 50 | ‐ | 45 | 45 | 90 | 5 years |
| Comparator 1: no intervention | 40 | ‐ | 35 | 35 | 87.5 | ||||
| Comparator 2: metformin | 48 | ‐ | 44 | 44 | 91.67 | ||||
| Comparator 3: diet and exercise | 40 | ‐ | 36 | 36 | 90 | ||||
| total: | 178 | ‐ | 160 | 160 | 89.89 | ||||
| Wang 2000(parallel RCT) | Intervention 1: acarbose | ‐ | ‐/61 | 31 | ‐ | 30 | 30 | 96.77 | 1 year |
| Comparator 1: No intervention | 30 | ‐ | 30 | 30 | 100 | ||||
| total: | 61 | ‐ | 60 | 60 | 98.36 | ||||
| DAISI 2008(parallel RCT) | Intervention 1: acarbose | 47 participants in each treatment group with alpha (2‐sided) = 0.05 and beta = 0.05 | 6651/118 | 60 | 60 | 60 | 30 | 50 | 3 years |
| Comparator 1: placebo | p8 | 58 | 58 | 36 | 62.07 | ||||
| total: | 118 | 118 | 118 | 66 | 55.93 | ||||
| EDIT 1997(factorial RCT) | Intervention 1: acarbose + placebo | ‐ | ‐/631 | 157 | ‐ | ‐ | ‐ | ‐ | 6 years |
| Comparator 1: placebo + placebo | 159 | ‐ | ‐ | ‐ | ‐ | ||||
| Comparator 2: metformin + placebo | 160 | ‐ | ‐ | ‐ | ‐ | ||||
| Comparator 3: metformin + acarbose | 155 | ‐ | ‐ | ‐ | ‐ | ||||
| total: | 631 | ‐ | ‐ | 522 | 82.73 | ||||
| STOP‐NIDDM 2002(parallel RCT) | Intervention 1: acarbose | "It was estimated that 600 patients would be required in each treatment group for a 2‐tailed alpha of .05 and a 1‐beta of 90% assuming a conversion rate of 7% per year, a 36% risk reduction, and a drop‐out rate of 10%" | 14742/1429 | 714 | 682 | 682 | 471 | 65.97 | mean 3.3 years |
| Comparator 1: placebo | 715 | 686 | 686 | 556 | 77.76 | ||||
| total: | 1429 | 1368 | 1368 | 1027 | 71.87 | ||||
| Grand total | All interventions | 5721 | 4962 (excl. EDIT 1997) | ||||||
| All comparators | 6093 | 5076 (excl. EDIT 1997) | |||||||
| All interventions and comparators | 11,814 | 10,038 (excl. EDIT 1997) 10,560 (incl. EDIT 1997) | |||||||
‐ denotes not reported; ITT: intention‐to‐treat; RCT: randomised controlled trial
aFollow‐up under randomised conditions until end of trial ( (= duration of intervention + follow‐up post‐intervention or identical to duration of intervention); extended follow‐up refers to follow‐up of participants once the original trial was terminated as specified in the power calculation.
We planned to provide information about potentially relevant ongoing trials, including trial identifier, in the Characteristics of ongoing studies table. For each included trial we tried to retrieve the protocol. If not available from the search of the databases, reference screening or internet searches, we asked trial authors to provide a copy of the protocol. We entered predefined outcomes in a 'Matrix of trial endpoint (publications and trial documents)' (see Appendix 8).
We emailed all authors of the included trials to enquire whether they were willing to answer questions regarding their trials. We presented the results of this survey in 'Survey of trial investigators providing information on included trials' (see Appendix 16). We sought relevant missing information on the trial from the primary author(s) of the articles, if possible.
Dealing with duplicate and companion publications
In the event of duplicate publications, companion documents, or multiple reports of a primary trial, we maximised the information yield by collating all available data and used the most complete data set aggregated across all known publications. We listed duplicate publications, companion documents, or multiple reports of a primary trial as secondary references under the primary reference of the included, ongoing, or excluded trial.
Data from clinical trials registers
If data of included trials were available as trial results in clinical trials registers such as ClinicalTrials.gov or similar sources, we made full use of this information and extracted data. If there was a full publication of the trial, we collated and critically appraised all available data.
Assessment of risk of bias in included studies
Two review authors (SM and FL) independently assessed the risk of bias of each included trial. We resolved any disagreements by consensus, or by consultation with a third review author (WG). If adequate information was not available from the trial publication, trial protocol, or both we contacted trial authors for missing data on 'Risk of bias' items.
We used the Cochrane 'Risk of bias' assessment tool (Higgins 2017), assigning assessments of low, high, or unclear risk of bias (for details see Appendix 2; Appendix 3). We evaluated individual bias items as described in the Cochrane Handbook for Systematic Reviews of Interventions according to the criteria and associated categorisations contained therein (Higgins 2017).
We considered the following to be self‐reported outcomes.
-
Non‐serious adverse events
-
Hypoglycaemia
-
Health‐related quality of life
-
Measures of blood glucose control
-
BMI, body weight
We considered the following outcomes to be investigator‐assessed.
-
All‐cause mortality
-
Incidence of T2DM
-
Serious adverse events
-
Cardiovascular mortality
-
Non‐fatal myocardial infarction
-
Non‐fatal stroke
-
Congestive heart failure
-
Amputation of lower extremity
-
Blindness or severe vision loss
-
End‐stage renal disease
-
Hypoglycaemia
-
Time to progression to T2DM
-
Measures of blood glucose control
-
Socioeconomic effects
-
BMI, body weight
-
Total cholesterol, HDL‐cholesterol, LDL‐ cholesterol, triglycerides
Risk of bias for a trial across outcomes
Some 'Risk of bias' domains, such as selection bias (sequence generation and allocation sequence concealment), affected the risk of bias across all outcome measures in a trial. Otherwise, we did not perform a summary assessment of the risk of bias across all outcomes for a trial. In case of high risk of selection bias, we excluded the trial.
Risk of bias for an outcome within a trial and across domains
We assessed the risk of bias for an outcome measure by including all entries relevant to that outcome, that is, both trial‐level entries and outcome‐specific entries. We defined 'low' risk of bias as low risk of bias for all key domains, 'unclear' risk of bias as unclear risk of bias for one or more key domains, and 'high' risk to denote a high risk of bias for one or more key domains.
Risk of bias for an outcome across trials and across domains
These were our main summary assessments that we incorporated in our judgements about the quality of evidence in the 'Summary of findings' table(s). We defined 'low' risk of bias as most information coming from trials at low risk of bias, 'unclear' risk of bias as most information coming from trials at low or unclear risk of bias, and 'high' risk of bias as a sufficient proportion of information coming from trials at high risk of bias.
Measures of treatment effect
When at least two trials were available for a comparison of a given outcome, we expressed dichotomous data as risk ratio (RR) with 95% confidence intervals (CI). We expressed continuous data reported on the same scale as mean difference (MD) with 95% CIs. For trials addressing the same outcome but using different outcome measure scales, we planned to use standardised mean differences (SMD) with 95% CIs. We planned to calculate time‐to‐event data as hazard ratio (HR) with 95% CIs with the generic inverse variance method.
The scales measuring health‐related quality of life may go in different directions. Values in some scales increase with improved health‐related quality of life, whereas in other scales, values decrease with improved health‐related quality of life. To adjust for the different directions of the scales, we planned to multiply by −1 the scales that report better health‐related quality of life with decreasing values.
Unit of analysis issues
We took into account the level at which randomisation occurred, such as cross‐over trials, cluster‐randomised trials, and multiple observations for the same outcome. If more than one comparison from the same trial was eligible for inclusion in the same meta‐analysis, we would have either combined groups to create a single pair‐wise comparison or appropriately reduced the sample size so that the same participants did not contribute more than once (splitting the 'shared' group into two or more groups). While the latter approach offers some solution to adjusting the precision of the comparison, it does not account for correlation arising from the same set of participants being in multiple comparisons (Deeks 2017).
We planned to re‐analyse cluster‐randomised trials that did not appropriately adjust for potential clustering of participants within clusters in their analyses. We planned to use a design effect (DEFF), to inflate the variance of the intervention effects. Calculation of a DEFF involves estimation of an intra‐cluster correlation (ICC) and the cluster size. We planned to obtain estimates of ICCs through contact with trial authors, or impute ICCs using estimates from other included trials that reported ICCs, or use external estimates from empirical research (e.g. Bell 2013). We planned to examine the impact of clustering using sensitivity analyses.
Dealing with missing data
We tried to obtain missing data from trial authors and we carefully evaluated important numerical data such as screened, randomly‐assigned participants as well as intention‐to‐treat (ITT), and as‐treated and per‐protocol populations. If the publication did not explicitly mention that they used ITT analysis, we looked at the number of participants that they had randomised and the number of participants that they had analysed, and whether these numbers were equal.
We investigated attrition rates (e.g. dropouts, losses to follow‐up, withdrawals), and we critically appraised issues concerning missing data and imputation methods (e.g. last observation carried forward).
We converted standard errors and CIs to standard deviations (SD) (Deeks 2017). When no differences in means and SDs were reported from baseline, we used the end‐of follow‐up values (Deeks 2017). Where means and SDs for outcomes were not reported and we did not receive the information we needed from trial authors, we calculated the SDs from standard errors, if possible. Otherwise we would have imputed the values by assuming the SDs of the missing outcome to be the average of the SDs from the trials that reported this information.
We planned to investigate the impact of imputation on meta‐analyses by performing sensitivity analyses.
Assessment of heterogeneity
In the event of substantial clinical or methodological heterogeneity, we did not report trial results as the pooled effect estimate in a meta‐analysis.
We identified heterogeneity (inconsistency), by visually inspecting the forest plots and by using a standard Chi² test with a significance level of α = 0.1 (Deeks 2017). In view of the low power of this test, we also considered the I² statistic, which quantifies inconsistency across trials to assess the impact of heterogeneity on the meta‐analysis (Higgins 2002; Higgins 2003).
When we found heterogeneity, we attempted to determine the possible reasons for it by examining individual trial and subgroup characteristics.
Assessment of reporting biases
If we included 10 or more trials investigating a particular outcome, we planned to use funnel plots to assess small‐trial effects. Several explanations may account for funnel plot asymmetry, including true heterogeneity of effect with respect to trial size, poor methodological design (and hence bias of small trials), and publication bias. Therefore, we planned to interpret results carefully (Sterne 2011).
Data synthesis
We planned to undertake (or display), a meta‐analysis only if we judged participants, interventions, comparisons, and outcomes to be sufficiently similar to ensure an answer that was clinically meaningful. Unless good evidence showed homogeneous effects across trials of different methodological quality, we primarily summarised low risk of bias data using a random‐effects model (Wood 2008). We interpreted random‐effects meta‐analyses with due consideration to the whole distribution of effects and presented a prediction interval (Borenstein 2017a; Borenstein 2017b; Higgins 2009). A prediction interval needs at least three trials to be calculated and specifies a predicted range for the true treatment effect in an individual trial (Riley 2011). For rare events, such as event rates below 1%, we planned to use the Peto's odds ratio method, provided that there was no substantial imbalance between intervention and comparator group sizes and intervention effects were not exceptionally large. In addition, we performed statistical analyses according to the statistical guidelines presented in the Cochrane Handbook for Systematic Reviews of Interventions (Deeks 2017).
Subgroup analysis and investigation of heterogeneity
We expected the following characteristics to introduce clinical heterogeneity, and planned to carry out the following subgroup analyses with investigation of interactions, as long as the size of the subgroups allowed it.
-
Type of AGI
-
Trials with long duration (two years or longer), versus trials with shorter duration (less than two years)
-
Diagnostic criteria (IFG, IGT, HbA1c)
-
Age, depending on data
-
Gender
-
Ethnicity, depending on data
-
Comorbid conditions, such as hypertension, obesity, or both
-
Participants with previous gestational diabetes mellitus
-
AGI dose (up to the recommended dose for a glucose‐lowering effect in people with T2DM versus higher doses)
Sensitivity analysis
We planned to perform sensitivity analyses to explore the influence of the following factors (when applicable), on effect sizes by restricting analysis to the following.
-
Published trials
-
Taking into account risk of bias, as specified in the Assessment of risk of bias in included studies section
-
Very long or large trials, to establish the extent to which they dominated the results
-
Trials using the following filters: diagnostic criteria, imputation, language of publication, source of funding (industry versus other), or country
GRADE and certainty of the evidence
We presented the overall certainty of the evidence for each outcome specified below, according to the GRADE approach, which takes into account issues related not only to internal validity (risk of bias, inconsistency, imprecision, publication bias), but also to external validity, such as directness of results. Two review authors (SM and FL), independently rated the certainty of evidence for each outcome. We resolved any differences in assessment by discussion or by consulting a third review author (WG).
We included an appendix entitled 'Checklist to aid consistency and reproducibility of GRADE assessments', to help with standardisation of the 'Summary of findings' tables (Meader 2014). Alternatively, we planned to use the GRADEpro Guideline Development Tool (GDT) software, and planned to present evidence profile tables as an appendix (GRADEproGDT 2015). We presented results for the outcomes as described in the Types of outcome measures section. If meta‐analysis was not possible, we presented the results in a narrative format in the 'Summary of findings' table. We justified all decisions to downgrade the certainty of evidence using footnotes, and we made comments to aid the reader's understanding of the Cochrane Review where necessary.
'Summary of findings' table
We presented a summary of the evidence in the 'Summary of findings' tables. These provide key information about the best estimate of the magnitude of the effect, in relative terms and as absolute differences, for each relevant comparison of alternative management strategies, numbers of participants and trials addressing each important outcome and a rating of overall confidence in effect estimates for each outcome. We created the 'Summary of findings' tables based on the methods described in the Cochrane Handbook for Systematic Reviews of Interventions (Schünemann 2017) using Review Manager 5 (RevMan 5) table editor (RevMan 2014). We reported the following outcomes, listed according to priority.
-
All‐cause mortality
-
Incidence of T2DM
-
Serious adverse events
-
Cardiovascular mortality
-
Non‐fatal myocardial infarction/stroke and congestive heart failure
-
Health‐related quality of life
-
Socioeconomic effects
Results
Description of studies
For a detailed description of trials, see the Table 1, Characteristics of included studies, Characteristics of excluded studies, and Characteristics of studies awaiting classification sections.
Results of the search
The search is up to date as of December 2017. The search performed for the update of this review yielded 1237 records after duplicates were removed. We screened the title and abstract of these 1237 records and excluded 1212 on the basis that they were not relevant. After screening the full texts, we included five new trials. The search also included the publication of the 'Dutch acarbose intervention study in persons with impaired glucose tolerance trial' (DAISI 2008). We included this trial in the previous version of the review, even though at the full paper had not been published at the time.
The five new trials (ABC 2017; ACE 2017; Kawamori 2009; Koyasu 2010; Yun 2016), together with the five trials from the previous version of the review (DAISI 2008; EDIT 1997; Fang 2004; STOP‐NIDDM 2002; Wang 2000), resulted in a total of 10 trials that we included in our systematic review. The study flow diagram is presented in Figure 1.

Trial flow diagram
Included studies
A detailed description of the characteristics of included trials is presented elsewhere (see Characteristics of included studies; Table 1; Appendix 4; Appendix 5; Appendix 6; Appendix 7; Appendix 8; Appendix 9; Appendix 10; Appendix 11; Appendix 12; Appendix 13; Appendix 14;Appendix 15. The following is a succinct overview.
We have used an abbreviation of the trial name as the identifier for several included trials, namely the 'Dutch acarbose intervention study in persons with impaired glucose tolerance' (DAISI 2008), the 'Alpha‐glucosidase‐inhibitor blocks cardiac events in people with myocardial infarction and impaired glucose tolerance trial' (ABC 2017), the 'Acarbose cardiovascular evaluation trial' (ACE 2017), the 'Study to prevent non‐insulin‐dependent diabetes mellitus' (STOP‐NIDDM 2002), and the 'Early diabetes intervention trial' (EDIT 1997).
Source of data
Nine trials were (predominantly) published as journal articles (ABC 2017; ACE 2017; DAISI 2008; Fang 2004; Kawamori 2009; Koyasu 2010; STOP‐NIDDM 2002; Wang 2000; Yun 2016). For STOP‐NIDDM 2002, we also considered additional data that we received from the trial authors in reply to specific questions from us, the STOP‐NIDDM website, additional PowerPoint presentations, and debate articles as a result of the main publications. For DAISI 2008, we also used the statistical report. For the ABC 2017 and ACE 2017, we used additional data that we received from the trial authors. One trial was published on a website and as abstracts only (EDIT 1997).
Most trials were two‐arm trials (ABC 2017; ACE 2017; DAISI 2008; Kawamori 2009; Koyasu 2010; STOP‐NIDDM 2002; Wang 2000; Yun 2016). Two trials had multiple trial arms (EDIT 1997; Fang 2004).
Comparisons
Three trials compared the AGI acarbose to placebo (ACE 2017; DAISI 2008; STOP‐NIDDM 2002). A further three trials compared acarbose to no intervention (Koyasu 2010; Wang 2000; Yun 2016). One trial compared acarbose to three other groups, namely placebo, metformin, and acarbose plus metformin (EDIT 1997). Another trial compared acarbose to three control groups, namely no intervention, metformin, and diet plus exercise (Fang 2004). Finally, one trial compared the AGI voglibose to placebo (Kawamori 2009) and one trial compared voglibose to diet and exercise (ABC 2017). We did not find any trials investigating miglitol.
Overview of trial populations
The 10 trials randomised 11,814 participants (Table 1). Of these, 5721 were randomised to an intervention group and 6093 to a comparator group. The percentage of participants that finished the trial in the intervention groups ranged between 50% and 99%. In the comparator groups, this ranged between 62% and 100%. Individual trial sample size ranged from 61 to 6522 participants.
Trial design
One trial had a 2x2 factorial design (EDIT 1997). The participants were first randomised to either acarbose or a matching placebo, and then also randomised to either metformin or a matching placebo. This resulted in four groups: acarbose plus metformin, acarbose plus placebo, metformin plus placebo, and placebo plus placebo. The other nine trials had a parallel design. All 10 trials had a superiority design.
Five trials compared the intervention to placebo (ACE 2017; DAISI 2008; EDIT 1997; Kawamori 2009; STOP‐NIDDM 2002). Two trials compared the intervention to metformin (EDIT 1997; Fang 2004). Another two trials compared the intervention to diet and exercise (ABC 2017; Fang 2004). Four trials compared the intervention to no intervention (Fang 2004; Koyasu 2010; Wang 2000; Yun 2016).
Six trials were multicentre trials, with the number of centres raging from 2 to 176 (ABC 2017; ACE 2017; EDIT 1997; Kawamori 2009; STOP‐NIDDM 2002; Yun 2016).
Five trials were double‐blinded for participants and personnel (ACE 2017; DAISI 2008; EDIT 1997; Kawamori 2009; STOP‐NIDDM 2002). Four trials were not blinded (ABC 2017; Koyasu 2010; Wang 2000; Yun 2016). One trial did not describe the method of blinding (Fang 2004).
Five trials blinded the outcome assessors (ABC 2017; ACE 2017; Koyasu 2010; DAISI 2008; STOP‐NIDDM 2002). It was unclear whether the other trials blinded outcome assessors.
The trials were performed between 1995 and 2016. The duration of the follow‐up ranged from one to six years. In two trials the intervention period was followed by a wash‐out period. This was three months for STOP‐NIDDM 2002 and four weeks for Kawamori 2009. In all other trials the intervention period and follow‐up period were identical.
Four trials had a run‐in period (ACE 2017; DAISI 2008; Kawamori 2009; STOP‐NIDDM 2002). One trial was terminated earlier than planned because the interim analysis already showed the efficacy of the intervention (Kawamori 2009). Another trial was terminated early because the interim futility analysis showed an absence of beneficial treatment effect of voglibose compared to the control (ABC 2017).
Settings
STOP‐NIDDM 2002 and Kawamori 2009, mainly recruited participants through screening of high‐risk people (particularly first‐degree relatives of people with diabetes), and followed them up as outpatients in trial centres.
DAISI 2008 recruited participants from the population register of the city of Hoorn and followed them up as outpatients in the trial centre. Koyasu 2010, recruited participants from patients admitted to the hospital for elective coronary angiography and followed them up as outpatients. Yun 2016 recruited participants from patients who were hospitalised for acute coronary syndrome and followed them up as outpatients. ACE 2017 invited patients at cardiovascular and endocrinology centres with coronary heart disease to attend a screening. In EDIT 1997, the participants were ‘self‐referred’ but the exact setting is unclear. Setting and recruitment for the other three trials are also unclear (ABC 2017; Fang 2004; Wang 2000).
Participants
Four trials were performed in China (ACE 2017; Fang 2004; Wang 2000; Yun 2016), three in Japan (ABC 2017; Kawamori 2009; Koyasu 2010), one in the Netherlands (DAISI 2008), one in the UK (EDIT 1997), and one in multiple countries, namely Canada, Germany, Austria, the Nordic countries, Israel, and Spain (STOP‐NIDDM 2002).
Three trials reported the ethnicity of the participants. In two of these trials, the participants were almost exclusively white (EDIT 1997; STOP‐NIDDM 2002). In the other trial, the participants were almost entirely Han Chinese (ACE 2017). The percentage of female participants ranged from 8% to 52%. The mean age ranged from 47 years to 66 years. At baseline, the mean HbA1c ranged from 5.4% to 7.5%, the mean fasting plasma glucose (FPG) ranged from 5.5 to 6.6 mmol/L, and the mean two‐hour post glucose (2hPG) ranged from 6.3 to 10.7 mmol/L. Lastly, the mean BMI at baseline ranged from 21 to 31 kg/m².
Five trials reported both comorbidities and comedications (ABC 2017; ACE 2017; Koyasu 2010; STOP‐NIDDM 2002; Yun 2016). One trial reported only comorbidities (Kawamori 2009). The most commonly reported comorbidities were hypertension and previous myocardial infarction. The most commonly used medications were beta‐blockers, angiotensin‐converting enzyme (ACE) inhibitors, calcium channel blockers, and statins. In the ABC 2017 trial, considerably more people in the voglibose group used anti‐platelet therapy at baseline than in the control group (96.5% and 92.5%, respectively).
In most trials, IGT was newly diagnosed (ACE 2017; Kawamori 2009; Koyasu 2010; STOP‐NIDDM 2002; Wang 2000; Yun 2016). In three trials, this was not clearly stated (ABC 2017; EDIT 1997; Fang 2004).
The most common exclusion criterion was liver and/or kidney impairment (ABC 2017; ACE 2017; DAISI 2008; Koyasu 2010; STOP‐NIDDM 2002; Yun 2016). Four trials excluded people with gastrointestinal problems (ACE 2017; DAISI 2008; Koyasu 2010; Yun 2016). Three trials excluded people with a history of diabetes (ACE 2017; Koyasu 2010; Yun 2016). Furthermore, three trials excluded women who were pregnant or planned to become pregnant, and people with an intolerance or sensitivity to AGI (ACE 2017; DAISI 2008; Koyasu 2010). Finally, five trials excluded participants with a recent cardiovascular event (ABC 2017; ACE 2017; DAISI 2008; Koyasu 2010; STOP‐NIDDM 2002). There were also four trials that specifically included participants with a history of cardiovascular disease (CVD; ABC 2017; ACE 2017; Yun 2016; Koyasu 2010). This includes a history of myocardial infarction (ABC 2017), acute coronary syndrome, myocardial infarction, or (un)stable angina pectoris (ACE 2017), coronary artery disease or stable angina pectoris (Koyasu 2010), and acute coronary syndrome (Yun 2016). Three of these trials also excluded participants with a recent cardiovascular event (ABC 2017; ACE 2017; Koyasu 2010), as these trials wanted to include participants with a history of CVD, but who had not had an event recently. Because certain trials excluded participants with a history of CVD and other trials specifically included participants with a history of CVD, there is a different baseline risk for CVD between these trials.
EDIT 1997 intended to include people ‘at risk of developing diabetes’ with a FPG of 5.5 to 7.7 mmol/L. Based on the HbA1c and 2hPG baseline values, 36.9% of the participants had normal glucose tolerance, 8.1% had IFG, 25.5% had IGT, 14% had both IFG and IGT, and 15.5% had T2DM.
Diagnostic criteria
Four trials used the WHO 1985 criteria (WHO 1985), for IGT (a FPG of < 7.8 mmol/L and a 2hPG of 7.8 to 11.1 mmol/L; DAISI 2008; Fang 2004; STOP‐NIDDM 2002; Wang 2000). However, DAISI 2008 increased the lower limit of the 2hPG measurement to 8.6 mmol/L, because of the higher incidence of conversion to diabetes. And STOP‐NIDDM 2002 added a lower limit to the criteria of FPG, namely 5.6 mmol/L.
In 1998, the WHO changed the criteria for IGT to a FPG of less than 7.0 mmol/L and a 2hPG of 7.8 to 11.1 mmol/L (WHO 1998). Five trials included participants with IGT according to these criteria (ABC 2017; ACE 2017; Kawamori 2009; Koyasu 2010; Yun 2016). But again, some trials altered the criteria. Two trials lowered the FPG; Kawamori 2009 lowered it to 6.9 mmol/L and Yun 2016 lowered it to 6.1 mmol/L.
We excluded trials with participants that had T2DM. However, Koyasu 2010 also included participants with ‘mild T2DM’, which they defined as a FPG of less than 7.0 mmol/L, a 2hPG of more than 11.1 mmol/L, and a HbA1c of less than 6.5%. The current criteria for T2DM are a FPG of at least 7.0 mmol/L , or a 2hPG of at least 11.1 mmol/L (WHO/IDF 2006), or a HbA1c of at least 6.5% (ADA 2010). The ‘mild T2DM’ participants had a lower FPG and HbA1c than needed for a T2DM diagnosis, but did have a 2hPG of 11.1 or higher mmol/L. Therefore, the participants could be said to have T2DM. However, as the average 2hPG of the entire trial population was around 10.7 mmol/L in the acarbose group and 10.4 mmol/L in the control group, which is below the 11.1 mmol/L needed for T2DM diagnosis, and the participants had a FPG of 7.0 mmol/L or less and HbA1c of 6.5% or less, we decided to include this trial.
EDIT 1997 included participants at increased risk for T2DM with a FPG of 5.5 to 7.7 mmol/L.
Interventions
The alpha‐glucosidase inhibitor interventions were all administered orally.
In two trials, the acarbose dose started at 25 mg three times a day and increased to 50 mg three times a day during the first weeks (Fang 2004; Yun 2016). In four trials, the acarbose dose was 50 mg three times a day from the start (ACE 2017; EDIT 1997; Koyasu 2010; Wang 2000). In DAISI 2008, the acarbose dose started at 50 mg once daily and increased to 50 mg three times a day. In STOP‐NIDDM 2002, the acarbose dose started at 50 mg three times a day and ended at 100 mg three times a day or the maximum tolerated dose.
Finally, the two trials that investigated the effect of voglibose used a dose of 0.2 mg three times a day (ABC 2017; Kawamori 2009). ABC 2017 reduced the dose to a quarter or half of the original dose in case of gastrointestinal adverse effects.
In three trials, the participants did not take the trial medication on the days the glycaemic tests were performed (ACE 2017; DAISI 2008; Fang 2004). In one trial, the trialists describe that at the end of the intervention period the participants in the acarbose group took the final oral glucose tolerance test (OGTT) after a week‐long wash‐out period (Wang 2000). The other trials did not explicitly state if the participants were on trial medication or not when they performed the glycaemic tests (ABC 2017; EDIT 1997; Kawamori 2009; Koyasu 2010; STOP‐NIDDM 2002; Yun 2016). However, for the FPG test the participants would have to have been fasting, and because the medications have to be taken with a meal, it can be assumed that they would not have taken their medication for these tests. Additionally, the medication would not have had an effect on the 2hPG OGTT tests. Alpha‐glucosidase inhibitors inhibit an enzyme that breaks down complex carbohydrates, but the OGTT test uses glucose, a monosaccharide. The medication would only have had an effect if any of the trials had used a full‐meal tolerance test, but this is not the case.
Outcomes
Six trials explicitly stated a primary and secondary outcome in the publication (ABC 2017; ACE 2017; DAISI 2008; Kawamori 2009; Koyasu 2010; STOP‐NIDDM 2002). The most commonly defined primary outcome was the development of T2DM. ACE 2017 defined T2DM as two successive plasma glucose values of a FPG of 7.0 mmol/L, or more, or 2hPG of 11.1 mmol/L or more. Kawamori 2009 defined it as an HbA1c level of 6.5% or more and, on two separate occasions, a 2hPG of 11.1 mmol/L, or more, a FPG of 7.0 mmol/L or more, or a random plasma glucose concentration of 11.1 mmol/L or more. DAISI 2008, Fang 2004 and Wang 2000 defined T2DM as a FPG of 7.8 mmol/L or more, or a 2hPG of 11.1 mmol/L or more, or both. Finally, STOP‐NIDDM 2002 defined T2DM as a 2hPG of 11.1 mmol/L or more.
Trial registers or similar documents were not available for a number of trials (EDIT 1997; Fang 2004; Wang 2000; Yun 2016). For DAISI 2008 and Kawamori 2009, there were no differences between the trial registers and the publications. However, for STOP‐NIDDM 2002, the definition of the outcome cardiovascular events was different in the final publication compared with the trial register information. In ABC 2017, the outcome progression from IGT to T2DM, which was mentioned in the trial register, was not reported in the final publication. The trial register for Koyasu 2010 mentions both the incidence of cardiovascular events and carotid intima‐medial thickness (IMT) as primary outcome, but the publication only mentions the change in IMT.
Six trials reported all‐cause mortality (ABC 2017; ACE 2017; DAISI 2008; Kawamori 2009; Koyasu 2010; STOP‐NIDDM 2002). Four trials reported cardiovascular mortality, non‐fatal myocardial infarction, non‐fatal stroke, and congestive heart failure (ABC 2017; Koyasu 2010; STOP‐NIDDM 2002; Yun 2016). Three trials reported serious adverse events (ACE 2017; DAISI 2008; Kawamori 2009). Four trials reported non‐serious adverse events (DAISI 2008; Kawamori 2009; STOP‐NIDDM 2002; Wang 2000).
Of the secondary outcomes, seven trials reported measures of blood glucose control and lipids (ABC 2017; ACE 2017; DAISI 2008; Fang 2004; Koyasu 2010; STOP‐NIDDM 2002; Yun 2016). Three trials reported body weight (ACE 2017; Koyasu 2010; STOP‐NIDDM 2002), and five listed reported BMI (ACE 2017; Fang 2004; Koyasu 2010; STOP‐NIDDM 2002; Yun 2016). Six trials reported data on blood pressure (ABC 2017; ACE 2017; Fang 2004; Koyasu 2010; STOP‐NIDDM 2002; Yun 2016). Finally, one trial reported hypoglycaemic episodes (ACE 2017). EDIT 1997 reported that they had investigated a number of outcomes (e.g. plasma glucose and lipids), but these data have not been accessible to us thus far. We acquired some of the data on measures of blood glucose control, lipids, body weight, BMI, and blood pressure through contact with the trial authors (ABC 2017; ACE 2017; STOP‐NIDDM 2002), or from the trial protocol (DAISI 2008).
Subgroup analyses within the included trials
The subgroup analyses in ACE 2017 looked at sex (male/female), region in China (Beijing and Tainjin/Central/South and Southwest/West and East/Northeast/Hong Kong), coronary heart disease inclusion criteria (previous myocardial infarction/previous unstable angina/current stable angina/more than 1 of the above), history of heart failure (yes/no), age (≤ 63.5/> 63.5), HbA1c (≤ 5.9/> 5.9), FPG (≤ 5.47 mmol/L/> 5,47 mmol/L), 2hPG (≤ 9.12 mmol/L/> 9.12 mmol/L), systolic blood pressure (≤ 130 mmHg/> 130 mmHg), BMI (≤ 25 kg/m²/> 25 kg/m²), and estimated glomerular filtration rate (≤ 88.5 mL/min/1.73 m²/> 25.0 mL/min/1.73 m²). They found a HR of 0.70 (95% CI 0.50 to 0.99) for the 5‐point composite outcome for the subgroup of the northeast region of China. There were no statistically significant effects found in the other subgroups.
The subgroups that ABC 2017 analysed were sex (male/female), age (< 65/≥ 65), BMI (< 25 kg/m²/≥ 25 kg/m²), hypertension (no/yes), dyslipidaemia (no/yes), smoking (no/yes), arteriosclerosis obliterans (no/yes), and OGTT (no/yes). The only factor that statistically significantly affected the risk of cardiovascular events was age. The group of less than 65 years had statistically significantly fewer events in the control group than in the voglibose group (logrank P = 0.02).
In Kawamori 2009, the analysed subgroups were age (10‐year increase), sex (male/female), BMI (5 kg/m² increase), dyslipidaemia (yes/no), hypertension (yes/no), family history of diabetes (yes/no), 2hPG (0.55 mmol/L increase), insulinogenic index (0.2 decrease), homoeostasis model assessment for insulin resistance (1 increase), smoker (yes/no), intensity of daily activity (I/III to IV), intensity of daily activity (II/III to IV), and concomitant use of ACE inhibitor or angiotensin II receptor blocker (yes/no). According to these subgroup analyses, people with a higher BMI (HR 1.495, P = 0.0023), people with a lower insulinogenic index (HR 1.246, P < 0.0001), and people who had a higher intensity of daily activity (HR 1.992, P < 0.0001), had a higher risk of developing T2DM.
In STOP‐NIDDM 2002, the (univariate) subgroup analyses included FPG, 2hPG, fasting insulin, 2‐hour insulin, HbA1c, total cholesterol, LDL, HDL, total triglycerides, systolic blood pressure, diastolic blood pressure, weight, BMI, waist circumference, concomitant medications, and current smoker status. People with a higher FPG (HR 1.767, P = 0.03), people with a higher systolic blood pressure (HR 1.029, P < 0.001), people with a higher diastolic blood pressure (HR 1.043, P = 0.006), and people with concomitant medications (HR 2.071, P = 0.02) had a higher risk of cardiovascular events. They also performed multivariate analyses on the outcomes FPG (HR 1.830, P = 0.03) and systolic blood pressure (HR 1.031, P < 0.001).
Excluded studies
We excluded 1212 records after screening the title and abstract. We read the full text of the remaining 25 records. We excluded one trial after evaluation of the full publication, because the population consisted of both people with T2DM and people with IGT (Kataoka 2012). We contacted the trial authors for data for people with IGT only, but did not receive a reply. The other excluded records were not full‐text publications, but full‐text online trial records. Six of these trials had a trial population (T2DM) that did not match our criteria (ABDOMEN study; Aoki 2010; MM study; Narita 2009; Toyoda 2012; Watada 2012), and three trials were never completed (JEDIS study; Medizinische Klinik B study; NCT00417950). There are a further three trials that we excluded after evaluation of the full publication at the time of the original version of this review (EDIP; Mangiagli 2004; Yang 2001). We excluded these trials due to the participants having T2DM (EDIP), no randomisation (Mangiagli 2004) and no mention of randomisation (Yang 2001).
Risk of bias in included studies
For details on the risk of bias of the included trials see Characteristics of included studies.
For an overview of review authors' judgements about each risk of bias item for individual trials and across all trials see Figure 2 and Figure 3.

Risk of bias graph: review authors' judgements about each risk of bias item presented as percentages across all included trials (blank cells indicate that the particular outcome was not measured in some trials).
T2DM: type 2 diabetes mellitus

Risk of bias summary: review authors' judgements about each risk of bias item for each included trial (blank cells indicate that the particular outcome was not measured in some trials)
ABC: Alpha‐glucosidase‐inhiT2DM: type 2 diabetes mellitus
Allocation
With respect to selection bias, five trials had both an adequate randomisation and allocation concealment (ABC 2017; ACE 2017; Kawamori 2009; DAISI 2008; STOP‐NIDDM 2002). The risk of selection bias was unclear for the other trials. Fang 2004 used the 'random number table method', however, there was baseline imbalance (e.g. a 2hPG of 8.38 mmol/L in the acarbose group and a 2hPG of 6.35 mmol/L in the no‐intervention group), which suggests the randomisation was not adequate.
Blinding
Four trials reported blinding of participants and personnel (ACE 2017; DAISI 2008; Kawamori 2009; STOP‐NIDDM 2002). Four trials had no blinding of participants and personnel (ABC 2017; Koyasu 2010; Wang 2000; Yun 2016), and for two trials information was lacking about precise methods of blinding (EDIT 1997; Fang 2004). Five trials assessed outcomes in a blinded fashion (ABC 2017; ACE 2017; DAISI 2008; Koyasu 2010; STOP‐NIDDM 2002). In the other trials, this was unclear.
We judged the risk of performance and detection bias as low for the following outcomes: all‐cause mortality, cardiovascular mortality, incidence of T2DM, measures of blood glucose control, serious adverse events, amputation of lower extremity, blindness or severe vision loss, end‐stage renal disease, hypoglycaemia, time to progression of T2DM, socioeconomic effects, lipids, BMI, body weight, and blood pressure because we judged these outcomes were not likely to have been influenced by blinding conditions. Only EDIT 1997 measured the outcome health‐related quality of life, and the risk of performance and detection bias was unclear, because there was not enough information available.
The outcome non‐serious adverse events had a low risk of performance bias in trials with adequate blinding (DAISI 2008; Kawamori 2009; STOP‐NIDDM 2002), an unclear risk of bias in one trial (EDIT 1997), and a high risk of bias in the trials with no blinding (Yun 2016; Wang 2000). The risk of detection bias for this outcome was low in two trials (DAISI 2008; STOP‐NIDDM 2002), and unclear in four trials (Fang 2004; Kawamori 2009; Wang 2000; Yun 2016).
Incomplete outcome data
The outcomes all‐cause mortality and cardiovascular mortality had a high risk of attrition bias in three trials (DAISI 2008; Kawamori 2009; STOP‐NIDDM 2002), and a low risk in four trials (ABC 2017; ACE 2017; Koyasu 2010; Yun 2016). The incidence of T2DM had high risk of attrition bias in three trials (DAISI 2008; Kawamori 2009; STOP‐NIDDM 2002), an unclear risk in one trial (EDIT 1997), and a low risk in three trials (ACE 2017; Fang 2004; Wang 2000). The outcome measures of blood glucose control had a high risk of attrition bias in three trials (DAISI 2008; Kawamori 2009; STOP‐NIDDM 2002), an unclear risk in one trial (EDIT 1997), and a low risk in three trials (Fang 2004; Koyasu 2010; Wang 2000). The outcome non‐fatal myocardial infarction had a high risk of attrition bias in one trial (STOP‐NIDDM 2002), and a low risk in three trials (ABC 2017; Koyasu 2010; Yun 2016). The outcome non‐serious adverse events had a high risk of attrition bias in three trials (DAISI 2008; Kawamori 2009; STOP‐NIDDM 2002), an unclear risk in one trial (EDIT 1997), and a low risk in three trials (ACE 2017; Wang 2000; Yun 2016). Finally, the outcome serious adverse events had a high risk of attrition bias in two trials (DAISI 2008; Kawamori 2009) and a low risk in three trials (ACE 2017; Wang 2000; Yun 2016).
All trials had losses to follow‐up. The dropout rate ranged from 5.9% to 50%.
The overall risk of attrition bias was high in three trials (DAISI 2008; Kawamori 2009; STOP‐NIDDM 2002), especially due to a high number of dropouts and a high difference in attrition rate between groups. DAISI 2008 had the highest percentage of dropouts, with a 50% dropout in the treatment group and 47.9% in the control group. STOP‐NIDDM 2002 also had quite a high number of dropouts, with a much higher dropout rate in the treatment group (30.9%), compared to the control group (19%). Most dropouts in the intervention groups were due to adverse events, in particular gastrointestinal adverse effects. In the control groups, the most common dropout reason was withdrawn consent (STOP‐NIDDM 2002), or adverse events (DAISI 2008; Kawamori 2009). In one trial, the risk of attrition bias was unclear (EDIT 1997), and in the remaining trials, the risk was low (Fang 2004; Koyasu 2010; Wang 2000; Yun 2016). Five trials analysed the data using intention‐to‐treat analysis (ABC 2017; ACE 2017; DAISI 2008; Kawamori 2009; STOP‐NIDDM 2002), though in the case of STOP‐NIDDM 2002 they used a so‐called "modified intention‐to‐treat analysis", where trialists excluded 61 participants who dropped out immediately after randomisation without taking trial medication.
Selective reporting
For three trials, the risk of reporting bias was unclear, due to the fact that there was no protocol or trials register available (Fang 2004; Wang 2000; Yun 2016). The risk of reporting bias was low in two trials (ACE 2017; DAISI 2008). The outcomes specified in DAISI 2008 were the same as specified in the trials register and the publication. ACE 2017 showed a difference between the trials register and the final publication regarding the primary composite outcome (a three‐point major cardiovascular adverse event outcome), which was changed into a five‐point major cardiovascular adverse event outcome, which we did not judge as a high risk of reporting bias.
For five trials, the risk of reporting bias was high (ABC 2017; EDIT 1997; Kawamori 2009; Koyasu 2010; STOP‐NIDDM 2002). In their trial registration, the ABC 2017 authors describe the primary outcomes as cardiovascular mortality and cardiovascular events. However, in the final publication they specify these outcomes as, "cardiovascular death, non‐fatal MI, non‐fatal unstable angina, non‐fatal stroke, and percutaneous coronary intervention/coronary artery bypass graft". Furthermore, the secondary outcomes mentioned in the trials register (all‐cause mortality; hospitalisation due to heart failure, coronary artery disease, and cerebrovascular disease; progression of IGT to diabetes; development or deterioration of hypertension or hyperlipidaemia; deterioration of renal function), were different in the publication (all‐cause mortality; hospitalisation due to heart failure; death from cardiovascular disease; non‐fatal myocardial infarction; non‐fatal unstable angina; treatment with coronary revascularisation; non‐fatal stroke).
The trial register for Koyasu 2010 mentions the primary outcomes, incidence of cardiovascular events (defined as, "new onset myocardial infarction, worsening anginal status and/or angiographic restenosis"), and carotid intima‐medial thickness (IMT). In the publication however, the only primary outcome is the change in IMT measured in the right and left common carotid arteries. Similarly, there are differences in the secondary outcomes. In the trial register, these are ultrasonic echocardiography measures, HbA1c, insulin resistance index (IRI), blood glucose levels, HOMA‐R and HOMA‐beta (homeostatic model assessment), and plasma lipid profile. In the publication, the secondary outcomes are changed to glucose profiles (OGTT), HbA1c and lipid profiles, incidence of death, non‐fatal myocardial infarction, repeat percutaneous coronary intervention, and stroke. Thus, the ultrasonic echocardiography measures, IRI, HOMA‐R and HOMO‐beta are not mentioned, and mortality and cardiovascular events are added.
For the STOP‐NIDDM 2002 trial, most outcomes were the same for the design paper (Chiasson 1998 under STOP‐NIDDM 2002), and the publications (Chiasson 2002; Chiasson 2003 under STOP‐NIDDM 2002). However, there was a difference in the definition of cardiovascular events. In the design paper this outcome included myocardial infarction, cerebrovascular accident and congestive heart failure. In the final publications trialists also included new angina, revascularisation procedures, cardiovascular death, and peripheral vascular disease. Kawamori 2009 measured outcomes, but not all the data were reported (FPG, HbA1c, triglycerides, total cholesterol, HDL‐cholesterol, blood pressure, and body weight). EDIT 1997 had a high risk of reporting bias, due to the fact that this trial finished more than 10 years ago and has still not been published.
Other potential sources of bias
Three trials had an unclear risk of funding bias (DAISI 2008; EDIT 1997; STOP‐NIDDM 2002). Four trials were funded by Bayer (ACE 2017; DAISI 2008; EDIT 1997; STOP‐NIDDM 2002). One trial was additionally funded by Merck‐Lipha (EDIT 1997), and two trials were funded by ‘non‐commercial’ funding (ABC 2017; Kawamori 2009). Additionally, in ABC 2017, the main researchers received grants and personal fees from Pfizer and Takeda, and in ACE 2017, the main researcher received grants from Bayer.
Effects of interventions
See: Summary of findings for the main comparison Acarbose compared to placebo; Summary of findings 2 Acarbose compared to no intervention
Most data for our analyses originated from trials comparing AGI with placebo (N = 4) or comparing AGI with no intervention (N = 4). Therefore, we presented 'Summary of findings' tables for these main comparisons (summary of findings Table for the main comparison; summary of findings Table 2).
Baseline characteristics
For details of baseline characteristics, see Appendix 5, Appendix 6 and Appendix 7.
Alpha‐glucosidase inhibitors versus placebo
Four trials compared acarbose with placebo (ACE 2017; DAISI 2008; EDIT 1997; STOP‐NIDDM 2002). However, only three trials provided sufficient data to allow statistical comparison (ACE 2017; DAISI 2008; STOP‐NIDDM 2002). One trial has not been published yet and most data are not available (EDIT 1997). One trial compared voglibose with placebo (Kawamori 2009).
None of the trials reported amputation of lower extremity, blindness or severe vision loss, end‐stage renal disease, health‐related quality of life, time to progression to T2DM, or socioeconomic effects.
Primary outcomes
All‐cause mortality
In the acarbose groups, 223 (5.5%) out of 4046 participants died, compared to 225 (5.6%) out of 4023 in the placebo groups (RR 0.98, 95% CI 0.82 to 1.18; P = 0.86; 3 trials; 8069 participants; very low‐certainty evidence; Analysis 1.1). The 95% prediction interval ranged between 0.29 and 3.27. ACE 2017, which included participants with coronary heart disease, contributed most weight to the analysis; 97.1% of the events occurred in this trial.
In the voglibose group, six (0.7%) out of 897 participants died, compared to no participants out of 881 in the placebo group (RR 12.77, 95% CI 0.72 to 226.31; P = 0.08; 1 trial; 1778 participants; very low‐certainty evidence; Analysis 1.1; Kawamori 2009).
Incidence of T2DM
In the acarbose groups 670 (16.7%) out of 4014 participants developed T2DM, compared to 812 (20.3%) out of 3994 in the placebo groups. Therefore, acarbose reduced or delayed the incidence of T2DM in the acarbose group: RR 0.82, 95% CI 0.75 to 0.89; P < 0.0001; 3 trials; 8008 participants; moderate‐certainty evidence; Analysis 1.2). The 95% prediction interval ranged between 0.48 and 1.40. ACE 2017, which included participants with coronary heart disease and IGT, weighed heavy in this analysis: 64.0% of cases occurred in this trial.
ACE 2017 and DAISI 2008 defined T2DM as two successive values of FPG of 7.0 mmol/L or more, and 2hPG of 11.1 mmol/L or more (WHO 1985). STOP‐NIDDM 2002 defined T2DM as a 2hPG of 11.1 mmol/L or more, based on one test.
EDIT 1997 reported that the use of acarbose had a preventive effect on the incidence of T2DM for people with IGT (RR 0.66, P = 0.046). However, acarbose did not have a preventive effect when looking at the entire population consisting of people with IGT, IFG and NGT (RR 1.04, P = 0.81).
In the voglibose group, 50 (5.6%) out of 897 participants developed T2DM, compared to 106 (12%) out of 881 in the placebo group (RR 0.46, 95% CI 0.34 to 0.64; P < 0.0001; 1 trial; 1778 participants; low‐certainty evidence; Analysis 1.2; Kawamori 2009).
Serious adverse events
Three hundred and fifty‐one (9.5%) out of 3324 participants in the acarbose groups experienced serious adverse events compared to 312 (9.5%) out of 3301 in the placebo groups (RR 1.12, 95% CI 0.97 to 1.29; P = 0.13; 2 trials; 6625 participants; low‐certainty evidence; Analysis 1.3). ACE 2017, which included participants with coronary heart disease and IGT weighed heavy in this analysis: 97.9% of the events occurred in this trial.
The ACE 2017 authors did not report serious adverse events thought to be possible trial endpoints (i.e. cardiovascular events), and reported other serious adverse events if they occurred in at least 1% of participants in either treatment group. DAISI 2008 reported all serious adverse events.
The most common serious averse events in ACE 2017 were benign tumours, malignant or unspecified neoplasms (85 (3%) in the acarbose group and 88 (2%) in the placebo group). In DAISI 2008, the most common serious adverse events were cardiovascular events (3 (6.6%) in the acarbose group and 3 (5%) in the placebo group). STOP‐NIDDM 2002 reported 220 cases (31%) of cardiovascular adverse events in the acarbose group and 287 (40%) in the placebo group.
In the voglibose group, five (0.6%) out of 897 participants experienced serious adverse events compared to two (0.2%) out of 881 in the placebo group (RR 2.46, 95% CI 0.48 to 12.62; P = 0.28; 1 trial; 1778 participants; very low‐certainty evidence; Analysis 1.3; Kawamori 2009). These was a cerebral infarction and cholecystitis in the placebo group, and cholecystitis, colonic polyp or rectal neoplasm, inguinal hernia, liver dysfunction, and subarachnoid haemorrhage in the voglibose group.
Neoplasms
ACE 2017 reported that 88 participants in the placebo group (2%) and 85 participants in the acarbose group (3%) developed a benign tumour, malignant, or unspecified neoplasm. In DAISI 2008, one participant in the acarbose group died from colon carcinoma eight months after the last intake of the medication (1.7%). In STOP‐NIDDM 2002 there were three deaths from cancer in the acarbose group (0.4%), and one in the placebo group (0.1%). Finally, in Kawamori 2009 there was one death of cancer in the voglibose group (0.1%).
Secondary outcomes
Cardiovascular mortality
In the acarbose groups 148 (3.7%) out of 4046 participants died of cardiovascular causes, compared to 167 (4.2%) out of 4023 in the placebo group (RR 0.88, 95% CI 0.71 to 1.10; P = 0.26; 3 trials; 8069 participants; very low‐certainty evidence; Analysis 1.4). The 95% prediction interval ranged between 0.21 and 3.74. ACE 2017, which included participants with coronary heart disease, weighed heavy in this analysis: 97.8% of the events occurred in this trial.
STOP‐NIDDM 2002 defined cardiovascular mortality as, “death due to congestive heart failure, myocardial infarction, cerebrovascular event, cardiovascular procedures, pulmonary embolism, or sudden death.” ACE 2017 and DAISI 2008 did not specifically define this outcome.
In the voglibose group one (0.1%) out of 897 participants experienced serious adverse events compared to 0 (0%) out of 881 in the placebo group (RR 2.95, 95% CI 0.12 to 72.23; P = 0.51; 1 trial; 1778 participants; very low‐certainty evidence; Analysis 1.4; Kawamori 2009).
Non‐fatal myocardial infarction
In the acarbose group one (0.1%) out of 742 participants had a non‐fatal myocardial infarction, compared to 15 (2%) out of 744 in the placebo group (RR 0.10 (95% CI 0.02 to 0.53); P = 0.007; 2 trials; 1486 participants; very low‐certainty evidence; Analysis 1.5). STOP‐NIDDM 2002 defined non‐fatal myocardial infarction as, “clinical symptoms of myocardial ischaemia with elevated serum cardiac enzymes and electrocardiographic changes; at least 2 of 3 criteria had to be present for the clinical diagnosis”. DAISI 2008 did not specifically define the outcome.
Kawamori 2009, the voglibose trial, did not report this outcome.
Non‐fatal stroke
In the acarbose group, two (0.3%) out of 682 participants had a non‐fatal stroke, compared to four (0.6%) out of 686 in the placebo group (RR 0.50, 95% CI 0.09 to 2.74; P = 0.43; 1 trial; 1368 participants; very low‐certainty evidence; Analysis 1.6).
Kawamori 2009, the voglibose trial, did not report this outcome.
Congestive heart failure
In the acarbose group, 65 (1.6%) out of 3954 participants had congestive heart failure, compared to 75 (1.9%) out of 3936 in the placebo group (RR 0.87, 95% CI 0.63 to 1.21; P = 0.40; 2 trials; 7890 participants; very low‐certainty evidence; Analysis 1.7). ACE 2017, which included participants with coronary heart disease, weighed heavy in this analysis: 98.6% of the events occurred in this trial.
STOP‐NIDDM 2002 defined congestive heart failure as, "recent onset of new or aggravation of symptoms compatible with heart failure with supportive documentation such as chest radiograph or electrocardiographic changes”. ACE 2017 defined congestive heart failure as hospital admission for heart failure.
Kawamori 2009, the voglibose trial, did not report this outcome.
Non‐serious adverse events
In the acarbose group 751 (96.9%) out of 775 participants experienced non‐serious adverse events, compared to 723 (93.3%) out of 775 in the placebo group (RR 1.04, 95% CI 1.01 to 1.06; P = 0.0008; 2 trials; 1550 participants; Analysis 1.8). STOP‐NIDDM 2002 weighed heaviest in this analysis, as it contributes more than 93% of the events.
ACE 2017 only recorded non‐serious adverse events, “when trial medication was reduced or stopped as a result, or the event was thought to be related to study medication” and if they occurred in at least 5% of either treatment group. The only reported non‐serious adverse events were gastrointestinal disorders with 215 cases (7%) in the acarbose group and 150 cases (5%) in the placebo group. The most common non‐serious adverse events in DAISI 2008 were digestive problems, with 37 (60.7%) in the acarbose group and 10 (16.7%) in the placebo group. STOP‐NIDDM 2002 also noted the frequency of gastrointestinal adverse events. There were 597 (83.6%) cases of gastrointestinal adverse events in the acarbose group and 426 (59.6%) in the placebo group.
In the voglibose group 805 (89.7%) out of 897 participants experienced non‐serious adverse events, compared to 748 (84.9%) out of 881 in the placebo group (RR 1.06, 95% CI 1.02 to 1.10; P = 0.002; 1 trial; 1778 participants; Analysis 1.8; Kawamori 2009). The most common non‐serious adverse events were gastrointestinal problems, with 478 cases (53%) in the voglibose group and 200 cases (23%) in the placebo group.
Hypoglycaemia
In the acarbose group 421 (12.9%) out of 3272 participants experienced a hypoglycaemic episode, compared to 416 (12.8%) out of 3250 in the placebo group (RR 1.01, 95% CI 0.89 to 1.14; P = 0.94; 1 trial; 6522 participants; Analysis 1.9; ACE 2017).
Measures of blood glucose control
Fasting plasma glucose
The mean difference (MD) in change in fasting plasma glucose for acarbose versus placebo was −0.07 mmol/L (95% CI −0.12 to −0.02; P = 0.008; 3 trials; 7368 participants; Analysis 1.10). The 95% prediction interval ranged between −0.39 mmol/L and 0.25 mmol/L.
EDIT 1997 found that acarbose decreased fasting plasma glucose by 0.1 mmol/L (P = 0.0043).
2‐hour plasma glucose concentrations (OGTT)
Acarbose decreased post‐load glucose by 0.53 mmol/L (95% CI 0.14 to 0.92; P = 0.008; 3 trials; 6498 participants; Analysis 1.11). The 95% prediction interval ranged between −4.92 mmol/L and 3.86 mmol/L.
EDIT 1997 found that acarbose decreased post‐load blood glucose by 0.4 mmol/L (P = 0.0075).
HbA1c
The MD in HbA1c for acarbose versus placebo was −0.1% (95% CI −0.1 to −0.05; P < 0.0001; 3 trials; 6833 participants; Analysis 1.12). The 95% prediction interval ranged between −0.3% and 0.1%.
Plasma lipids
The MD in change in total cholesterol for acarbose versus placebo was −0.05 mmol/L (95% CI −0.10 to 0.00; P = 0.06; 3 trials; 6815 participants; Analysis 1.13). The 95% prediction interval ranged between −0.37 mmol/L and 0.27 mmol/L.
For change in HDL‐cholesterol for acarbose versus placebo the MD was 0.01 mmol/L (95% CI −0.00 to 0.03; P = 0.13; 3 trials; 6807 participants; Analysis 1.14). The 95% prediction interval ranged between −0.12 mmol/L and 0.14 mmol/L.
The MD in change in LDL‐cholesterol for acarbose versus placebo was −0.03 mmol/L (95% CI −0.07 to 0.01; P = 0.11; 3 trials; 6699 participants; Analysis 1.15). The 95% prediction interval ranged between −0.29 mmol/L and 0.23 mmol/L.
The MD in change in triglycerides for acarbose versus placebo was −0.07 mmol/L (95% CI −0.17 to 0.03; P = 0.19; 3 trials; 6843 participants; Analysis 1.16). The 95% prediction interval ranged between −0.78 mmol/L and 0.64 mmol/L.
Body weight
The MD in change in body weight for acarbose versus placebo was −0.7 kg (95% CI −1.6 to 0.2; P = 0.14; 2 trials; 6959; Analysis 1.17). Fixed‐effect model analysis showed a difference of −0.4 kg, 95% CI −0.6 to −0.2; P = 0.001 in favour of acarbose.
For BMI, the MD was −0.2 kg/m², 95% CI −0.4 to 0.03; P = 0.10; 2 trials; 6953 participants; Analysis 1.18. Fixed‐effect model analysis showed a difference of −0.1 kg/m² (95% CI −0.2 to −0.04; P = 0.003), in favour of acarbose.
Blood pressure
The MD in change in diastolic blood pressure for acarbose versus placebo was −0.3 mmHg (95% CI −0.8 to 0.2; P = 0.25; 2 trials; 7452 participants; Analysis 1.19).
For systolic blood pressure the MD was −0.5 mmHg (95% CI −1.3 to 0.3; P = 0.24; 2 trials; 7452 participants; Analysis 1.20).
Adjustment for high discontinuation rate in the acarbose arm of STOP‐NIDDM 2002
The discontinuation rate in the acarbose group of STOP‐NIDDM 2002 was higher than in the placebo group (acarbose 31% versus placebo 19%). Despite the fact that discontinuing participants remained in the ITT analyses, it is possible that those participants were not followed up regularly every third month, and thus possible occurrence of T2DM or a cardiovascular event was less likely to be discovered (Sawicki 2004).
In order to investigate the possible influence of differences in the frequency of follow‐up, we re‐analysed the data with the following adjustments: first we requested the mean number of trial visits for both treatment groups. Next, we divided the number of visits of the placebo group by the number of visits in the acarbose group. We used this outcome as a correction factor for the number of events in the acarbose group (occurrence of cardiovascular morbidity and T2DM).
The authors of STOP‐NIDDM 2002 reported that the mean numbers of trial visits in the acarbose group (N = 682) and in the placebo group (N = 686) were 13.3 (SD = 5.4) and 14.6 (SD = 4.3), respectively. The calculated correction factor was: 14.6/13.3 = 1.1. The outcomes before and after this correction factor are listed in Appendix 19. The effects sizes for incidence of T2DM and occurrence of any cardiovascular disease became smaller after the correction but remained statistically significant. The effects size for myocardial infarctions did not change (due to the fact that there was only one case in the acarbose group). The other outcomes remained statistically not significant after correction.
Alpha‐glucosidase inhibitors versus metformin
Two trials (EDIT 1997; Fang 2004), investigated this comparison but only Fang 2004 provided data for our analyses.
Fang 2004 did not report serious adverse events, cardiovascular mortality, non‐fatal myocardial infarction, congestive heart failure, non‐fatal stroke, amputation of lower extremity, blindness or severe vision loss, end‐stage renal disease, non‐serious adverse events, hypoglycaemia, health‐related quality of life, time to progression to T2DM, or socioeconomic effects.
Primary outcomes
All‐cause mortality
There were no deaths from 50 participants in the acarbose group, compared to one death (2.1%) out of 48 participants in the metformin group (RR 0.32, 95% CI 0.01 to 7.67; P = 0.48; 1 trial; 89 participants; very low‐certainty evidence; Analysis 2.1).
Incidence of T2DM
In the acarbose group, six (13.3%) out of 45 participants developed T2DM, compared to nine (20.5%) out of 44 in the metformin group (RR 0.65, 95% CI 0.25 to 1.68; P = 0.38; 1 trial; 89 participants; very low‐certainty evidence; Analysis 2.2).
Secondary outcomes
Measures of blood glucose control
Fasting plasma glucose
The MD in change in fasting plasma glucose for acarbose versus metformin was −0.39 mmol/L (95% CI −1.14 to 0.36; P = 0.31; 1 trial; 89 participants; Analysis 2.3).
2‐hour plasma glucose concentrations (OGTT)
The MD in change in post‐load glucose for acarbose versus metformin was −1.40 mmol/L (95% CI −2.25 to −0.55; P = 0.001; 1 trial; 89 participants; Analysis 2.4).
Plasma lipids
The MD of acarbose compared with metformin for total cholesterol was 0.90 mmol/L (95% CI 0.19 to 1.61; P = 0.01; 1 trial; 89 participants; Analysis 2.5).
The MD in change in triglycerides for acarbose versus metformin was 0.70 mmol/L (95% CI −0.06 to 1.46; P = 0.07; 1 trial; 89 participants; Analysis 2.6).
Body weight
The MD in change in BMI for acarbose versus metformin was −0.4 kg/m² (95% CI −1.5 to 0.7; P = 0.48; 1 trial; 89 participants; Analysis 2.7).
Blood pressure
The MD of acarbose compared with metformin for diastolic blood pressure was 6 mmHg (95% CI 3 to 9; P = 0.0002; 1 trial; 89 participants; Analysis 2.8).
For systolic blood pressure this was 1 mmHg (95% CI −5 to 7; P = 0.32; 1 trial; 89 participants; Analysis 2.9).
Alpha‐glucosidase inhibitors versus diet or exercise, or both
One trial investigated the comparison acarbose versus diet and exercise (Fang 2004) and another trial investigated the comparison voglibose versus diet and exercise (ABC 2017).
Neither of the trials reported serious adverse events, amputation of lower extremity, blindness or severe vision loss, end‐stage renal disease, hypoglycaemia, health‐related quality of life, time to progression to T2DM, or socioeconomic effects.
Primary outcomes
All‐cause mortality
No participants in either the acarbose or the diet and exercise groups died in Fang 2004 (very low‐certainty evidence).
ABC 2017 reported that 11 (2.6%) out of 424 died in the voglibose group, compared to six (1.4%) out of 435 in the diet and exercise group (RR 1.88, 95% CI 0.70 to 5.04; P = 0.21; 1 trial; 859 participants; very low‐certainty evidence; Analysis 3.1).
Incidence of T2DM
Fang 2004 reported that six (13.3%) out of 45 participants in the acarbose group developed T2DM, compared to 12 (33.3%) out of 36 in the diet and exercise group (RR 0.40, 95% CI 0.17 to 0.96; P = 0.04; 1 trial; 81 participants; low‐certainty evidence; Analysis 3.2).
ABC 2017, which compared voglibose with diet and exercise did not report T2DM incidence.
Secondary outcomes
Cardiovascular mortality
ABC 2017 reported that one (0.2%) participant out of 424 in the voglibose group died of cardiovascular causes, compared to none out of 435 in the diet and exercise group (RR 3.08, 95% CI 0.13 to 75.34; P = 0.49; 1 trial; 859 participants; very low‐certainty evidence; Analysis 3.3).
Non‐fatal myocardial infarction
ABC 2017 reported that 10 (2.4%) out of 424 participants in the voglibose group experienced a non‐fatal myocardial infarction, compared to nine (2.1%) out of 435 in the diet and exercise group (RR 1.14, 95% CI 0.47 to 2.78; P = 0.77; 1 trial; 859 participants; very low‐certainty evidence; Analysis 3.4).
Non‐fatal stroke
ABC 2017 reported that one participant (0.2%) out of 424 participants in the voglibose group experienced a non‐fatal stroke, compared to three (0.7%) out of 435 in the diet and exercise group (RR 0.34, 95% CI 0.04 to 3.27; P = 0.35; 1 trial; 859 participants; very low‐certainty evidence; Analysis 3.5).
Congestive heart failure
ABC 2017 reported that four (0.9%) out of 424 participants in the voglibose group experienced congestive heart failure, compared to eight (1.8%) out of 435 in the diet and exercise group (RR 0.51, 95% CI 0.16 to 1.69; P = 0.27; 1 trial; 859 participants; very low‐certainty evidence; Analysis 3.6).
Non‐serious adverse events
ABC 2017 reported that 89 (21%) out of 424 participants in the voglibose group experienced non‐serious adverse events, compared to 49 (11.3%) out of 435 in the diet and exercise group (RR 1.86, 95% CI 1.35 to 2.57; P < 0.001; 1 trial; 859 participants; Analysis 3.7). The most common non‐serious adverse events were gastrointestinal disorders, with 36 cases (8.5%) of gastrointestinal disorders in the voglibose group and 3 (0.7%) cases in the control group.
Measures of blood glucose control
Fasting plasma glucose
Acarbose reduced fasting blood glucose by −1.37 mmol/L (95% CI −0.50 to −2.24; P = 0.002; 1 trial; 81 participants; Analysis 3.8; Fang 2004).
The MD in change in fasting plasma glucose for voglibose versus diet and exercise was −1.00 mmol/L (95% CI −3.44 to 1.44; P = 0.42; 1 trial; 428 participants; Analysis 3.8; ABC 2017).
2‐hour plasma glucose concentrations (OGTT)
Acarbose reduced post‐load blood glucose by −2.79 mmol/L (95% CI −1.79 to −3.79; P < 0.0001; 1 trial; 81 participants; Analysis 3.9; Fang 2004).
The MD in change in post‐load blood glucose for voglibose versus diet and exercise was 0.70 mmol/L, 95% CI −7.53 to 8.93; P = 0.87; 1 trial; 391 participants; Analysis 3.9; ABC 2017).
HbA1c
The MD in change in HbA1c for voglibose versus diet and exercise was 0.1% (95% CI −0.3 to 0.5; P = 0.58; 1 trial; 531 participants; Analysis 3.10; ABC 2017).
Plasma lipids
The MD in change in total cholesterol for acarbose versus diet and exercise was −0.50 mmol/L (95% CI −1.33 to 0.33; P = 0.24; 1 trial; 81 participants; Analysis 3.11; Fang 2004).
The MD in change in total cholesterol for voglibose versus diet and exercise was 0.00 mmol/L (95% CI −6.47 to 6.47; P = 1.00; 1 trial; 505 participants; Analysis 3.11; ABC 2017).
The MD in change in triglycerides for acarbose versus diet and exercise was −0.10 mmol/L (95% CI −0.76 to 0.56; P = 0.77; 1 trial; 81 participants; Analysis 3.12; Fang 2004).
The MD in change in triglycerides for voglibose versus diet and exercise was −0.10 mmol/L, 95% CI −17.03 to 16.83; P = 0.99; 1 trial; 531 participants; Analysis 3.12; ABC 2017).
The MD in change in HDL‐cholesterol for voglibose versus diet and exercise was 0.00 mmol/L (95% CI −2.51 to 2.51; P = 1.00; 1 trial; 545 participants; Analysis 3.13; ABC 2017).
Body weight
The MD in change in BMI for acarbose versus diet and exercise was −0.2 kg/m² (95% CI −1.1 to 0.7; P = 0.67; 1 trial; 81 participants; Analysis 3.14; Fang 2004).
Blood pressure
The MD in change in diastolic blood pressure for acarbose versus diet and exercise was 3 mmHg (95% CI −0.1 to 6; P = 0.06; 1 trial; 81 participants; Analysis 3.15; Fang 2004).
The MD in change in diastolic blood pressure for voglibose versus diet and exercise was 0 mmHg (95% CI −2 to 2; P = 1.00; 1 trial; 586 participants; Analysis 3.15; ABC 2017).
The MD in change in systolic blood pressure for acarbose versus diet and exercise was −6 mmHg (95% CI −12 to 0.2; P = 0.06; 1 trial; 81 participants; Analysis 3.16; Fang 2004).
The change in systolic blood pressure for voglibose versus diet and exercise was 1.00 mmHg (95% CI −2 to 4; P = 0.50; 1 trial; 587 participants; Analysis 3.16; ABC 2017).
Alpha‐glucosidase inhibitors versus no intervention
Four trials compared acarbose with no intervention (Fang 2004; Koyasu 2010; Wang 2000; Yun 2016).
None of the trials reported serious adverse events, amputation of lower extremity, blindness or severe vision loss, end‐stage renal disease, hypoglycaemia, health‐related quality of life, time to progression to T2DM, or socioeconomic effects for this comparison.
Primary outcomes
All‐cause mortality
Fang 2004 and Koyasu 2010 did not report any deaths in either the acarbose group or the no‐intervention group (Analysis 4.1; very low‐certainty evidence). The other trials did not report mortality.
Incidence of T2DM
In the acarbose group, seven (9.3%) out of 75 participants developed T2DM, compared to 18 (27.7%) out of 65 in the no‐intervention group (RR 0.31; 95% CI 0.14 to 0.69; P = 0.004; 2 trials; 140 participants; very low‐certainty evidence; Analysis 4.2). Both Fang 2004 and Wang 2000, defined T2DM as a FPG of at least 7.8 mmol/L and a 2hPG at least 11.1 mmol/L (WHO 1985).
Secondary outcomes
Cardiovascular mortality
In the acarbose group, three (2.9%) out of 102 participants died of cardiovascular causes compared to five (4.9%) out of 103 participants in the no‐intervention group (RR 0.64, 95% CI 0.16 to 2.56; P = 0.53; 2 trials; 205 participants; very low‐certainty evidence; Analysis 4.3). Their were no cases of cardiovascular mortality in Koyasu 2010, so Yun 2016, which included participants with acute coronary syndrome, weighs 100% in this analysis. Neither Koyasu 2010 nor Yun 2016 specifically defined the outcome cardiovascular mortality.
Non‐fatal myocardial infarction
In the acarbose group, two (2%) out of 102 participants experienced a non‐fatal myocardial infarction, compared to seven (6.8%) out of 103 in the no‐intervention group (RR 0.30, 95% CI 0.07 to 1.41; P = 0.13; 2 trials; 205 participants; very low‐certainty evidence; Analysis 4.4). There were no cases of non‐fatal myocardial infarction in Koyasu 2010, so again, Yun 2016, which included participants with acute coronary syndrome, weighs 100% in this analysis. In both trials, the population had a history of myocardial infarction. In Koyasu 2010, 42.9% of the acarbose group and 51.3% of the control group had a previous myocardial infarction. In Yun 2016, this was 68.7% in the acarbose group and 63.2% in the control group.
Non‐fatal stroke
In the acarbose group two (2%) out of 102 participants experienced a non‐fatal stroke, compared to four (3.9%) out of 103 in the no‐intervention group (RR 0.53, 95% CI 0.10 to 2.81; P = 0.46; 2 trials; 205 participants; very low‐certainty evidence; Analysis 4.5). In Koyasu 2010, there were no cases of non‐fatal stroke, so here too Yun 2016, which included participants with acute coronary syndrome, weighs 100% in this analysis. Neither Yun 2016 nor Koyasu 2010 specifically defined non‐fatal stroke.
Congestive heart failure
In the acarbose group, five (4.9%) out of 102 participants had congestive heart failure, compared to six (5.8%) out of 103 in the no‐intervention group (RR 0.87, 95% CI 0.27 to 2.37; P = 0.81; 2 trials; 205 participants; Analysis 4.6; very low‐certainty evidence). Yun 2016, which included participants with acute coronary syndrome, specified non‐fatal heart failure as, "severe heart‐failure". Koyasu 2010 did not further specify the outcome.
Non‐serious adverse events
One trial reported data on non‐serious adverse effects (Wang 2000). Two participants in the acarbose group (6.7%) and no participants in the no‐intervention group reported adverse effects (RR 5.00, 95% CI 0.25 to 99.95; P = 0.29; 1 trial; 60 participants; Analysis 4.7).
Hypoglycaemia
Yun 2016 reported that there were no cases of hypoglycaemia in the acarbose group or the no‐intervention group (Analysis 4.8).
Measures of blood glucose control
Fasting plasma glucose
The MD in change in fasting plasma glucose for acarbose versus no intervention was −0.35 mmol/L (95% CI −0.79 to 0.08; P = 0.11; 3 trials; 285 participants; Analysis 4.9). The 95% prediction interval ranged between −5.24 mmol/L and 4.54 mmol/L. Using the fixed‐effect model the difference was −0.22 mmol/L (95% CI −0.39 to −0.06), in favour of AGI.
2‐hour plasma glucose concentrations (OGTT)
The change in post‐load glucose for acarbose versus no intervention ranged between −0.91 mmol/L and −4.53 mmol/L (3 trials; 285 participants; Analysis 4.10). The 95% prediction interval ranged between −23.56 mmol/L and 18.56 mmol/L.
HbA1c
The change in HbA1c for acarbose versus no intervention ranged between −0.04% and −0.5% (2 trials; 205 participants; Analysis 4.11).
Plasma lipids
The MD in change in total cholesterol for acarbose versus no intervention was −0.32 mmol/L (95% CI −0.74 to 0.10; P = 0.13; 3 trials; 285 participants; Analysis 4.12). The 95% prediction interval ranged between −4.83 mmol/L and 4.19 mmol/L.
For HDL‐cholesterol the MD was −0.01 mmol/L (95% CI −0.10 to 0.07; P = 0.75; 1 trial; 81 participants; Analysis 4.13; Koyasu 2010).
The MD in change in LDL‐cholesterol for acarbose versus no intervention was −0.03 mmol/L (95% CI −0.22 to 0.15; P = 0.71; 2 trials; 205 participants; Analysis 4.14).
For triglycerides the MD was −0.22 mmol/L (95% CI −0.40 to −0.05; P = 0.01; 3 trials; 285 participants; Analysis 4.15). The 95% prediction interval ranged between −1.32 mmol/L and 0.88 mmol/L.
Body weight
The MD in change in body weight for acarbose versus no intervention was −1.4 kg (95% CI −2.4 to −0.4; P = 0.005; 1 trial; 81 participants; Analysis 4.16), in favour of acarbose (Koyasu 2010).
The MD in change in BMI for acarbose versus no intervention was −0.7 kg/m² (95% CI −1.0 to −0.3; P = 0.0003; 3 trials; 285 participants; Analysis 4.17). The 95% prediction interval ranged between −2.9 kg/m² and 1.6 kg/m².
Blood pressure
The MD in change in diastolic blood pressure for acarbose versus no intervention was −0.3 mmHg (95% CI −4 to 3; P = 0.88; 3 trials; 285 participants; Analysis 4.18). The 95% prediction interval ranged between −40 mmHg and 40 mmHg.
For the systolic blood pressure the MD was −4 mmHg (95% CI −7 to −1; P = 0.009; 3 trials; 285 participants; Analysis 4.19). The 95% prediction interval ranged between −22 mmHg and 14 mmHg.
Discussion
Summary of main results
In the first version of this review (New Reference), we found evidence that acarbose reduces the incidence of T2DM in people with IGT, and we also concluded that acarbose may prevent the occurrence of cardiovascular events. In this update the evidence for a reduction in incidence of T2DM is confirmed. However, whether AGI prevent the underlying cause remains unclear. Furthermore, the addition of new trials to our review has made a beneficial effect of AGI on cardiovascular mortality or cardiovascular events less likely.
Overall completeness and applicability of evidence
This review includes 10 completed trials investigating the effect of AGI on the incidence of T2DM, cardiovascular events and other outcomes for one year or longer. Most trials used acarbose as the intervention, but two trials investigated voglibose (ABC 2017; Kawamori 2009). All trials included both men and women and the participants were generally above 50 years old. The majority of trials were performed in China or Japan, but three trials were performed in Western countries (DAISI 2008; EDIT 1997; STOP‐NIDDM 2002). The results may therefore be generalised to adults from both genders and from different ethnicities.
The majority of trials reported incidence of T2DM (ACE 2017; DAISI 2008; Fang 2004; Kawamori 2009; Koyasu 2010; STOP‐NIDDM 2002), and all‐cause mortality (ABC 2017; ACE 2017; DAISI 2008; Fang 2004; Kawamori 2009; STOP‐NIDDM 2002; Wang 2000), whereas none of the trials reported on the secondary outcomes amputation of lower extremity, blindness or severe vision loss, end‐stage renal disease, health‐related quality of life, time to progression to T2DM and socioeconomic effects.
Decrease in incidence of type 2 diabetes mellitus
We found evidence from several trials that AGI reduce the incidence of T2DM (ACE 2017; Kawamori 2009; Fang 2004; STOP‐NIDDM 2002; Wang 2000). An effect on the incidence of T2DM is not surprising. After all, AGI have a clear effect on glycaemic control in people with T2DM (Van de Laar 2005). Such a drug will have large effects on the 'incidence' of diabetes for people who are at the border of fulfilling the criteria for T2DM. So, the question is whether AGI prevent, delay, or mask T2DM. The authors of STOP‐NIDDM 2002 are undecided, as they sometimes speak of "prevention" (in the title) and sometimes of "delay" (in the summary), (Chiasson 2002 under STOP‐NIDDM 2002). Critics of STOP‐NIDDM 2002 suggested that acarbose masks T2DM, since 15.4% of the participants on acarbose compared to 10.6% on placebo converted to T2DM during a three‐month wash‐out phase (Kaiser 2004). The authors of ACE 2017 speak of a reduced risk of T2DM, but do not go into detail about whether this reflects prevention, delay or masking of T2DM.
To assess the value of AGI with respect to the effects on the development of T2DM, it is probably more straightforward to look at the effects on glycaemic control. After all, IGT refers to an intermediate state between normal glucose homeostasis and T2DM. In our meta‐analysis we found a reduction in HbA1c (−0.08%, 95% CI −0.12 to −0.05), fasting blood glucose (−0.07 mmol/L, 95% CI −0.12 to −0.02), and 2‐hour plasma glucose (−0.53 mmol/L, 95% CI −0.92 to −0.14), when comparing acarbose to placebo. When comparing acarbose to no intervention, only the 2‐hour plasma glucose showed a decrease (−2.50 mmol/L, 95% CI −4.18 to −0.83). Those effects are mostly smaller than obtained in a Cochrane Review on alpha‐glucosidase inhibitors for people with T2DM (Van de Laar 2005). This may be explained by the fact that the before‐mentioned review found that the effects on glycaemic control were less strong with lower baseline values of glycaemia and longer trial duration. A decrease of 0.07 mmol/L for fasting plasma glucose and a decrease of 0.53 mmol/L for post‐load glucose does not seem to fully explain the decrease in T2DM diabetes incidence we found. This would suggest that AGI do in fact target the underlying pathophysiology.
Most trials in the Cochrane Review studied post‐load glucose with an oral glucose tolerance test (OGTT) (ABC 2017; DAISI 2008; Kawamori 2009; Koyasu 2010; STOP‐NIDDM 2002; Yun 2016). Acarbose has no direct effects on an OGTT as alpha‐glucosidase inhibitors only delay the breakdown of complex polysaccharides (and not monosaccharides such as glucose). In this light the decreasing effect of acarbose on a 2‐hour OGTT is positive because it indicates a beneficial effect on insulin resistance.
Another argument in the question whether an effect of AGI on the incidence of T2DM is relevant or important, is the desirability of a drug intervention in people at high risk for T2DM. It is well recognised that the increase in the number of people with T2DM is due to 'lifestyle' factors such as a shortage of exercise and an unhealthy diet. Focusing on drugs as the solution of the problem may distract people from the issues that are truly important: eat less and exercise more (Hemmingsen 2017a; Hopper 2011).
Finally the question arises whether true (primary), prevention of T2DM with a single drug is possible at all. T2DM is a complex disease in which many pathophysiological mechanisms are involved (for example insulin sensitivity and blood pressure regulation). Only when one predominant mechanism was identified, would primary prevention by a drug targeting this mechanism be feasible. Currently, it seems unlikely that this will be the case for T2DM in the near future. In the meanwhile, drug interventions for IGT should be regarded as secondary or tertiary prevention.
Decrease in incidence of cardiovascular disease
The observed beneficial effects on the occurrence of cardiovascular morbidity (STOP‐NIDDM 2002) are interesting. However, these results should be interpreted with great prudence. This is underlined by the study authors, who sensibly stated that because effects on cardiovascular morbidity were secondary objectives and the number of events was relatively small, they should be seen as hypothesis‐generating (Chiasson 2004 under STOP‐NIDDM 2002).
Critics mentioned the skewed discontinuation rate as another explanation for the observed effects, rather than an effect of acarbose (Sawicki 2004). Because more participants in the acarbose group stopped taking their medication (mostly due to adverse effects), the participants in the acarbose group were not followed up as regularly as the participants in the placebo group and could have had therefore less chance to be 'detected' in case a cardiovascular event had taken place. We reanalysed the data accounting for differences in follow‐up rate and found that the odds ratios for the occurrence of any cardiovascular event became less strong, but remained statistically significant.
Another explanation could be in the existence of (unknown) confounding factors. The cost‐effectiveness subtrial of STOP‐NIDDM 2002 (Quilici 2005), reported clues for differences in treatment groups. They determined baseline risk profiles with a formula for the identification of high risk for T2DM (Stern 2002), or cardiovascular risk (Anderson 1991). Based on these risk scores, they stated that "... more placebo patients than acarbose‐treated patients were represented in the high‐risk subgroups...". Therefore, participants in the placebo group could have had a higher a‐priori risk than participants in the acarbose group.
The other trials that looked at cardiovascular mortality and morbidity found no beneficial effect of AGI. The trials looking at acarbose used a lower dose than STOP‐NIDDM 2002 (50 mg three times daily and 100 mg three times daily, respectively), which might indicate a dose‐response relationship. The authors of ACE 2017 also mentioned that their population was on average younger than the STOP‐NIDDM 2002 population and that there was a difference in ethnicity. ACE 2017, which included participants with coronary heart disease, recommended more aggressive, secondary cardiovascular prevention measures, which might explain the difference in effect found in ACE 2017 compared to STOP‐NIDDM 2002, which excluded participants with a recent cardiovascular event.
ABC 2017 included participants with clinically overt myocardial infarction, and found no beneficial effect for voglibose in reducing cardiovascular mortality and morbidity. In fact, the HR leaned towards no intervention being more beneficial. Interestingly, the voglibose group had a considerably larger portion of people using anti‐platelet therapy at baseline than the control group (417 (96.5%) and 382 (92.5%) respectively). This could mean the voglibose group was better protected against cardiovascular events than the control group. On the other hand, it might also mean that the control group had more morbidity at baseline and thus a higher risk.
Several trials included participants with a history of cardiovascular disease (ABC 2017; ACE 2017; Yun 2016; Koyasu 2010). These participants were therefore at a higher baseline risk for cardiovascular events compared to the trials that included participants with no such history. We still believe these trials to be comparable, because, despite baseline differences, the effect of AGI on cardiovascular events should be the same.
As none of the trials included in this review, besides STOP‐NIDDM 2002, showed any benefit of AGI in the prevention of either cardiovascular mortality or morbidity, we conclude that there is no proof that AGI are effective in preventing cardiovascular disease, cardiovascular mortality or both.
Effects on incidence of hypertension
In one trial the authors reported a beneficial effect on the incidence of new cases of hypertension (STOP‐NIDDM 2002). It is remarkable that at baseline almost half of all participants were already diagnosed with hypertension (acarbose 357/682, placebo 345/686), but these participants were kept in the analysis for the development of hypertension.
We could not confirm the beneficial effects on hypertension observed in STOP‐NIDDM 2002, in which hypertension was studied as a clinical outcome (blood pressure greater than 140/90 mmHg on two or more occasions). Instead we studied the differences in diastolic and systolic blood pressure. These outcomes yielded an effect of acarbose compared to no intervention on systolic blood pressure (−4 mmHg, 95% CI −7 to −1) (Fang 2004; Koyasu 2010; Yun 2016), no clear effects of AGI compared to placebo (ACE 2017; STOP‐NIDDM 2002), and a detrimental effect of acarbose compared to metformin in one trial (6 mmHg, 95% CI 3 to 9) (Fang 2004).
Strengths and limitations of the review
One of the main strengths of this review is the rigorousness and completeness of the search. Second, the a priori decision to only include randomised trials with a duration of at least one year ensured a 'minimum level' of quality. Third, we assessed many different outcomes in the review, which enables the readers to judge by themselves what matters most for their own particular question. Finally, we think that the tables and figures and the extensive provision of all outcome data and information related to quality and heterogeneity, make the review transparent.
One of the limitations is the missing data from EDIT 1997. Regrettably, the trial authors are not willing to share their data before their trial is published. They have kindly promised their help once their manuscripts are accepted for publication, but the analysis of the data still needs to be completed. It is regrettable that this important trial has not been published yet (August 2018). This points to a possible time lag bias: a kind of reporting bias in which trials may be published rapidly or delayed depending on the nature and direction of the results. Of course we will use upcoming data from this trial. Another limitation is the external validity of the results. For some trials, the recruitment of the participants was not clearly described (EDIT 1997; Fang 2004; Wang 2000). It is important to know how selection took place in order to be able to generalise the results to other clinical settings. For example, were the participants volunteers recruited with a newspaper advertisement (and thus highly motivated), or were they recruited from the files of general practitioners (and maybe less motivated)? Further, we only found two trials with voglibose as the AGI. Whether the results may be extrapolated to miglitol depends on the existence of a possible group effect for AGI. The data from the voglibose trials seem in line with the acarbose data, but more trials would be needed to determine whether a group effect exists. The Cochrane Review on AGI for T2DM, obtained comparable results for acarbose and miglitol for most outcomes (Van de Laar 2005). Another limitation is that the included trials focused on participants with IGT, which means the results of the meta‐analysis cannot simply be applied to people with IFG or elevated HbA1c. A further limitation is that in the comparison of acarbose and placebo, there were outcomes where ACE 2017 contributed most weight. These outcomes were incidence of T2DM, serious adverse events, cardiovascular mortality and congestive heart failure. Moreover, we did not perform the subgroup and sensitivity analyses that we had planned to do. This was due to the relatively large heterogeneity between the included trials. There were not enough trials with the same intervention and control group to further divide these into subgroups. Lastly, there was considerable heterogeneity in some of the meta‐analyses (2hPG, body weight, and BMI in the acarbose versus placebo group comparison, and FPG, 2hPG, HbA1c, and diastolic blood pressure in the acarbose versus no intervention comparison). The heterogeneity for FPG and 2hPG in the acarbose versus no‐intervention group comparison might be explained by an inadequate randomisation in Fang 2004, which meant that the acarbose group had a considerably higher baseline 2hPG than the no‐intervention group. It is unclear what exactly caused the heterogeneity in the other analyses.
A point of concern could be that due to changing cut‐off thresholds, the diagnostic criteria for intermediate hyperglycaemia varied among trials. In 1985, the WHO criteria for IGT were a fasting plasma glucose of more than 7.8 mmol/L and a 2hPG of 7.8 to 11.1 mmol/L (WHO 1985). In 1998, the FPG limit was lowered to 7.0 mmol/L (WHO 1998). The cut‐off levels for post‐load glucose were quite similar among trials (7.8 to 11.1 mmol/L for 2hPG), with the exception of DAISI 2008, where the trialists used 8.6 mmol/L as the lower limit. But with respect to FPG, the older trials used 7.7 mmol/L or 7.8 mmol/L as the upper limit (DAISI 2008; EDIT 1997; Fang 2004; STOP‐NIDDM 2002; Wang 2000), and the more recent trials used either 6.9 mmol/L or 7.0 mmol/L as the upper limit (ABC 2017; ACE 2017; Kawamori 2009; Koyasu 2010). The one exception is Yun 2016, which used a FPG of 6.1 mmol/L as the upper limit. Consequently, it is likely that some older trials will have included participants that nowadays would be categorised as having T2DM. We think that this will have a negligible effect on generalisability because there is no clear border between 'prediabetes' and diabetes, and the number of participants involved is limited. Namely, the average baseline FPG value in DAISI 2008 was 6.5 mmol/L for the control group and 6.6 mmol/L for the intervention group; in Fang 2004 the baseline FPG value was 6.5 mmol/L in the acarbose group, 5.7 mmol/L in the no‐intervention group, 6.3 mmol/L in the metformin group and 5.6 mmol/L in the diet and exercise group; in EDIT 1997 the baseline FPG value was 6.0 mmol/L in both groups; and for STOP‐NIDDM 2002 it was 6.2 mmol/L in both groups, which means the average baseline FPG values are below the current cut‐off value of 7.0 mmol/L for the diagnosis of T2DM. The baseline FPG values for one trial were not available (Wang 2000).
It is also worth mentioning that we were unable to find the information in trials registers for a surprising number of trials (Fang 2004; Yun 2016). Consequently, we were not able to determine if any changes to the protocol had been made during these trials.
Quality of the evidence
For the comparison of acarbose with placebo the main reason for downgrading the certainty of the evidence of outcomes detailed in the summary of findings Table for the main comparison was imprecision, usually because of the small number of trials, CIs consistent with benefit and harm or both. This also holds true for the comparison of voglibose with placebo.
For the single small trial evaluating acarbose with metformin, the single small trial on acarbose as well the single larger trial on voglibose, all compared to diet, exercise or both, we downgraded the certainty of the evidence for all reported outcomes, mainly due to imprecision.
Lastly, for the comparison of acarbose with no intervention, we downgraded the certainty of the evidence of outcomes detailed in summary of findings Table 2, again mainly due to imprecision, because of the small number of participants and events, and the small number of trials.
Most evidence was of either low or very low quality and should be interpreted accordingly.
Potential biases in the review process
In updating this review, we adhered to the original protocol. A point of potential bias could be that four trials included participants who had established cardiovascular morbidity at the time of randomisation (ABC 2017; ACE 2017; Koyasu 2010; Yun 2016). In clinical practice, 'prediabetes' is often diagnosed following a cardiovascular event. As such, these participants are the target group for this intervention and are therefore included in this review alongside the participants without cardiovascular morbidity. We planned to perform a subgroup analysis with the trials that included participants with established cardiovascular morbidity, but due to the low number of trials and the variability in control groups between these trials, this was not possible.
Agreements and disagreements with other studies or reviews
A systematic review that looked at the effectiveness of behaviour‐changing, pharmacological and surgical interventions in preventing T2DM also found that AGI were effective in preventing T2DM, but other interventions were more effective (namely glipizide and diet combined with pioglitazone) (Stevens 2015). Another systematic review studied the effects of behaviour‐changing and pharmacological interventions in preventing cardiovascular events in people with 'prediabetes'. It found that both pharmacological and behaviour‐changing interventions were beneficial in preventing T2DM (RR 0.66, 95% CI 0.55 to 0.80), though behaviour‐changing interventions were more effective than pharmacological interventions (RR 0.52, 95% CI 0.46 to 0.58 versus RR 0.70, 0.58 to 0.85 respectively). However, neither was beneficial in reducing cardiovascular mortality, all‐cause mortality and myocardial infarction. The only outcome pharmacological interventions might prevent according to this review were fatal and non‐fatal strokes (RR 0.76, CI 0.58 to 0.99; Hopper 2011).
A recent Cochrane Review on the effects of diet, physical activity or both in people at increased risk of T2DM found that a combination of diet and physical activity reduced the incidence of T2DM compared to standard or no treatment (RR 0.57, 95% CI 0.50 to 0.64; Hemmingsen 2017a).
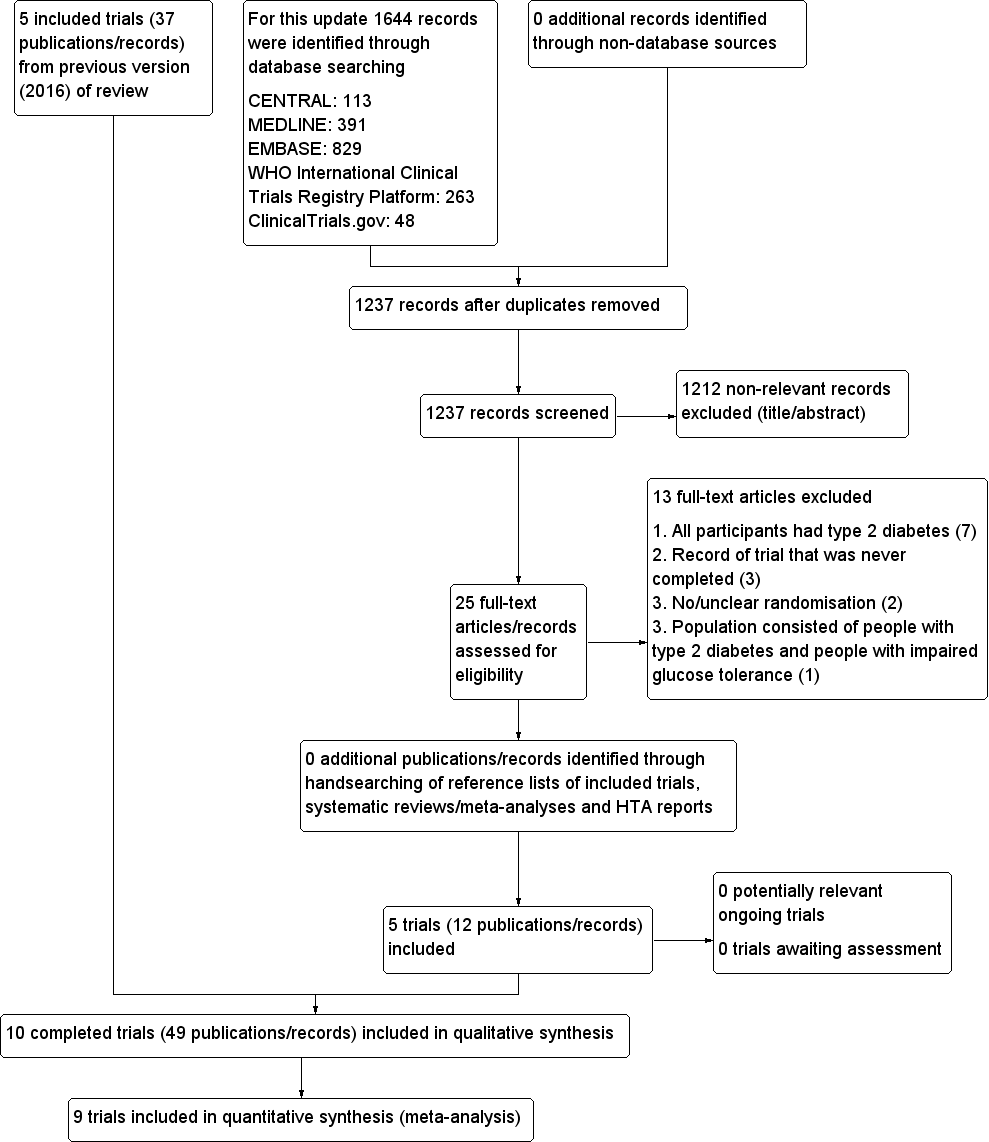
Trial flow diagram
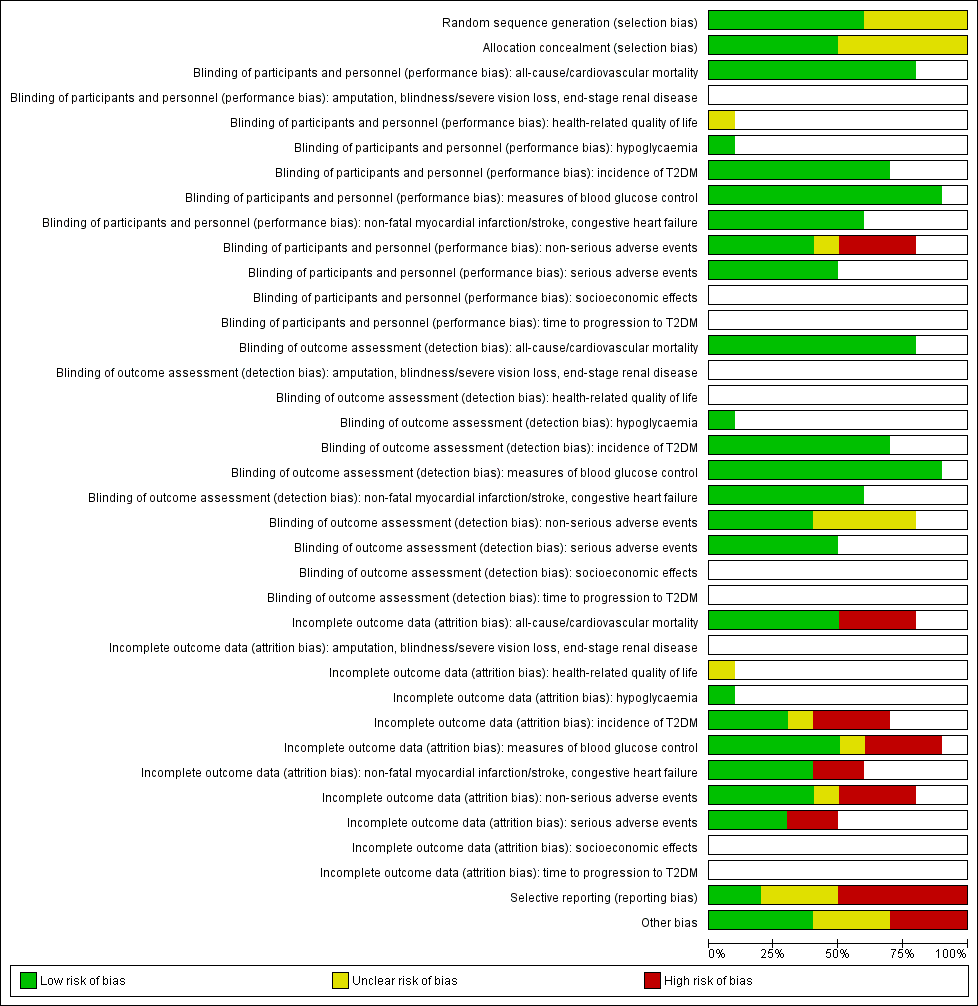
Risk of bias graph: review authors' judgements about each risk of bias item presented as percentages across all included trials (blank cells indicate that the particular outcome was not measured in some trials).
T2DM: type 2 diabetes mellitus

Risk of bias summary: review authors' judgements about each risk of bias item for each included trial (blank cells indicate that the particular outcome was not measured in some trials)
ABC: Alpha‐glucosidase‐inhiT2DM: type 2 diabetes mellitus
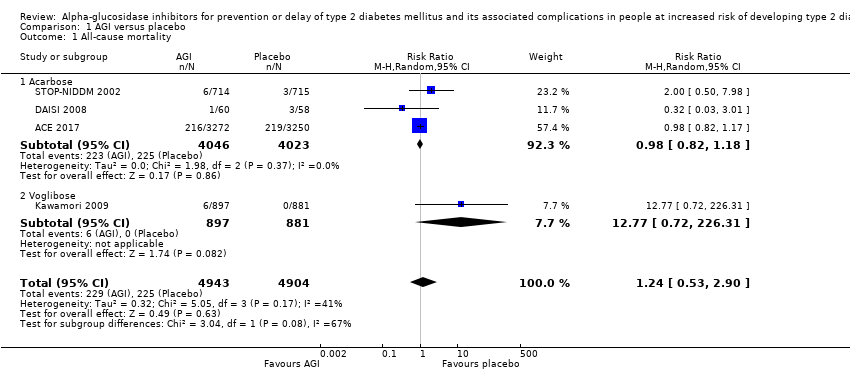
Comparison 1 AGI versus placebo, Outcome 1 All‐cause mortality.
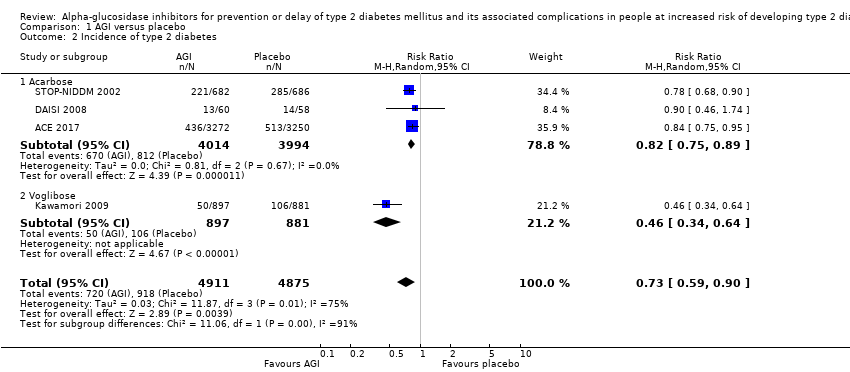
Comparison 1 AGI versus placebo, Outcome 2 Incidence of type 2 diabetes.

Comparison 1 AGI versus placebo, Outcome 3 Serious adverse events.
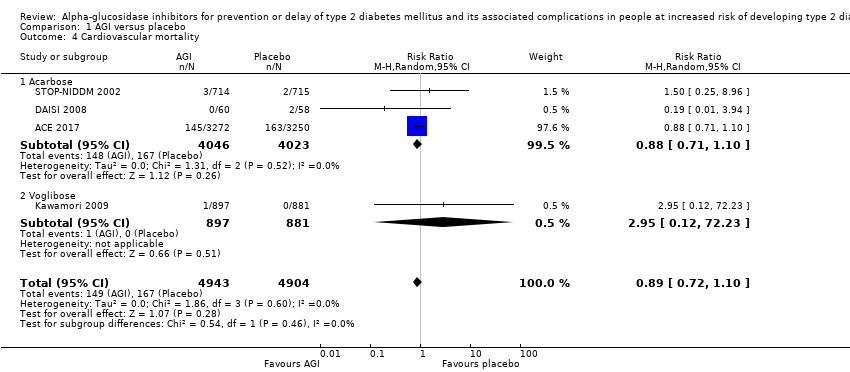
Comparison 1 AGI versus placebo, Outcome 4 Cardiovascular mortality.

Comparison 1 AGI versus placebo, Outcome 5 Non‐fatal myocardial infarction.

Comparison 1 AGI versus placebo, Outcome 6 Non‐fatal stroke.
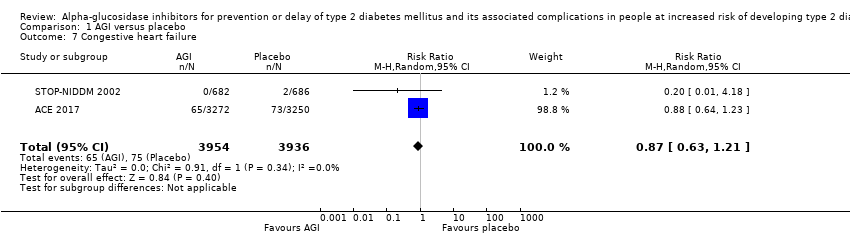
Comparison 1 AGI versus placebo, Outcome 7 Congestive heart failure.

Comparison 1 AGI versus placebo, Outcome 8 Non‐serious adverse events.
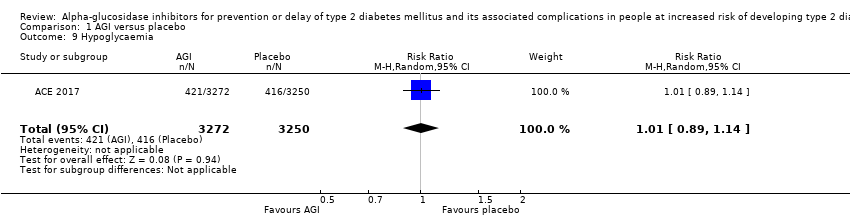
Comparison 1 AGI versus placebo, Outcome 9 Hypoglycaemia.
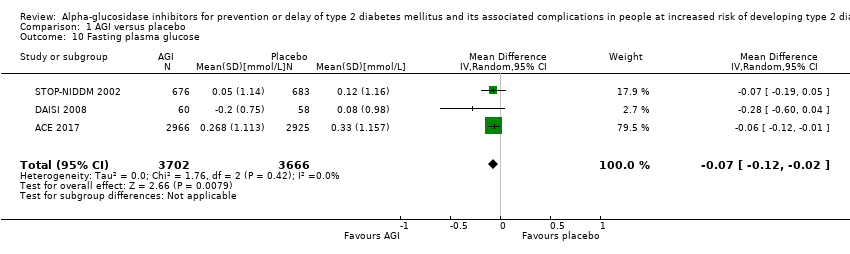
Comparison 1 AGI versus placebo, Outcome 10 Fasting plasma glucose.

Comparison 1 AGI versus placebo, Outcome 11 2‐h glucose measurements.
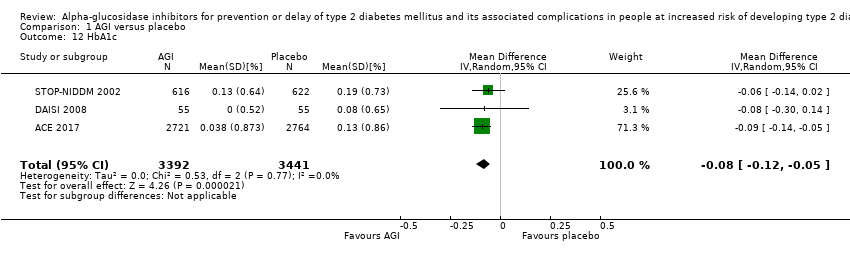
Comparison 1 AGI versus placebo, Outcome 12 HbA1c.

Comparison 1 AGI versus placebo, Outcome 13 Change in total cholesterol.

Comparison 1 AGI versus placebo, Outcome 14 Change in HDL‐cholesterol.
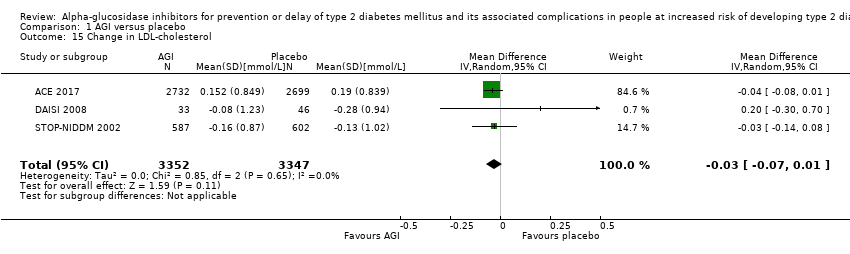
Comparison 1 AGI versus placebo, Outcome 15 Change in LDL‐cholesterol.

Comparison 1 AGI versus placebo, Outcome 16 Change in triglycerides.
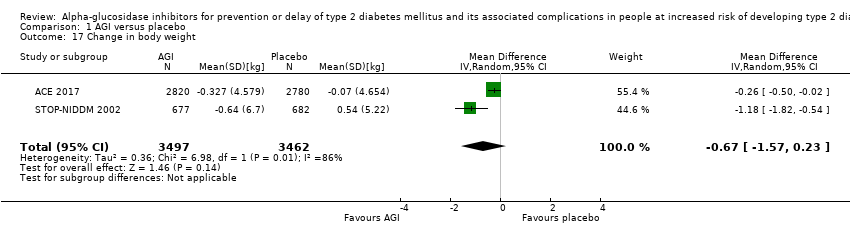
Comparison 1 AGI versus placebo, Outcome 17 Change in body weight.
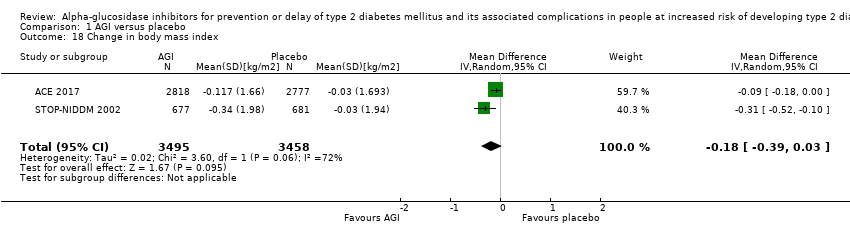
Comparison 1 AGI versus placebo, Outcome 18 Change in body mass index.
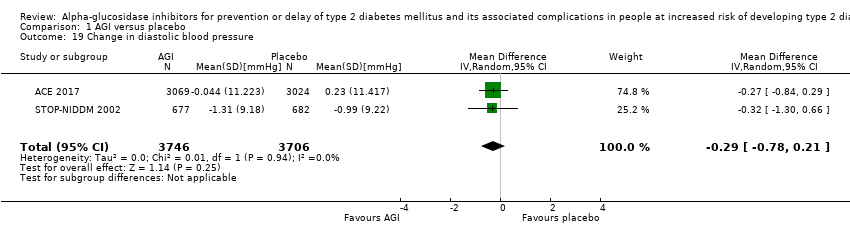
Comparison 1 AGI versus placebo, Outcome 19 Change in diastolic blood pressure.

Comparison 1 AGI versus placebo, Outcome 20 Change in systolic blood pressure.

Comparison 2 AGI versus metformin, Outcome 1 All‐cause mortality.

Comparison 2 AGI versus metformin, Outcome 2 Incidence of type 2 diabetes.

Comparison 2 AGI versus metformin, Outcome 3 Fasting plasma glucose.

Comparison 2 AGI versus metformin, Outcome 4 2‐h glucose measurements.

Comparison 2 AGI versus metformin, Outcome 5 Change in total cholesterol.
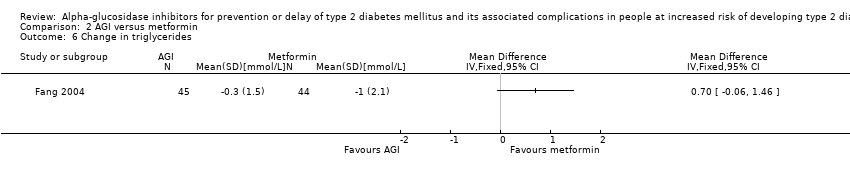
Comparison 2 AGI versus metformin, Outcome 6 Change in triglycerides.

Comparison 2 AGI versus metformin, Outcome 7 Change in body mass index.
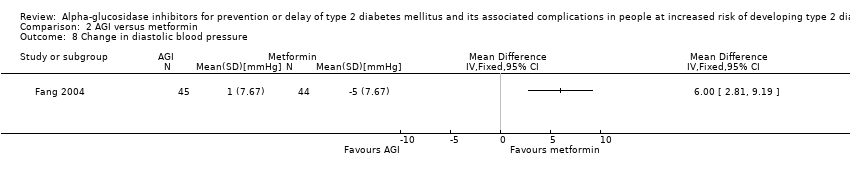
Comparison 2 AGI versus metformin, Outcome 8 Change in diastolic blood pressure.

Comparison 2 AGI versus metformin, Outcome 9 Change in systolic blood pressure.
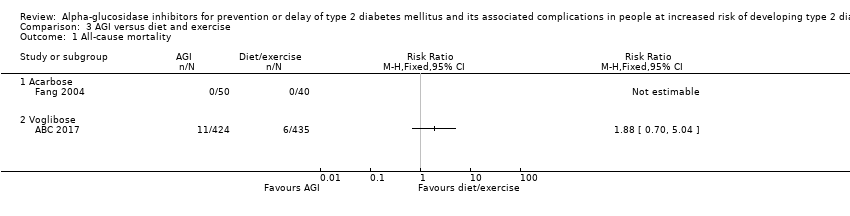
Comparison 3 AGI versus diet and exercise, Outcome 1 All‐cause mortality.

Comparison 3 AGI versus diet and exercise, Outcome 2 Incidence of type 2 diabetes.
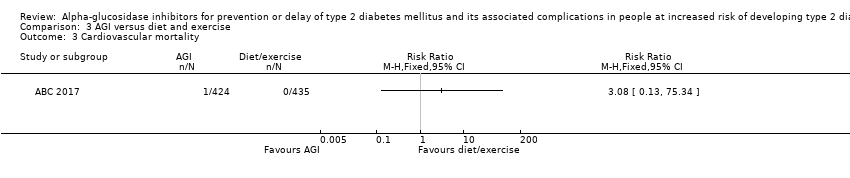
Comparison 3 AGI versus diet and exercise, Outcome 3 Cardiovascular mortality.

Comparison 3 AGI versus diet and exercise, Outcome 4 Non‐fatal myocardial infarction.

Comparison 3 AGI versus diet and exercise, Outcome 5 Non‐fatal stroke.

Comparison 3 AGI versus diet and exercise, Outcome 6 Congestive heart failure.

Comparison 3 AGI versus diet and exercise, Outcome 7 Non‐serious adverse events.
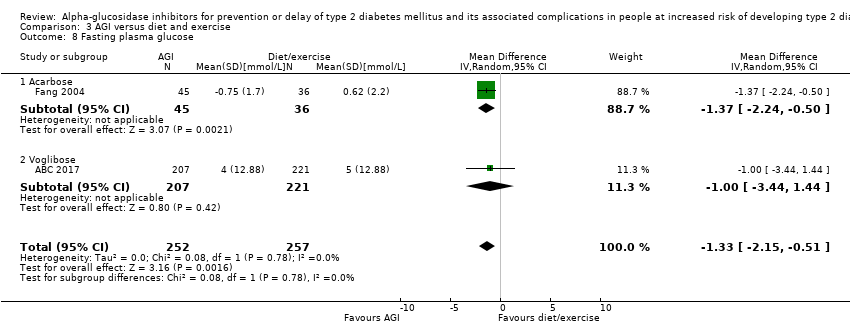
Comparison 3 AGI versus diet and exercise, Outcome 8 Fasting plasma glucose.

Comparison 3 AGI versus diet and exercise, Outcome 9 2‐h glucose measurements.

Comparison 3 AGI versus diet and exercise, Outcome 10 HbA1c.

Comparison 3 AGI versus diet and exercise, Outcome 11 Change in total cholesterol.

Comparison 3 AGI versus diet and exercise, Outcome 12 Change in triglycerides.
![Comparison 3 AGI versus diet and exercise, Outcome 13 Change in HDL‐cholesterol [mmol/L].](/es/cdsr/doi/10.1002/14651858.CD005061.pub3/media/CDSR/CD005061/image_n/nCD005061-CMP-003-13.png)
Comparison 3 AGI versus diet and exercise, Outcome 13 Change in HDL‐cholesterol [mmol/L].
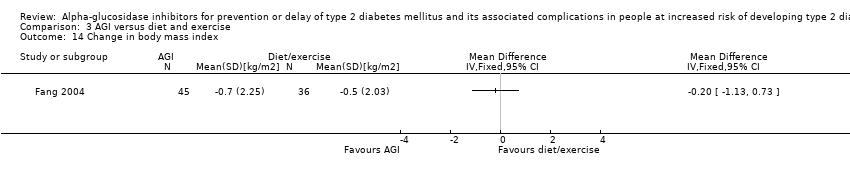
Comparison 3 AGI versus diet and exercise, Outcome 14 Change in body mass index.

Comparison 3 AGI versus diet and exercise, Outcome 15 Change in diastolic blood pressure.

Comparison 3 AGI versus diet and exercise, Outcome 16 Change in systolic blood pressure.

Comparison 4 AGI versus no intervention, Outcome 1 All‐cause mortality.
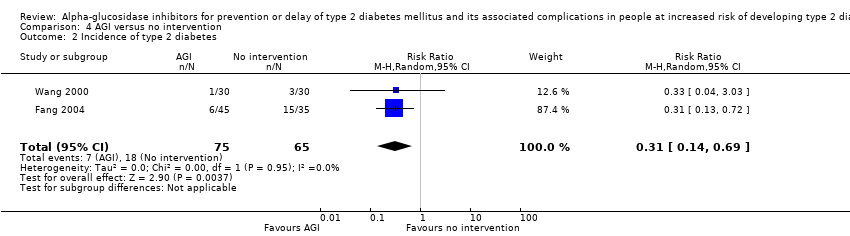
Comparison 4 AGI versus no intervention, Outcome 2 Incidence of type 2 diabetes.

Comparison 4 AGI versus no intervention, Outcome 3 Cardiovascular mortality.

Comparison 4 AGI versus no intervention, Outcome 4 Non‐fatal myocardial infarction.

Comparison 4 AGI versus no intervention, Outcome 5 Non‐fatal stroke.
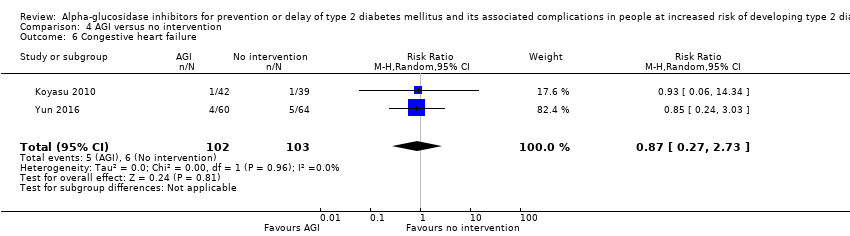
Comparison 4 AGI versus no intervention, Outcome 6 Congestive heart failure.

Comparison 4 AGI versus no intervention, Outcome 7 Non‐serious adverse events.
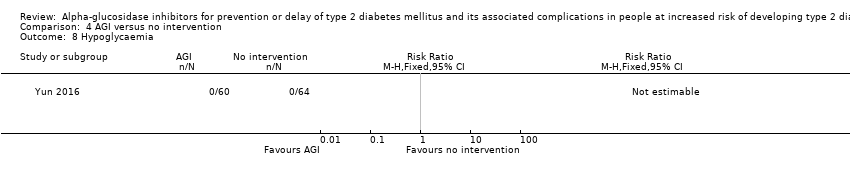
Comparison 4 AGI versus no intervention, Outcome 8 Hypoglycaemia.

Comparison 4 AGI versus no intervention, Outcome 9 Fasting plasma glucose.

Comparison 4 AGI versus no intervention, Outcome 10 2‐h glucose measurements.

Comparison 4 AGI versus no intervention, Outcome 11 HbA1c.
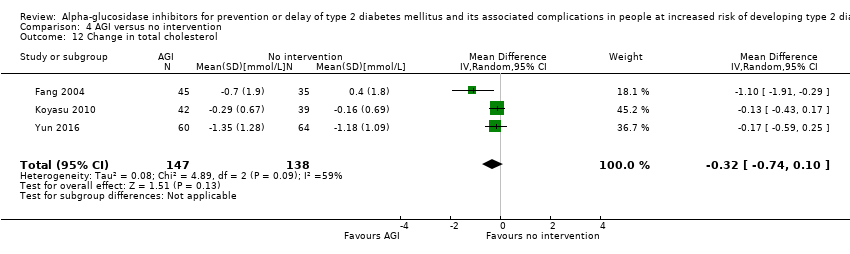
Comparison 4 AGI versus no intervention, Outcome 12 Change in total cholesterol.

Comparison 4 AGI versus no intervention, Outcome 13 Change in HDL‐cholesterol.

Comparison 4 AGI versus no intervention, Outcome 14 Change in LDL‐cholesterol.
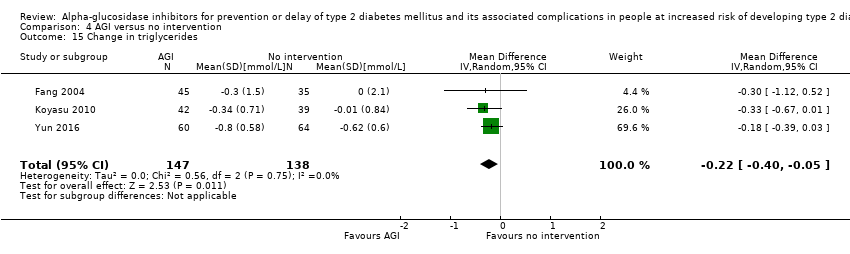
Comparison 4 AGI versus no intervention, Outcome 15 Change in triglycerides.
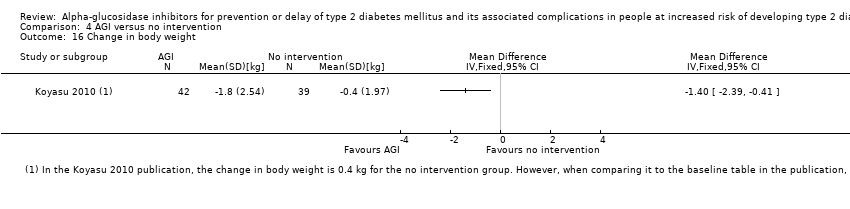
Comparison 4 AGI versus no intervention, Outcome 16 Change in body weight.
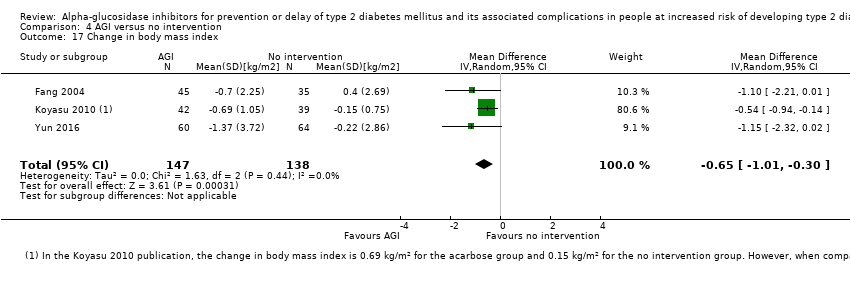
Comparison 4 AGI versus no intervention, Outcome 17 Change in body mass index.

Comparison 4 AGI versus no intervention, Outcome 18 Change in diastolic blood pressure.
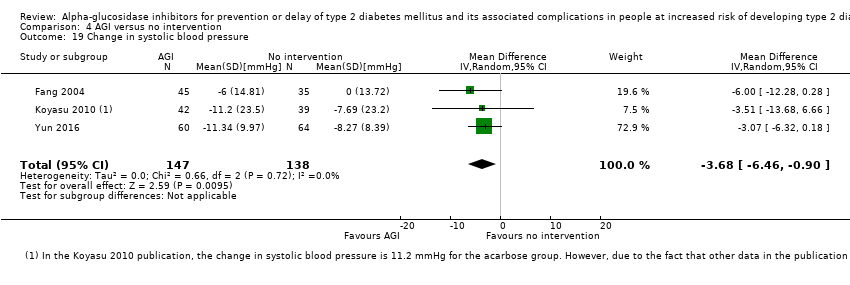
Comparison 4 AGI versus no intervention, Outcome 19 Change in systolic blood pressure.
| Acarbose for prevention or delay of type 2 diabetes mellitus and its associated complications in people at risk of developing of type 2 diabetes mellitus | ||||||
| Population: people at risk of developing type 2 diabetes mellitus Settings: outpatients Intervention: alpha‐glucosidase inhibitors (acarbose) Comparison: placebo | ||||||
| Outcomes | Placebo | Acarbose | Relative effect | Number of participants Trials | Certainty of the evidence | Comments |
| All‐cause mortality Follow‐up: 3‐5 years | 56 per 1000 | 55 per 1000 (44 to 66) | RR 0.98 (0.82 to 1.18) | 8069 3 RCTs | ⊕⊝⊝⊝ | ‐ |
| Incidence of T2DM Follow‐up: 3‐5 years Definition of intermediate hyperglycaemia (definition of T2DM incidence): ACE 2017: FPG < 7.0 mmol/L; 2hPG ≥ 7.8 ‐ < 11.1 mmol/L (FPG ≥7.0 mmol/L; 2hPG ≥ 11.1 mmol/L) | 203 per 1000 | 167 per 1000 (152 to 181) | RR 0.82 (0.75 to 0.89) (95% prediction interval: 0.48 to 1.40) | 8008 3 RCTs | ⊕⊕⊕⊝ | ACE 2017 included participants with coronary heart disease and contributed 64.0% of cases |
| Serious adverse events Follow‐up: 3.3‐5 years | 95 per 1000 | 106 per 1000 (92 to 122) | RR 1.12 (0.97 to 1.29) | 6625 2 RCTs | ⊕⊕⊝⊝ | ‐ |
| Cardiovascular mortality Follow‐up: 3.3‐5 years | 42 per 1000 | 37 per 1000 (29 to 46) | RR 0.88 (0.71 to 1.10) | 8069 3 RCTs | ⊕⊝⊝⊝ | ‐ |
| (a)Non‐fatal myocardial infarction (b)Non‐fatal stroke (c)Congestive heart failure Follow‐up: 3.3 years | (a) 20 per 1000 (b) 6 per 1000 (c) 19 per 1000 | (a) 1 per 1000 (0 to 11) (b) 3 per 1000 (1 to 16) (c) 16 per 1000 (12 to 21) | (a) RR 0.10 (0.02 to 0.53) (b) RR 0.50 (0.09 to 2.74) (c) RR 0.87 (0.63 to 1.12) | (a) 1486 2 RCTs (b) 1368 1 RCT (c) 7890 2 RCTs | (a) ⊕⊝⊝⊝ Very lowd (c) ⊕⊕⊝⊝ | ‐ |
| Health‐related quality of life | Not reported | |||||
| Socioeconomic effects | Not reported | |||||
| *The basis for the assumed risk (e.g. the median control group risk across trials) is provided in footnotes. The corresponding risk (and its 95% confidence interval) is based on the assumed risk in the comparison group and the relative effect of the intervention (and its 95% CI). 2hPG: 2‐hour plasma glucose; CI: confidence interval; FPG: fasting plasma glucose;HbA1c: glycosylated haemoglobin A1c; IGT: impaired glucose tolerance; RCT: randomised controlled trial; RR: risk ratio; T2DM: type 2 diabetes mellitus | ||||||
| GRADE Working Group grades of evidence | ||||||
| aDowngraded by one level because of inconsistency in direction of effect and by two levels because of serious imprecision (confidence interval consistent with benefit and harm and small number of trials). See Appendix 17. | ||||||
| Acarbose for prevention or delay of type 2 diabetes mellitus and its associated complications in people at risk of developing type 2 diabetes mellitus | ||||||
| Population: people at risk of developing type 2 diabetes mellitus Settings: outpatients Intervention: alpha‐glucosidase inhibitors (acarbose) Comparison: no intervention | ||||||
| Outcomes | No intervention | Acarbose | Relative effect | Number of participants Trials | Certainty of the evidence | Comments |
| All‐cause mortality Follow‐up: 1‐5 years | See comment | 171 2 RCTs | ⊕⊝⊝⊝ | 2 of 4 trials reported mortality. No deaths occurred. | ||
| Incidence of T2DM Follow‐up: 1‐5 years Definition of intermediate hyperglycaemia (definition of T2DM incidence): Fang 2004 and Wang 2000: FPG < 7.8 mmol/L; 2hPG ≥ 7.8 ≤ 11.1 mmol/L (FPG ≥ 7.8 mmol/L; 2hPG ≥ 11.1 mmol/L) | 277 per 1000 | 86 per 1000 (39 to 191) | RR 0.31 (0.14 to 0.69) | 140 2 RCTs | ⊕⊝⊝⊝ | ‐ |
| Serious adverse events | Not reported | |||||
| Cardiovascular mortality Follow‐up: 1‐4.5 years | 49 per 1000 | 31 per 1000 (8 to 124) | RR 0.64 (0.16 to 2.56) | 205 2 RCTs | ⊕⊝⊝⊝ | ‐ |
| (a)Non‐fatal myocardial infarction (b)Non‐fatal stroke (c)Congestive heart failure Follow‐up: 1‐4.5 years | (a) 68 per 1000 (b) 39 per 1000 (c) 58 per 1000 | (a) 20 per 1000 (5 to 96) (b) 21 per 1000 (4 to 109) (c) 51per 1000 (16 to 159) | (a) RR 0.30 (0.07 to 1.41) (b) RR 0.53 (0.10 to 2.81) (c) RR 0.87 (0.27 to 2.73) | (a) 205 2 RCTs (b) 205 2 RCTs (c) 205 2 RCTs | (a) ⊕⊝⊝⊝ Very lowc (c) ⊕⊝⊝⊝ | ‐ |
| Health‐related quality of life | Not reported | |||||
| Socioeconomic effects | Not reported | |||||
| *The basis for the assumed risk (e.g. the median control group risk across trials) is provided in footnotes. The corresponding risk (and its 95% confidence interval) is based on the assumed risk in the comparison group and the relative effect of the intervention (and its 95% CI). | ||||||
| GRADE Working Group grades of evidence | ||||||
| aDowngraded by one level because of risk of bias (unclear selection bias and selective reporting), and by two levels because of serious imprecision (small number of trials, small sample size and the outcome not being a common event). See Appendix 18. | ||||||
| Trial ID | Intervention(s) and comparator(s) | Short description of power and sample size calculation | Screened/eligible | Randomised | ITT | Analysed | Finishing trial | Randomised finishing trial | Follow‐up |
| ABC 2017 (parallel RCT) | Intervention 1: voglibose | "Given a hazard ratio (HR) of 0.717 with survival rates of 89% at 24 months in the control group, we estimated the total sample size of 3000 subjects along with 325 events (1500 per group), providing 85% power of one‐sided log‐rank test of 2.5% significance level to detect the assumed reduction, assuming the loss of patients during the follow‐up to be 15%" | ‐/870 | 428 | 424 | 424 | 424 | 99.1 | 2 years |
| Comparator 1: diet and exercise | 442 | 435 | 435 | 435 | 98.4 | ||||
| total: | 870 | 859 | 859 | 859 | 98.7 | ||||
| ACE 2017(parallel RCT) | Intervention 1: acarbose | "7268 patients were required with 904 adjudicated primary composite cardiovascular end points to achieve 90% power. The population size was reduced from 7500 to 6500, with an estimated 728 confirmed composite primary outcome required to have at least 85% power to detect a 20% risk reduction for acarbose, compared with placebo (two‐sided α=0·05)" | 15204/7671 | 3272 | 3272 | 3272 | 3092 | 94.5 | Median of 5 years |
| Comparator 1: placebo | 3250 | 3250 | 3250 | 3064 | 94.3 | ||||
| total: | 6522 | 6522 | 6522 | 6156 | 94.3 | ||||
| Yun 2016(parallel RCT) | Intervention 1: acarbose | ‐ | 426/135 | 67 | ‐ | 60 | 60 | 89.55 | 1‐4.5 years |
| Comparator 1: no intervention | 68 | ‐ | 64 | 64 | 94.12 | ||||
| total: | 135 | ‐ | 124 | 124 | 91.85 | ||||
| Koyasu 2010(parallel RCT) | Intervention 1: acarbose | ‐ | ‐/90 | 45 | ‐ | 42 | 42 | 93.33 | 1 year |
| Comparator 1: no intervention | 45 | ‐ | 39 | 39 | 86.67 | ||||
| total: | 90 | ‐ | 81 | 81 | 90 | ||||
| Kawamori 2009(parallel RCT) | Intervention 1: voglibose | "Assuming a conversion rate of 7.7% per year, a study duration of 4.9 years, and a drop‐out rate of 5%, the planned sample size was 864 (90% power to detect a 40% reduction in the primary endpoint with a two‐sided type I error of 0·05). Due to greater improvement to normoglycaemia than expected, sample size increased to 1728" | 4582/1780 | 897 | ‐ | 897 | 768 | 85.62 | Until diagnosis of normoglycaemia or diabetes type 2, or at least 3 years |
| Comparator 1: placebo | 883 | ‐ | 881 | 737 | 83.47 | ||||
| total: | 1780 | ‐ | 1778 | 1505 | 84.55 | ||||
| Fang 2004(parallel RCT) | Intervention 1: acarbose | ‐ | ‐/‐ | 50 | ‐ | 45 | 45 | 90 | 5 years |
| Comparator 1: no intervention | 40 | ‐ | 35 | 35 | 87.5 | ||||
| Comparator 2: metformin | 48 | ‐ | 44 | 44 | 91.67 | ||||
| Comparator 3: diet and exercise | 40 | ‐ | 36 | 36 | 90 | ||||
| total: | 178 | ‐ | 160 | 160 | 89.89 | ||||
| Wang 2000(parallel RCT) | Intervention 1: acarbose | ‐ | ‐/61 | 31 | ‐ | 30 | 30 | 96.77 | 1 year |
| Comparator 1: No intervention | 30 | ‐ | 30 | 30 | 100 | ||||
| total: | 61 | ‐ | 60 | 60 | 98.36 | ||||
| DAISI 2008(parallel RCT) | Intervention 1: acarbose | 47 participants in each treatment group with alpha (2‐sided) = 0.05 and beta = 0.05 | 6651/118 | 60 | 60 | 60 | 30 | 50 | 3 years |
| Comparator 1: placebo | p8 | 58 | 58 | 36 | 62.07 | ||||
| total: | 118 | 118 | 118 | 66 | 55.93 | ||||
| EDIT 1997(factorial RCT) | Intervention 1: acarbose + placebo | ‐ | ‐/631 | 157 | ‐ | ‐ | ‐ | ‐ | 6 years |
| Comparator 1: placebo + placebo | 159 | ‐ | ‐ | ‐ | ‐ | ||||
| Comparator 2: metformin + placebo | 160 | ‐ | ‐ | ‐ | ‐ | ||||
| Comparator 3: metformin + acarbose | 155 | ‐ | ‐ | ‐ | ‐ | ||||
| total: | 631 | ‐ | ‐ | 522 | 82.73 | ||||
| STOP‐NIDDM 2002(parallel RCT) | Intervention 1: acarbose | "It was estimated that 600 patients would be required in each treatment group for a 2‐tailed alpha of .05 and a 1‐beta of 90% assuming a conversion rate of 7% per year, a 36% risk reduction, and a drop‐out rate of 10%" | 14742/1429 | 714 | 682 | 682 | 471 | 65.97 | mean 3.3 years |
| Comparator 1: placebo | 715 | 686 | 686 | 556 | 77.76 | ||||
| total: | 1429 | 1368 | 1368 | 1027 | 71.87 | ||||
| Grand total | All interventions | 5721 | 4962 (excl. EDIT 1997) | ||||||
| All comparators | 6093 | 5076 (excl. EDIT 1997) | |||||||
| All interventions and comparators | 11,814 | 10,038 (excl. EDIT 1997) 10,560 (incl. EDIT 1997) | |||||||
| ‐ denotes not reported; ITT: intention‐to‐treat; RCT: randomised controlled trial aFollow‐up under randomised conditions until end of trial ( (= duration of intervention + follow‐up post‐intervention or identical to duration of intervention); extended follow‐up refers to follow‐up of participants once the original trial was terminated as specified in the power calculation. | |||||||||
| Outcome or subgroup title | No. of studies | No. of participants | Statistical method | Effect size |
| 1 All‐cause mortality Show forest plot | 4 | 9847 | Risk Ratio (M‐H, Random, 95% CI) | 1.24 [0.53, 2.90] |
| 1.1 Acarbose | 3 | 8069 | Risk Ratio (M‐H, Random, 95% CI) | 0.98 [0.82, 1.18] |
| 1.2 Voglibose | 1 | 1778 | Risk Ratio (M‐H, Random, 95% CI) | 12.77 [0.72, 226.31] |
| 2 Incidence of type 2 diabetes Show forest plot | 4 | 9786 | Risk Ratio (M‐H, Random, 95% CI) | 0.73 [0.59, 0.90] |
| 2.1 Acarbose | 3 | 8008 | Risk Ratio (M‐H, Random, 95% CI) | 0.82 [0.75, 0.89] |
| 2.2 Voglibose | 1 | 1778 | Risk Ratio (M‐H, Random, 95% CI) | 0.46 [0.34, 0.64] |
| 3 Serious adverse events Show forest plot | 3 | 8403 | Risk Ratio (M‐H, Random, 95% CI) | 1.12 [0.97, 1.30] |
| 3.1 Acarbose | 2 | 6625 | Risk Ratio (M‐H, Random, 95% CI) | 1.12 [0.97, 1.29] |
| 3.2 Voglibose | 1 | 1778 | Risk Ratio (M‐H, Random, 95% CI) | 2.46 [0.48, 12.62] |
| 4 Cardiovascular mortality Show forest plot | 4 | 9847 | Risk Ratio (M‐H, Random, 95% CI) | 0.89 [0.72, 1.10] |
| 4.1 Acarbose | 3 | 8069 | Risk Ratio (M‐H, Random, 95% CI) | 0.88 [0.71, 1.10] |
| 4.2 Voglibose | 1 | 1778 | Risk Ratio (M‐H, Random, 95% CI) | 2.95 [0.12, 72.23] |
| 5 Non‐fatal myocardial infarction Show forest plot | 2 | 1486 | Risk Ratio (M‐H, Random, 95% CI) | 0.10 [0.02, 0.53] |
| 6 Non‐fatal stroke Show forest plot | 1 | 1368 | Risk Ratio (M‐H, Random, 95% CI) | 0.50 [0.09, 2.74] |
| 7 Congestive heart failure Show forest plot | 2 | 7890 | Risk Ratio (M‐H, Random, 95% CI) | 0.87 [0.63, 1.21] |
| 8 Non‐serious adverse events Show forest plot | 3 | 3328 | Risk Ratio (M‐H, Random, 95% CI) | 1.04 [1.02, 1.06] |
| 8.1 Acarbose | 2 | 1550 | Risk Ratio (M‐H, Random, 95% CI) | 1.04 [1.01, 1.06] |
| 8.2 Voglibose | 1 | 1778 | Risk Ratio (M‐H, Random, 95% CI) | 1.06 [1.02, 1.10] |
| 9 Hypoglycaemia Show forest plot | 1 | 6522 | Risk Ratio (M‐H, Random, 95% CI) | 1.01 [0.89, 1.14] |
| 10 Fasting plasma glucose Show forest plot | 3 | 7368 | Mean Difference (IV, Random, 95% CI) | ‐0.07 [‐0.12, ‐0.02] |
| 11 2‐h glucose measurements Show forest plot | 3 | 6498 | Mean Difference (IV, Random, 95% CI) | ‐0.53 [‐0.92, ‐0.14] |
| 12 HbA1c Show forest plot | 3 | 6833 | Mean Difference (IV, Random, 95% CI) | ‐0.08 [‐0.12, ‐0.05] |
| 13 Change in total cholesterol Show forest plot | 3 | 6815 | Mean Difference (IV, Random, 95% CI) | ‐0.05 [‐0.10, 0.00] |
| 14 Change in HDL‐cholesterol Show forest plot | 3 | 6807 | Mean Difference (IV, Random, 95% CI) | 0.01 [‐0.00, 0.03] |
| 15 Change in LDL‐cholesterol Show forest plot | 3 | 6699 | Mean Difference (IV, Random, 95% CI) | ‐0.03 [‐0.07, 0.01] |
| 16 Change in triglycerides Show forest plot | 3 | 6843 | Mean Difference (IV, Random, 95% CI) | ‐0.07 [‐0.17, 0.03] |
| 17 Change in body weight Show forest plot | 2 | 6959 | Mean Difference (IV, Random, 95% CI) | ‐0.67 [‐1.57, 0.23] |
| 18 Change in body mass index Show forest plot | 2 | 6953 | Mean Difference (IV, Random, 95% CI) | ‐0.18 [‐0.39, 0.03] |
| 19 Change in diastolic blood pressure Show forest plot | 2 | 7452 | Mean Difference (IV, Random, 95% CI) | ‐0.29 [‐0.78, 0.21] |
| 20 Change in systolic blood pressure Show forest plot | 2 | 7452 | Mean Difference (IV, Random, 95% CI) | ‐0.47 [‐1.26, 0.32] |
| Outcome or subgroup title | No. of studies | No. of participants | Statistical method | Effect size |
| 1 All‐cause mortality Show forest plot | 1 | Risk Ratio (M‐H, Fixed, 95% CI) | Totals not selected | |
| 2 Incidence of type 2 diabetes Show forest plot | 1 | Risk Ratio (M‐H, Fixed, 95% CI) | Totals not selected | |
| 3 Fasting plasma glucose Show forest plot | 1 | Mean Difference (IV, Fixed, 95% CI) | Totals not selected | |
| 4 2‐h glucose measurements Show forest plot | 1 | Mean Difference (IV, Fixed, 95% CI) | Totals not selected | |
| 5 Change in total cholesterol Show forest plot | 1 | Mean Difference (IV, Fixed, 95% CI) | Totals not selected | |
| 6 Change in triglycerides Show forest plot | 1 | Mean Difference (IV, Fixed, 95% CI) | Totals not selected | |
| 7 Change in body mass index Show forest plot | 1 | Mean Difference (IV, Fixed, 95% CI) | Totals not selected | |
| 8 Change in diastolic blood pressure Show forest plot | 1 | Mean Difference (IV, Fixed, 95% CI) | Totals not selected | |
| 9 Change in systolic blood pressure Show forest plot | 1 | Mean Difference (IV, Fixed, 95% CI) | Totals not selected | |
| Outcome or subgroup title | No. of studies | No. of participants | Statistical method | Effect size |
| 1 All‐cause mortality Show forest plot | 2 | Risk Ratio (M‐H, Fixed, 95% CI) | Totals not selected | |
| 1.1 Acarbose | 1 | Risk Ratio (M‐H, Fixed, 95% CI) | 0.0 [0.0, 0.0] | |
| 1.2 Voglibose | 1 | Risk Ratio (M‐H, Fixed, 95% CI) | 0.0 [0.0, 0.0] | |
| 2 Incidence of type 2 diabetes Show forest plot | 1 | Risk Ratio (M‐H, Fixed, 95% CI) | Totals not selected | |
| 3 Cardiovascular mortality Show forest plot | 1 | Risk Ratio (M‐H, Fixed, 95% CI) | Totals not selected | |
| 4 Non‐fatal myocardial infarction Show forest plot | 1 | Risk Ratio (M‐H, Fixed, 95% CI) | Totals not selected | |
| 5 Non‐fatal stroke Show forest plot | 1 | Risk Ratio (M‐H, Fixed, 95% CI) | Totals not selected | |
| 6 Congestive heart failure Show forest plot | 1 | Risk Ratio (M‐H, Fixed, 95% CI) | Totals not selected | |
| 7 Non‐serious adverse events Show forest plot | 1 | Risk Ratio (M‐H, Fixed, 95% CI) | Totals not selected | |
| 8 Fasting plasma glucose Show forest plot | 2 | 509 | Mean Difference (IV, Random, 95% CI) | ‐1.33 [‐2.15, ‐0.51] |
| 8.1 Acarbose | 1 | 81 | Mean Difference (IV, Random, 95% CI) | ‐1.37 [‐2.24, ‐0.50] |
| 8.2 Voglibose | 1 | 428 | Mean Difference (IV, Random, 95% CI) | ‐1.0 [‐3.44, 1.44] |
| 9 2‐h glucose measurements Show forest plot | 2 | 472 | Mean Difference (IV, Random, 95% CI) | ‐2.74 [‐3.74, ‐1.74] |
| 9.1 Acarbose | 1 | 81 | Mean Difference (IV, Random, 95% CI) | ‐2.79 [‐3.79, ‐1.79] |
| 9.2 Voglibose | 1 | 391 | Mean Difference (IV, Random, 95% CI) | 0.7 [‐7.53, 8.93] |
| 10 HbA1c Show forest plot | 1 | Mean Difference (IV, Fixed, 95% CI) | Totals not selected | |
| 11 Change in total cholesterol Show forest plot | 2 | 586 | Mean Difference (IV, Random, 95% CI) | ‐0.49 [‐1.32, 0.33] |
| 11.1 Acarbose | 1 | 81 | Mean Difference (IV, Random, 95% CI) | ‐0.50 [‐1.33, 0.33] |
| 11.2 Voglibose | 1 | 505 | Mean Difference (IV, Random, 95% CI) | 0.0 [‐6.47, 6.47] |
| 12 Change in triglycerides Show forest plot | 2 | 612 | Mean Difference (IV, Random, 95% CI) | ‐0.10 [‐0.76, 0.56] |
| 12.1 Acarbose | 1 | 81 | Mean Difference (IV, Random, 95% CI) | ‐0.10 [‐0.76, 0.56] |
| 12.2 Voglibose | 1 | 531 | Mean Difference (IV, Random, 95% CI) | ‐0.1 [‐17.03, 16.83] |
| 13 Change in HDL‐cholesterol [mmol/L] Show forest plot | 1 | 545 | Mean Difference (IV, Random, 95% CI) | 0.0 [‐2.51, 2.51] |
| 14 Change in body mass index Show forest plot | 1 | Mean Difference (IV, Fixed, 95% CI) | Totals not selected | |
| 15 Change in diastolic blood pressure Show forest plot | 2 | 667 | Mean Difference (IV, Random, 95% CI) | 1.25 [‐1.65, 4.15] |
| 16 Change in systolic blood pressure Show forest plot | 2 | 668 | Mean Difference (IV, Random, 95% CI) | ‐1.94 [‐8.71, 4.83] |
| 16.1 Acarbose | 1 | 81 | Mean Difference (IV, Random, 95% CI) | ‐6.00 [‐12.23, 0.23] |
| 16.2 Voglibose | 1 | 587 | Mean Difference (IV, Random, 95% CI) | 1.0 [‐1.92, 3.92] |
| Outcome or subgroup title | No. of studies | No. of participants | Statistical method | Effect size |
| 1 All‐cause mortality Show forest plot | 2 | 171 | Risk Ratio (M‐H, Random, 95% CI) | 0.0 [0.0, 0.0] |
| 2 Incidence of type 2 diabetes Show forest plot | 2 | 140 | Risk Ratio (M‐H, Random, 95% CI) | 0.31 [0.14, 0.69] |
| 3 Cardiovascular mortality Show forest plot | 2 | Risk Ratio (M‐H, Fixed, 95% CI) | Totals not selected | |
| 4 Non‐fatal myocardial infarction Show forest plot | 2 | Risk Ratio (M‐H, Fixed, 95% CI) | Subtotals only | |
| 5 Non‐fatal stroke Show forest plot | 2 | Risk Ratio (M‐H, Fixed, 95% CI) | Subtotals only | |
| 6 Congestive heart failure Show forest plot | 2 | 205 | Risk Ratio (M‐H, Random, 95% CI) | 0.87 [0.27, 2.73] |
| 7 Non‐serious adverse events Show forest plot | 1 | Risk Ratio (M‐H, Fixed, 95% CI) | Totals not selected | |
| 8 Hypoglycaemia Show forest plot | 1 | Risk Ratio (M‐H, Fixed, 95% CI) | Totals not selected | |
| 9 Fasting plasma glucose Show forest plot | 3 | 285 | Mean Difference (IV, Random, 95% CI) | ‐0.35 [‐0.79, 0.08] |
| 10 2‐h glucose measurements Show forest plot | 3 | 285 | Mean Difference (IV, Random, 95% CI) | ‐2.50 [‐4.18, ‐0.83] |
| 11 HbA1c Show forest plot | 2 | Mean Difference (IV, Random, 95% CI) | Subtotals only | |
| 12 Change in total cholesterol Show forest plot | 3 | 285 | Mean Difference (IV, Random, 95% CI) | ‐0.32 [‐0.74, 0.10] |
| 13 Change in HDL‐cholesterol Show forest plot | 1 | Mean Difference (IV, Fixed, 95% CI) | Totals not selected | |
| 14 Change in LDL‐cholesterol Show forest plot | 2 | 205 | Mean Difference (IV, Random, 95% CI) | ‐0.03 [‐0.22, 0.15] |
| 15 Change in triglycerides Show forest plot | 3 | 285 | Mean Difference (IV, Random, 95% CI) | ‐0.22 [‐0.40, ‐0.05] |
| 16 Change in body weight Show forest plot | 1 | Mean Difference (IV, Fixed, 95% CI) | Totals not selected | |
| 17 Change in body mass index Show forest plot | 3 | 285 | Mean Difference (IV, Random, 95% CI) | ‐0.65 [‐1.01, ‐0.30] |
| 18 Change in diastolic blood pressure Show forest plot | 3 | 285 | Mean Difference (IV, Random, 95% CI) | ‐0.26 [‐3.80, 3.28] |
| 19 Change in systolic blood pressure Show forest plot | 3 | 285 | Mean Difference (IV, Random, 95% CI) | ‐3.68 [‐6.46, ‐0.90] |