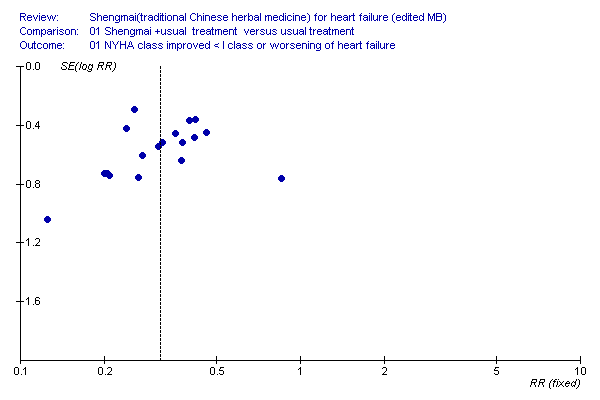
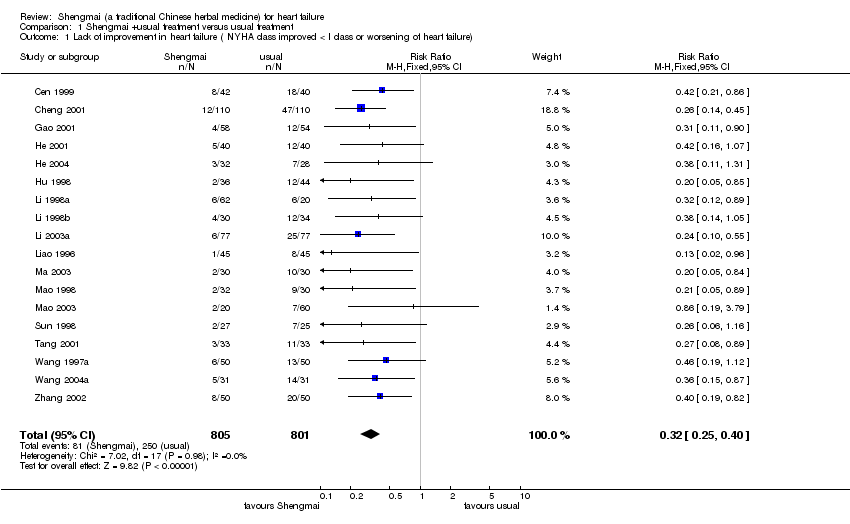
| 1 Lack of improvement in heart failure ( NYHA class improved < I class or worsening of heart failure) Show forest plot | 18 | 1606 | Risk Ratio (M‐H, Fixed, 95% CI) | 0.32 [0.25, 0.40] |
|
| 2 mortality at the end of treatment Show forest plot | 1 | | Risk Ratio (M‐H, Fixed, 95% CI) | Totals not selected |
|
| 3 cardiac output (L/min) change at 2 weeks Show forest plot | 1 | | Mean Difference (IV, Fixed, 95% CI) | Totals not selected |
|
| 4 stroke volume (ml) change at 2 weeks Show forest plot | 1 | | Mean Difference (IV, Fixed, 95% CI) | Totals not selected |
|
| 5 cardiac index change at 2 weeks Show forest plot | 1 | | Mean Difference (IV, Fixed, 95% CI) | Totals not selected |
|
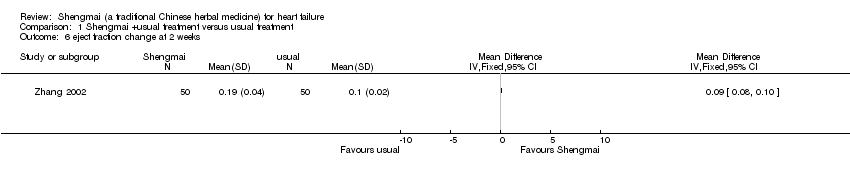
| 6 eject fraction change at 2 weeks Show forest plot | 1 | | Mean Difference (IV, Fixed, 95% CI) | Totals not selected |
|
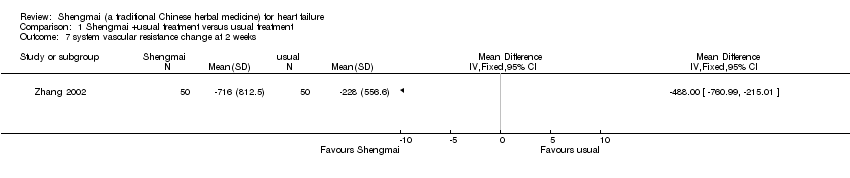
| 7 system vascular resistance change at 2 weeks Show forest plot | 1 | | Mean Difference (IV, Fixed, 95% CI) | Totals not selected |
|
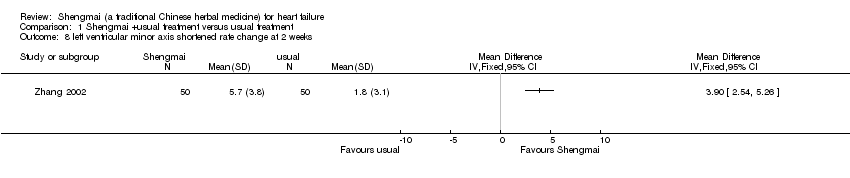
| 8 left ventricular minor axis shortened rate change at 2 weeks Show forest plot | 1 | | Mean Difference (IV, Fixed, 95% CI) | Totals not selected |
|
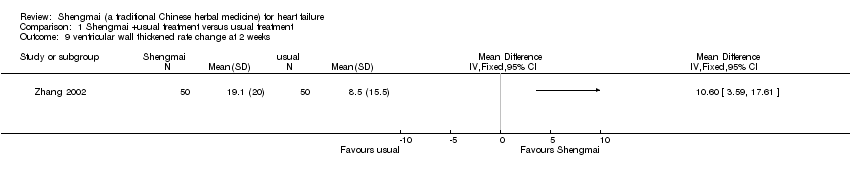
| 9 ventricular wall thickened rate change at 2 weeks Show forest plot | 1 | | Mean Difference (IV, Fixed, 95% CI) | Totals not selected |
|
| 10 Exercise time in movement tolerance test at 2 weeks Show forest plot | 1 | | Mean Difference (IV, Fixed, 95% CI) | Totals not selected |
|
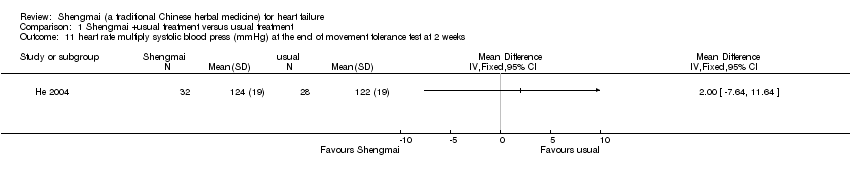
| 11 heart rate multiply systolic blood press (mmHg) at the end of movement tolerance test at 2 weeks Show forest plot | 1 | | Mean Difference (IV, Fixed, 95% CI) | Totals not selected |
|
| 12 flow mediated dilation of brachial artery volume change at 2 weeks Show forest plot | 1 | | Mean Difference (IV, Fixed, 95% CI) | Totals not selected |
|
| 13 eletrocardiogram QT dispersion change at 20 days Show forest plot | 1 | | Mean Difference (IV, Fixed, 95% CI) | Totals not selected |
|
| 14 electrocardiogram JT dispersion change at 20 days Show forest plot | 1 | | Mean Difference (IV, Fixed, 95% CI) | Totals not selected |
|
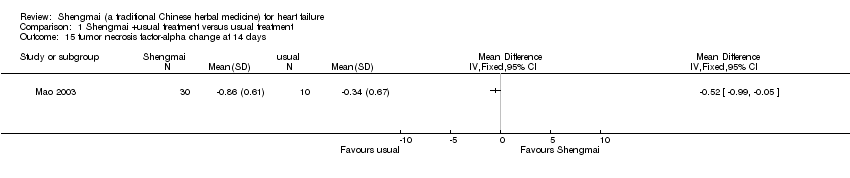
| 15 tumor necrosis factor‐alpha change at 14 days Show forest plot | 1 | | Mean Difference (IV, Fixed, 95% CI) | Totals not selected |
|
| 16 endogenous digitalis‐like factors change at 14 days Show forest plot | 1 | | Mean Difference (IV, Fixed, 95% CI) | Totals not selected |
|
| 17 Plasma P‐selectin change at 2 weeks Show forest plot | 1 | | Mean Difference (IV, Fixed, 95% CI) | Totals not selected |
|
| 18 von Willebrand's factor change at 2 weeks Show forest plot | 1 | | Mean Difference (IV, Fixed, 95% CI) | Totals not selected |
|
| 19 D‐dimer change at 2 weeks Show forest plot | 1 | | Mean Difference (IV, Fixed, 95% CI) | Totals not selected |
|
| 20 partial pressure of oxygen increase at 10 days Show forest plot | 1 | | Mean Difference (IV, Fixed, 95% CI) | Totals not selected |
|
| 21 partial pressure of carbon dioxide decrease at 10 days Show forest plot | 1 | | Mean Difference (IV, Fixed, 95% CI) | Totals not selected |
|
| 22 B‐type natriuretic peptide change at 15 days Show forest plot | 1 | | Mean Difference (IV, Fixed, 95% CI) | Totals not selected |
|