Interventions for morphea
Referencias
References to studies included in this review
References to studies excluded from this review
References to studies awaiting assessment
Additional references
References to other published versions of this review
Characteristics of studies
Characteristics of included studies [ordered by study ID]
| Methods | This was a double‐blind randomised clinical trial conducted in Tabriz, northwestern Iran. The aim of this study was to compare the effect of methotrexate and hydroxychloroquine in treatment of morphea. | |
| Participants | Inclusion criteria: presence of morphea without any signs of systemic involvement, evidence of active and expanding lesions (evidence of the spreading lesions, the appearance of new lesions or clinical signs of inflammation include erythema and warmth over the past 3 months), morphea confirmed with a histological samples from all patients before treatment, any systemic treatment with effect on morphea had to be discontinued for at least 4 weeks and topical treatments for at least 2 weeks prior to the study. Exclusion criteria: acute or chronic infection, pregnancy or childbearing potential without an acceptable method to prevent, liver disease or elevated liver enzyme levels more than twice the normal, creatinine level of more than 130 mmol, known pulmonary disease, leukocyte count less than 3500 or platelet count less than 150000, active peptic ulcer or neoplasm, insulin‐dependent diabetes mellitus, use of other anti‐folate drugs such as sulphonamides, and allopurinol and Probenesid, presence of lupus or mixed connective tissue disease (MCTD), contraindication of ophthalmology to start hydroxychloroquine. Number of participants randomised: 30 (15 group 1 + 15 group 2) Number of participants analysed: 25 (13 group 1 + 12 group 2) Women: 16 (9 group 1 + 7 group 2) Men: 9 (4 group 1 + 5 group 2) Age: mean age in group 1 was 33.7 ± 11 years (13 to 57) and 40.2 ± 15.5 years (17 to 74) in group 2. Ethnicity: Iranian Morphea Type: authors did not report this information (probably circumscribed). Length of illness: authors did not report this information. | |
| Interventions | Group 1: a. Therapy and dosage: hydroxychloroquine (200 mg twice a day) plus topical corticosteroid (authors did not mention the type or dosage). b. Administration: oral and topical c. Duration of treatment: 3 months d. Follow‐up after treatment: none Group 2: a. Therapy and dosage: methotrexate (15 mg) once a week (on Fridays) plus folic acid 1mg daily (except for Friday) and topical corticosteroid (authors did not mention the type or dosage). b. Administration: oral and topical c. Duration of treatment: 3 months d. Follow‐up after treatment: none | |
| Outcomes | The clinical score MSS, which is the numerical sum of the thickness and percentage of involvement in 7 regions of the body. Thickness and flexibility were scored from zero to 3, and the area with the most severe grade was recorded as the final grade. The extent of involvement was scored as: 0: no involvement; 1: less than 33% involvement; 2: 33% to 67% involvement; 3: more than 67% involvement. Participants also evaluated hardness and pruritus of the skin through the Visual Analogue Scale. Assessments: follow‐up at week 4,8 and 12 after initiating the treatment. | |
| Notes | Trial registration: authors registered the protocol of this study on the Iranian Registry of Clinical Trials (IRCT201110057712N2). Ethics committee approval: Tabriz University of Medical Sciences and Health Services Funding source: Tabriz University of Medical Sciences and Health Services Declarations of interest: authors did not report this information | |
| Risk of bias | ||
| Bias | Authors' judgement | Support for judgement |
| Random sequence generation (selection bias) | Low risk | The translator informed us that the authors used Randlist, a software which creates randomisation lists. Thus, the method used to generate the random sequence was considered adequate to produce comparable groups. |
| Allocation concealment (selection bias) | Unclear risk | Authors did not provide enough information to judge if participants and investigators enrolling participants could foresee assignment. |
| Blinding of participants and personnel (performance bias) | High risk | The translator informed us that the pharmacist prepared the drugs in the form of identical capsules. However, the intervention group took 1 capsule once a week whilst the control group took a capsule twice a day. Thus, the outcome is likely to be influenced by lack of blinding. |
| Blinding of outcome assessment (detection bias) | Low risk | The translator informed us that authors reported that the physician who registered the data was also blinded. Thus, the outcome assessor was effectively blinded from knowledge of which intervention a participant received. It is unlikely that the blinding could have been broken. |
| Incomplete outcome data (attrition bias) | High risk | Quote: "We studied 30 patients with localised scleroderma". Quote: "In our study, 9 (36%) of patients was male and 16 (64%) was female". Quote: "Three patients from group A withdrew due to severe side effects of MTX and two patients from group B did not return for follow‐up". Comment: authors excluded 5 participants and performed 'as treated' analysis, including data only from the participants who completed the treatment. |
| Selective reporting (reporting bias) | Low risk | Authors reported all outcomes pre‐specified in the study protocol. |
| Other bias | Unclear risk | The clinical tool used (MSS) is validated for SSc, and is inappropriate for the measurement of morphea skin involvement, which could affect the result. |
| Methods | This was a prospective, comparative, single‐centre pilot trial with intraindividual controls, conducted in England. The aim of this study was to investigate the treatment of morphea with topical photodynamic therapy (PDT) using 5‐aminolaevulinic acid (ALA). | |
| Participants | Inclusion criteria: individuals aged > 18 years, with at least 2 areas of localised morphea affecting the trunk or limbs. Exclusion criteria: authors did not report this information. Number of participants: 7 Number of lesions randomised: 14; 7 Treatment/7 Control Number of lesions analysed: 12; 6 T/6 C Women: authors did not report this information. Men: authors did not report this information. Age: authors did not report this information (only adults). Ethnicity: authors did not report this information. Morphea Type: circumscribed morphea. Length of illness: authors did not report this information. | |
| Interventions | Lesion 1: a. Therapy and dosage: 5‐ALA 20% cream, applied under occlusion for 5 hours, followed by PDT with a non‐coherent, broadband halogen light source filtered to give 570 nm to 670 nm bandwidth (full width, half maximum), peak 635 nm, to an area of 55 mm in diameter. A dose of 25 J ⁄ cm² was given at a rate of 90 mW ⁄ cm², once a week. b. Administration: topical c. Duration of treatment: 6 weeks d. Follow‐up after treatment: 6 weeks Lesion 2: a. Therapy and dosage: no treatment b. Duration of treatment: six weeks d. Follow‐up after treatment: six weeks | |
| Outcomes | Primary outcomes: improvement in the clinical score, assessing the skin as: 0 = normal skin, 1 = thickened skin, 2 = decreased ability to pinch or move the skin and 3 = skin unable to be pinched or moved (hidebound). Secondary outcomes: improvement in durometer score and histological appearances of skin biopsies, and cutaneous tolerance of the treatment. Assessments: weekly outcomes assessments for both lesions, on the same days as intervention (6 days in total) and at follow‐up. | |
| Notes | Intervention product information/details: light source was PhotoCureTM CureLight 1301; PhotoCure ASA, PO Box 55, Montebello, N‐0310, Oslo, Norway. Trial registration: this was a pilot study and authors did not mention a registered protocol. Ethics committee approval: Leeds (West) Funding source: authors did not report this information. Declarations of interest: authors declared no conflict of interest. The author list of this study was incomplete, and an erratum with the name of all authors and their affiliations was published in November 2008. | |
| Risk of bias | ||
| Bias | Authors' judgement | Support for judgement |
| Random sequence generation (selection bias) | Unclear risk | Quote: "The selection of which of the two plaques was to be treated was made randomly by a technician who performed the PDT". Comment: authors did not describe the method used to generate the random sequence in sufficient detail to allow an assessment of whether the allocation was adequate to produce comparable groups. |
| Allocation concealment (selection bias) | Unclear risk | Authors did not provide enough information to judge if participants and investigators enrolling participants could foresee assignment. |
| Blinding of participants and personnel (performance bias) | High risk | Each patient had 1 of the randomised lesions treated and the other not, thus participants and personnel had knowledge of which lesion was treated. The outcome is likely to be influenced by lack of blinding. |
| Blinding of outcome assessment (detection bias) | High risk | Quote: "Although the investigator was initially blinded to the selection of the treated lesion, this was not maintained because the treated lesion became pigmented after the initial PDT treatment". Comment: the outcome assessor had knowledge of which lesion was treated due to pigmentation after treatment, thus the blinding of outcome assessment was broken. The outcome measurement is likely to be influenced by lack of blinding. |
| Incomplete outcome data (attrition bias) | High risk | Quote: "One patient completed only three treatments of PDT then failed to attend any further appointments". Comment: authors excluded this participant and performed 'as treated' analysis, including data only from the participants who completed the treatment (6 out of 7 participants). |
| Selective reporting (reporting bias) | High risk | Authors presented durometer readings data only for treated lesions, thus there is no available comparison for this outcome. |
| Other bias | Unclear risk | The clinical tool used assessed individual lesions instead of all the lesions of the individual, which could affect the result. |
| Methods | This was a prospective, randomised, 3‐arm active comparison trial, conducted in Egypt. The aim of this study was to define the lowest effective broadband UVA dose in the treatment of morphea and SSc. | |
| Participants | Inclusion criteria: individuals complaining of cutaneous sclerosis. Exclusion criteria: authors did not report this information. Number of participants randomised: 67 participants with morphea. This study also included 17 individuals with systemic scleroderma (their abbreviation = SS), who were randomised separately from the morphea group. Number of participants analysed: 63 participants with morphea (16 group 1 + 21 group 2 + 26 group 3) Women: 43 (6 group 1 + 16 group 2 + 21 group 3) Men: 20 (10 group 1 + 5 group 2 + 5 group 3) Age: mean age in group 1 was 17.88 ± 13.00 years (3 to 47), 22.14 ± 12.90 years (6 to 51) in group 2 and 20.85 ± 14.75 years (6 to 66) in group 3. Ethnicity: 9 participants were skin type III, 37 participants were skin type IV and 17 participants were skin type V, according to Fitzpatrick’s classification. Morphea Type: 27 participants presented with circumscribed morphea (7 group 1 + 12 group 2 + 8 group 3), 12 participants presented with linear scleroderma (3 group 1 + 1 group 2 + 8 group 3) and 24 participants presented with generalised morphea (6 group 1 + 8 group 2 + 10 group 3). Length of illness: between 1 and 10 years; 20.28 ± 22.69 months (2 to 8) in group 1, 25.48 ± 33.12 months (1 to 120) in group 2 and 23.54 ± 24.46 months (1 to 120) in group 3. | |
| Interventions | Total body irradiation with different low doses of UVA (320 nm to 400 nm; broadband light source with a spectrum of 315 nm to 400 nm and a maximum at 365 nm). During therapy patients wore protective goggles and covered the genitals. Group 1: a. Therapy and dosage: 5 J/cm²/session, 3 times a week for 20 sessions. b. Administration: topical c. Duration of treatment: 7 weeks d. Follow‐up after treatment: none Group 2: a. Therapy and dosage: 10 J/cm²/session, 3 times a week for 20 sessions. b. Administration: topical c. Duration of treatment: 7 weeks d. Follow‐up after treatment: none Group 3: a. Therapy and dosage: 20 J/cm²/session, 3 times a week for 20 sessions. b. Administration: topical c. Duration of treatment: 7 weeks d. Follow‐up after treatment: none | |
| Outcomes | Inspection of the skin lesions as regards site, colour (hypo‐ or hyperpigmented), pattern of lesions (circumscribed, linear or disseminated) and palpation of the lesions for skin thickening, induration, atrophy and sclerosis were performed. The clinical response was assessed subjectively by palpation of the skin lesions for skin softening, graded as very good response (marked skin softening, almost normal skin texture), good response (moderate softening), fair response (mild softening) and poor response (no change in skin texture). Investigators assessed clinically other associated manifestations such as trophic changes, grip strength, flexion deformity, joint mobility, by evaluating each point as present (+) or absent (−) before treatment. After treatment, the criteria with (+) or present, were evaluated for an improvement, without scaling for the degree of change, and recorded as such. Participants and physicians also assessed subjectively these other manifestations. Assessments: before starting UVA therapy, every week and at the end of the study period (20 sessions). | |
| Notes | Intervention product information/details: source of UVA was a Waldmann Medizin technik UVA cabin 7001 equipped with 40 UVA lamps and PUVA 1000 cabin containing 26 lamps of Waldmann type F 85/100 W‐PUVA. Trial registration: authors did not register a protocol for this study. Ethics committee approval: a research ethics committee was not established at Cairo University. Funding source: authors declared no funding sources. Declarations of interest: authors declared no conflict of interest. | |
| Risk of bias | ||
| Bias | Authors' judgement | Support for judgement |
| Random sequence generation (selection bias) | Low risk | Quote: "Patients were randomly divided into three groups". Comment: authors did not describe the method used to generate the random sequence in sufficient detail to allow an assessment of whether the allocation was adequate to produce comparable groups. However, authors responded to our contact and informed that they generated the random sequence by shuffling envelopes. Thus the process was adequate to produce comparable groups. |
| Allocation concealment (selection bias) | Low risk | Authors did not provide enough information to judge if the intervention allocation could be foreseen before or during the recruitment of participants. However, authors responded to our contact and informed that the allocation was unsealed only on the admission to the first treatment session. |
| Blinding of participants and personnel (performance bias) | High risk | Authors did not describe blinding, but responded to our contact and confirmed there was no blinding to the knowledge of which intervention a participant received. Thus the outcome is likely to be influenced by lack of blinding. |
| Blinding of outcome assessment (detection bias) | High risk | Authors did not clearly describe whether the outcome assessors were effectively blinded from knowledge of which UVA dose each participant received. However, authors responded to our contact and informed that the outcome assessors were unblinded to the knowledge of which intervention a participant received; only the histopathological assessors were blinded. Thus, the outcome measurement of interest is likely to be influenced by lack of blinding. |
| Incomplete outcome data (attrition bias) | Low risk | Quote: "Of 67 M patients who started UVA therapy, 63 completed the study. Dropouts were not related to therapy". (M = circumscribed morphea) Quote: "Clinical data of the 63 patients were assessed". Comment: authors excluded 4 patients (without informing from which group they were) and performed 'as treated' analysis, including data only from the participants who completed the treatment. However, this probably does not represent serious threats to validity of the results. |
| Selective reporting (reporting bias) | Unclear risk | The study protocol is not available. |
| Other bias | Unclear risk | The clinical assessment was not a validated measure, which could affect the result. |
| Methods | This was a prospective, double‐blind, randomised controlled trial with 3‐arm comparisons, conducted in Mexico. The aim of this study was to evaluate the clinical effect of polymerised collagen (PC) vs. methylprednisolone (MP) in the treatment of morphea, and to determine the influence of PC on Th1, Th2, Th17 and Treg peripheral cells, and on the expression in skin of TGF‐b1, IL‐17A, IL‐22 and Foxp3+ cells. | |
| Participants | The participants were enrolled over a period of 2 years (2008 to 2010) at the Dermatologic Centre Ladislado de la Pascua. Histological, immunohistochemical and flow cytometric evaluation was conducted at the Department of Immunology and Rheumatology of the National Institute of Medical Sciences and Nutrition Salvador Zubirán. Inclusion criteria: individuals aged > 18 years with a diagnosis of morphea based on clinical findings and histological evaluation; at least 1 skin lesion; and a negative reaction to a standard forearm skin test for PC administration. This study also included 10 healthy, untreated individuals (control group) to compare subsets of CD4+ peripheral T cells. Exclusion criteria: pregnancy or breastfeeding; presence of lesions of lichen sclerosis et atrophicus; fibrosis induced by L‐tryptophan, bleomycin, vinyl to PC or its components; history of photosensitivity; use of topical steroids within the 2 months prior to the study, use of systemic corticosteroids or immunosuppressant drugs within 3 months prior to the study; concomitant chronic or malignant disease (melanoma or non‐melanoma skin cancer), any relevant abnormalities in baseline laboratory assessment at baseline, or serological evidence of Borrelia burgdorferi infection. Women of childbearing potential were required to use an acceptable means of contraception. Number of participants randomised: 31 (15 group 1 + 16 group 2) Number of participants analysed: 27 (13 group 1 + 14 group 2) Women: 25 (12 group 1 + 13 group 2) Men: 6 (3 group 1 + 3 group 2) Age: mean age was 38.6 ± 15.0 years, range 18 to 73 years (35.5 ± 14.2 in group 1, 18 to 62; 41.4 ± 15.6 in group 2, 18 to 73). Ethnicity: authors did not report this information. Morphea Type: 30 participants presented with circumscribed morphea and 1 participant in group 1 presented with linear scleroderma. Lenght of illness: 40.5 ± 37.8 months (median 24) | |
| Interventions | Group 1: a. Therapy and dosage: weekly injections of PC ranging from 0.2 mL (equivalent to 1.66 mg collagen) for a lesion of 50 mm in size, up to a maximum of 1.0 mL (8.3 mg collagen) for a lesion > 100 mm in size. b. Administration: subcutaneous (intralesional) c. Duration of treatment: 3 months d. Follow‐up after treatment: 6 months Group 2: a. Therapy and dosage: monthly subcutaneous injections of 0.1 mL methylprednisolone (MP, maximum dose of 20 mg or 5 mL ⁄ month) and weekly subcutaneous injections of 0.1 mL placebo (PVP citric ⁄ citrate buffer). b. Administration: subcutaneous (intralesional) c. Duration of treatment: 3 months d. Follow‐up after treatment: 6 months Groups 1 and 2: additional treatment was restricted to the use of emollients, but the composition was not specified. Group 3: no intervention in healthy participants (not included in the review), only a blood sample. | |
| Outcomes | Complete blood cell count, serum analyses including glucose and electrolyte measurement, and liver function tests and urinalysis. Skin appearance was assessed using a score adapted from the modified Rodnan Scoring System (mRSS), which is an aggregate skin score (0 = normal; 1 = thickened skin (able to pinch skin fold); 2 = thickened skin (unable to pinch skin fold); or 3 = unable to move skin) assessed for each of 17 areas (face, anterior chest, abdomen plus each limb (comprising upper arm, forearm, dorsum of hand, fingers, thighs, lower legs, dorsum of foot)). The maximum potential score is 51. All individual lesions of morphea were graded from 0 to 4 (0 = normal thickness; 1 = mild thickening; 2 = moderate thickening; 3 = severe thickening; 4 = extreme thickening). The total score for all the lesions was then calculated. A decrease in the adapted mRSS exceeding 35% from baseline was considered to reflect a clinically significant improvement. A biopsy site was chosen according to clinical criteria, and was required to be an indurate and inflammatory area, excluding areas with close proximity to vasculature or tendons. The biopsy was observed and also study through Immunohistochemistry to determine expression of IL‐17A, IL‐22, TGF‐b1 and Foxp3. A sample (10 mL) of venous blood was obtained from each subject and a single blood sample was also collected from each of the 10 healthy controls. Peripheral blood mononuclear cells (PBMCs) were obtained by gradient centrifugation. Treatment safety was determined by the occurrence of systemic and local adverse events (AEs) related to administration of the study drug. Safety monitoring included records of vital signs and clinical laboratory tests (blood chemistry, urinalysis and liver function tests). Assessments: laboratory exams were performed at baseline, at the end of treatment and at the last follow‐up visit. At each subsequent visit, efficacy evaluations were conducted and AEs recorded before the scheduled administration of the study medication. Participants attended for follow‐up every 4 weeks for 6 months after the end of the treatment period. | |
| Notes | Trial registration: authors did not register a protocol for this study. Ethics committee approval: from both institutions, the National Institute of Medical Sciences and Nutrition Salvador Zubirán and the Dermatologic Centre Ladislado de la Pascua. Funding source: authors did not report this information. However, authors responded to our contact and informed there was no funding or grant. Declarations of interest: authors declared no conflict of interest. | |
| Risk of bias | ||
| Bias | Authors' judgement | Support for judgement |
| Random sequence generation (selection bias) | Low risk | Quote: "Patients were allocated using random number generation and block randomisation to two parallel groups, to receive either PC or steroid". Comment: the method used to generate the random sequence was adequate to produce comparable groups. |
| Allocation concealment (selection bias) | Low risk | Authors did not provide enough information to judge if the intervention allocation could be foreseen before or during the recruitment of participants. However, authors responded to our contact and reported using sealed envelopes to conceal the assignment. |
| Blinding of participants and personnel (performance bias) | Low risk | Quote: "Both researchers and patients were blinded to the study preparations and had no access to them". Quote: "The placebo experimental preparation was visually identical, and its viscosity was very similar to PC". Comment: participants and personnel were effectively blinded from knowledge of which intervention a participant received. It is unlikely that the blinding could have been broken. |
| Blinding of outcome assessment (detection bias) | Low risk | Quote: "All patients were assessed before and after treatment by two dermatologists blinded to the treatment groups". Comment: outcome assessors were effectively blinded from knowledge of which intervention a participant received. It is unlikely that the blinding could have been broken. |
| Incomplete outcome data (attrition bias) | Low risk | Quote: "For the primary analysis, the means of the scores were compared between the two treatment groups on an intention‐to‐treat (ITT) basis (all patients who received a dose of study medication and had at least one efficacy observation recorded after treatment)". Quote: "In total, 13 patients (87%) in the PC group and 14 (88%) in the MP group completed the study, and were valid for ITT analysis" Comment: authors performed ITT analysis. In addition, authors reported no numerical data for adverse events, but responded to our contact and provided them. |
| Selective reporting (reporting bias) | Unclear risk | The study protocol is not available. |
| Other bias | Unclear risk | Authors reported the baseline mean clinical score for all participants, but responded to our contact and provided this data for each group (no statistical difference). However, the clinical tool used (adapted mRSS) assessed individual lesions instead of all the lesions of the individual, which could affect the result. |
| Methods | This was a randomised, double‐blind, placebo‐controlled trial conducted at the Leiden University Medical Center, in the Netherlands. The aim of this study was to assess the therapeutic effect and possible side effects of calcitriol in morphea and SSc. | |
| Participants | Inclusion criteria: participants diagnosed with morphea (localised or generalised) or SSc according to the criteria in the literature. Exclusion criteria: use of any systemic or topical therapy for morphea less than 1 month before the start of the study; use of medications (such as calcium, vitamin D, vitamin D metabolites and analogues, multivitamin preparations containing vitamin D, calcium‐containing antacids, digitalis, thiazide diuretics, and D‐penicillamine) that are likely to interfere with the assessment of safety, tolerance, or efficacy of the test drug; any clinically relevant abnormalities in the laboratory assessment at baseline; and serologic evidence of Borrelia burgdorferi infection. Women with childbearing potential had to commit themselves to adequate contraception. Number of participants randomised: 20 participants with morphea (10 group 1 + 10 group 2). This study also included 7 individuals with SSc, who were randomised separately from the morphea group. Number of participants analysed: 20 participants with morphea (10 group 1 + 10 group 2) Women: 19 (10 group 1 + 9 group 2) Men: 1 (group 2) Age: mean age in group 1 was 41.8 ± 19.1 years (17 to 72) and 55.5 ± 14.6 years (30 to 76) in group 2. Ethnicity: authors did not report this information. Morphea Type: circumscribed and generalised morphea Length of illness: 2.3 ± 1.5 years (0.15 to 4.9) in group 1 and 2.6 ± 1.9 years (0.37 to 5.6) in group 2. | |
| Interventions | Group 1: a. Therapy and dosage: 0.75 μg calcitriol once a day for 6 months, followed by 1.25 μg calcitriol once a day for 3 months. b. Administration: single oral dose just before bedtime. Dietary calcium intake was moderated with assistance of a dietician. c. Duration of treatment: 9 months d. Follow‐up after treatment: 6 months Group 2: a. Therapy and dosage: placebo (composition not specified) once a day for 9 months. b. Administration: single oral dose just before bedtime. Dietary calcium intake was moderated with assistance of a dietician. c. Duration of treatment: 9 months d. Follow‐up after treatment: 6 months | |
| Outcomes | A semi‐quantitative measure of cutaneous involvement (skin score) in which the body is divided into 22 regions and the degree of skin involvement in each region is quantified as follows: 0 = normal; 1 = mild thickening; 2 = moderate thickening; and 3 = hidebound skin. At examination the highest possible semi‐quantitative skin score in an individual region is recorded. The maximum possible skin score is 66 units. Plus, measurement of serum markers of collagen synthesis and degradation; the aminoterminal propeptide of type III procollagen (PIIINP); the carboxyterminal propeptide of type I procollagen (PICP); and the cross‐linked telopeptide of type I collagen (ICTP). Monitoring of side effects included: a) measurement of serum values of calcium, albumin, phosphate, and creatinine; b) 48‐hour urinary calcium/creatinine ratio; c) serum calcitriol (1,25[OH]2D3); and d) serum parathyroid hormone. Assessments: the participants were seen by 2 dermatologists at baseline and follow‐up visits: 1 dermatologist was the skin scores assessor, and the other informed the patients about laboratory values, medication, etc. Follow‐up visits were scheduled at every month for 9 months and then at 12 and 15 months. Skin score was interpreted at baseline, 3, 6, 9, 12, and 15 months. Serum markers measured at baseline and at 9 months. Side effects monitoring included the following measurements: serum values of calcium, albumin, phosphate, and creatinine monthly; 48‐hour urinary calcium/creatinine ratio monthly; serum calcitriol (1,25[OH]2D3) | |
| Notes | Trial registration: authors did not mention a registered protocol. Ethics committee approval: Leiden University Medical Center. Fundind source: Roche Nederland BV, Mijdrecht, provided calcitriol. Declarations of interest: authors did not report this information. | |
| Risk of bias | ||
| Bias | Authors' judgement | Support for judgement |
| Random sequence generation (selection bias) | Low risk | Quote: "Participants who enrolled in the study were stratified according to the diagnoses morphea or SSc. The pharmaceutical chemist provided randomisation lists, with the patients grouped in blocks of 6 to ensure that the two groups were balanced within the strata". Comment: the method used to generate the random sequence was adequate to produce comparable groups. |
| Allocation concealment (selection bias) | Unclear risk | Authors did not provide enough information to judge if the intervention allocation could be foreseen before or during the recruitment of participants. |
| Blinding of participants and personnel (performance bias) | Low risk | Quote: "The pharmaceutical chemist of the LUMC provided placebo and arranged calcitriol and placebo in a blinded fashion". Comment: Participants and personnel were effectively blinded from knowledge of which intervention a participant received. It is unlikely that the blinding could have been broken. |
| Blinding of outcome assessment (detection bias) | Low risk | Quote: "The pharmaceutical chemist of the LUMC provided placebo and arranged calcitriol and placebo in a blinded fashion". Comment: Outcome assessors were effectively blinded from knowledge of which intervention a participant received. It is unlikely that the blinding could have been broken. |
| Incomplete outcome data (attrition bias) | Low risk | Quote: "We analysed all assessable patients, including the patients who did not complete the 15‐month protocol, and used the last available data for the intent‐to‐treat analysis." Quote: "Three patients with morphea (1 receiving calcitriol and 2 receiving placebo) withdrew because of noncompliance, that is, they failed to present for outpatient monitoring after 3, 4, and 10 months of treatment, respectively. One patient with morphea receiving calcitriol withdrew after 13 months for personal reasons. The patients mentioned above, however, were included for analysis". Comment: Authors performed ITT analysis. |
| Selective reporting (reporting bias) | Unclear risk | The study protocol is not available. |
| Other bias | Unclear risk | The clinical tool used is validated for SSc, and is inappropriate for the measurement of morphea skin involvement, which could affect the result. |
| Methods | This was a double‐blind, randomised, placebo‐controlled, multi‐centre trial conducted in Germany. The aim of this study was to investigate the potential of interferon gamma (IFN‐γ) as an anti‐fibrotic agent in the treatment of morphea. | |
| Participants | Inclusion criteria: all participants had evidence of progressive disease, that is, lesions showed evidence of an inflammatory reaction (lilac ring) and increase in size. Exclusion criteria: serologic evidence of Borrelia burgdorferi infection. Number of patients randomised: authors did not report this information. Number of participants analysed: 24 (authors did not report the number of participants in each group). Women: 14 Men: 10 Age: median age was 50 years in group 1, and 49.8 years in group 2. Ethnicity: authors did not report this information. Morphea Type: circumscribed morphea. Length of illness: 12 months (median) | |
| Interventions | Group 1: a. Therapy and dosage: 100 µg IFN‐γ in the periphery of 1 defined lesion on 5 consecutive days during the first 2 weeks and once a week for an additional 4 weeks. b. Administration: subcutaneous (intralesional). c. Duration of treatment: 6 weeks d. Follow‐up after treatment: 18 weeks Group 2: a. Therapy and dosage: placebo (0.9% sodium chloride) in the periphery of 1 defined lesion on 5 consecutive days during the first 2 weeks and once a week for an additional 4 weeks. b. Administration: subcutaneous (intralesional). c. Duration of treatment: 6 weeks d. Follow‐up after treatment 18 weeks | |
| Outcomes | The unit of analysis was the individual, and the morphea lesion. Primary outcomes: changes of skin score, lesion size, and the appearance of new lesions. The skin score of the marker lesion was determined according to the following scale: 0 = normal, 1 = mild thickening, 2 = moderate thickening, 3 = severe thickening or hidebound skin. Assessment of the size of the lesions was achieved by covering it with a plastic sheet and marking the circumference. In a subset of patients (6 treated with IFN‐γ, 7 receiving placebo), lesion size before and after therapy was assessed by a computer‐aided scanning program calculating the surface area in square centimetres. In addition, it was noted whether new scleroderma lesions appeared during the study period in each patient. Secondary outcomes: to determine whether improvement could be related to an altered level of collagen messenger RNA (mRNA), biopsy specimens were obtained before the beginning of the study (week 0) from involved and uninvolved skin and at week 6 from involved skin only, for RNA extraction and dot blot analysis. Laboratory studies included a complete blood cell count, platelet count, determination of liver enzyme and creatinine levels, urinalysis, and antinuclear antibody titre. Assessments: lesion score was compared before and after therapy. Lesion size was compared at weeks 0 (baseline), 6, and 24 by overlaying the plastic sheets obtained at the different time points. Laboratory studies were performed before the study and at weeks 2, 6, and 24. | |
| Notes | Trial registration: authors did not mention a registered protocol. Ethics committee approval: University of Cologne. Funding source: The Bundesministerium fur Forschung und Technologie cooperative study "Lymphokine". Declarations of interest: authors did not report this information. Some parameters of this trial remain unknown because authors reported only the total number of participants and no information regarding the number of participants in each group. | |
| Risk of bias | ||
| Bias | Authors' judgement | Support for judgement |
| Random sequence generation (selection bias) | Unclear risk | Quote: "After randomisation patients received..." Comment: authors have not described the method used to generate the random sequence in sufficient detail to allow an assessment of whether the allocation was adequate to produce comparable groups. |
| Allocation concealment (selection bias) | Unclear risk | Authors have not provided enough information to assess if the allocation sequence could have been foreseen in advance of, or during the enrolment of participants. |
| Blinding of participants and personnel (performance bias) | Unclear risk | Authors described this study as double‐blind. However, authors did not provide enough information to assess if participants and personnel were effectively blinded from knowledge of which intervention a participant received. |
| Blinding of outcome assessment (detection bias) | Unclear risk | Authors did not provide enough information to assess if the outcome assessors were effectively blinded from knowledge of which intervention a participant received. |
| Incomplete outcome data (attrition bias) | High risk | Quote: "Two patients withdrew from the study, one patient receiving IFN‐γ because of dizziness and dyspnoea after four weeks, and one patient in the placebo group from lack of compliance after six weeks". Comment: it is unclear whether authors included these participants in the analysis or performed 'as treated' analysis. |
| Selective reporting (reporting bias) | High risk | Authors reported only the total number of participants and no information regarding the number of participants randomised and the number of participants in each group. Authors also reported no numerical outcome data. |
| Other bias | Unclear risk | The clinical tool used assessed individual lesions instead of all the lesions of the individual, which could affect the result |
| Methods | This was a prospective, randomised, 3‐arm comparison trial with active controls, conducted at a German university hospital. The aim of this study was to compare the safety and efficacy of low‐band (LD) UVA1, medium‐band (MD) UVA1, and narrowband (NB) UVB phototherapy in the treatment of morphea. | |
| Participants | Participants were recruited from dermatologic outpatient clinics from 2004 to 2005. Inclusion criteria: diagnosis of morphea established according to accepted clinical and histopathologic features, plus signs of active disease expressed by increasing size of lesions, appearance of new lesions, and/or clinical signs of inflammation within 3 months prior to the study. Exclusion criteria: pregnancy or lactation, any internal immunomodulating or immunosuppressive therapy within the last 4 weeks before treatment, any topical therapy within the last 2 weeks before treatment except the use of emollients, use of potentially photosensitising drugs, and a history of photosensitising dermatoses. Number of patients randomised: 64 (27 group 1 + 18 group 2 + 19 group 3) Number of participants analysed: 62 (27 group 1 + 17 group 2 + 18 group 3) Women: 54 (22 group 1 + 17 group 2 + 15 group 3) Men: 10 (5 group 1 + 1 group 2 + 4 group 3) Age: from 5 to 73 years old; mean age in group 1 was 36.2 ± 21.7 years (5 to 73), 43.7 ± 16.1 years (19 to 73) in group 2 and 47.7 ± 19.8 years (15 to 73) in group 3. Ethnicity: all included participants were white and had skin type II or III. Morphea type: circumscribed morphea (52), linear scleroderma (4), en coup de sabre (4), and generalised (3) subtype. 1 participant had en coup de sabre with coexisting circumscribed morphea (mixed type). Length of illness: from 5 months to 39 years; 4.4 ± 3.8 years (1 to 14) in group 1, 4.9 ± 5.1 years (1 to 19) in group 2 and 7.9 ± 9.4 years (1 to 39) in group 3. Participant's prior treatments: In 43 participants, prior treatment (topical steroids, n = 20; topical calcipotriol, n = 5; systemic steroids, n = 13; methotrexate, n = 5; cyclophosphamide, n = 1; azathioprine, n = 1; hydroxychloroquine, n = 2; penicillin, n = 8) had not resulted in a sufficient improvement. A total of 21 participants had not previously been treated for morphea. | |
| Interventions | Group 1: a. Therapy and dosage: exposure of 20 J/cm² LD UVA1 in a bed emitting wavelengths mainly from 340 nm to 400 nm. The irradiation at body distance was 24 mW/cm² resulting in a dose of 1.44 J/min/cm². The average time of exposure for applying 20 J/cm² was about 15 minutes. Phototherapy was performed 5 times a week for a total of 40 treatment sessions, resulting in a cumulative dose of 800 J/cm². b. Administration: topical c. Duration of treatment: 8 weeks d. Follow‐up after treatment: 3 months Group 2: a. Therapy and dosage: exposure of 50 J/cm² MD UVA1 in a irradiation equipment emitting wavelengths from 340 nm to 530 nm. The irradiation at body distance was 28 mW/cm² resulting in a dose of 1.68 J/min/cm². The average time of exposure for applying 20 J/cm² was about 30 minutes. Whole body irradiation was performed 5 times a week for a total of 40 treatment sessions, resulting in a cumulative dose of 2000 J/cm². b. Administration: topical c. Duration of treatment: 8 weeks d. Follow‐up after treatment: 3 months Group 3: a. Therapy and dosage: exposure to NB UVB phototherapy in a cabin fitted with fluorescent lamps that emit wavelengths between 310 nm and 315 nm with a peak at 311 nm. Starting dose was 0.1 J/cm² NB UVB for skin type II and 0.2 J/cm² for skin type III. Depending on tolerability and skin type, NB UVB dosage was increased with 0.1 to 0.2 J/cm². Maximum NB UVB dose was considered 1.3 J/cm² for skin type II and 1.5 J/cm² for skin type III. Irradiation was performed 5 times a week. b. Administration: topical c. Duration of treatment: 8 weeks d. Follow‐up after treatment: 3 months Groups 1, 2 and 3: Participants wore eye goggles as protection against UV radiation. Additional therapy was restricted to the use of emollients (not specified) that had been used according to a standard protocol and had been applied once daily in the evening. Emollients were not applied shortly (1 hour) before or after phototherapy to avoid any alteration of UV transmission. | |
| Outcomes | Primary outcome: clinical evaluation was performed by using a previously reported modified skin score, the MSS, which divides the whole body into 7 regions: head and neck, trunk, arms, hands, fingers, legs, and feet. The degree of thickness is assessed on a 0 to 3 scale (0, normal skin; 1, slightly palpable thickened skin; 2, decreased ability to move skin; 3, skin that is unable to be pinched or moved). In addition, involvement of each area is assessed (0: no involvement, 1: less than 33% involvement, 2: between 33% and 67% involvement, 3: more than 67% involvement). The sum of both thickness and affected area is the MSS, with a score of 0 for skin not affected and 42 representing extreme involvement as the maximum score. Secondary outcomes: assessment of the participants' estimate of tightness and itching on a visual analogue scale (VAS) from 0 to 10, 0 representing the absence of symptoms and 10 maximal tightness or itch, and ultrasound measurements with a digital 20 MHz ultrasound scanner to measure both structure and thickness of the skin. Authors also performed skin biopsies to assess skin involvement by a histologic score. Assessments: clinical evaluation at baseline, after therapy and at follow‐up, VAS before and after therapy, ultrasound measurements before and after therapy (on the same skin site), skin biopsies before and after phototherapy. | |
| Notes | Intervention product details: LD UVA1 treatment was performed in a Sellas WL 20.000 bed (System Dr Sellmeier, Gevelsberg, Germany) and LD UVA1 measurements were performed with UV‐Meter (Waldmann, Villingen‐Schwenningen, Germany). MD UVA1 irradiation equipment consisted of a Photomed CL 300000 liquid (Photomed, Hamburg, Germany) and MD UVA1 measurements were performed with a calibrated photometer equipped with an MP‐136U photo detector (Photomed). NB UVB phototherapy was performed using the CosmedicoGP‐42 (Cosmedico Medizintechnik GmbH, Villingen‐Schwenningen, Germany) cabin fitted with Arimed 311 (Cosmedico Medizintechnik GmbH) fluorescent lamps. Digital 20‐MHz ultrasound scanner were performed using DUB 20 (Taberna pro medicum, Lüneburg, Germany) with a 8 mm usable depth of signal penetration.. Trial registration: authors did not register a protocol for this study. Ethics committee approval: local ethics review board. Funding sources: authors declared no funding sources. Declarations of interest: authors declared no conflict of interest. | |
| Risk of bias | ||
| Bias | Authors' judgement | Support for judgement |
| Random sequence generation (selection bias) | Low risk | Quote: "Randomised assignment of the 3 phototherapeutic arms was performed by asking the patients to throw dice without knowing the underlying allocation criteria (numbers 1 and 2 = LD UVA1; 3 and 4 = MD UVA1; 5 and 6 = NB UVB)". Comment: the method used to generate the random sequence was adequate to produce comparable groups. |
| Allocation concealment (selection bias) | Low risk | Participants and investigators enrolling participants could not foresee assignment (sequence generation process: throwing dice). |
| Blinding of participants and personnel (performance bias) | High risk | Quote: "Lack of a double‐blinded setting. The latter is difficult to perform in photo dermatologic studies because irradiation time, UV cabin and equipment, and to a certain degree tanning response vary in different phototherapies"; Comment: participants and personnel had knowledge of the treatment. The outcome is likely to be influenced by lack of blinding. |
| Blinding of outcome assessment (detection bias) | High risk | Quote: "Image analysis of the ultrasound measurements was performed by an investigator who was blinded to any treatment details". Comment: only the ultrasound assessor was blinded from knowledge of which intervention a participant received. Assessors of the skin score and investigators who guided the participants in the VAS evaluation were unblinded. Thus, the primary outcome measurement of interest is likely to be influenced by lack of blinding. |
| Incomplete outcome data (attrition bias) | Low risk | Quote: "Two patients discontinued phototherapy before finishing the treatment protocol because of reasons independent to the trial. These patients were excluded from further statistical evaluation, and 62 patients were included in the ITT analysis". Comment: authors have performed 'as treated' analysis; however, the dropout rate probably does not represent serious threats to validity of the results as the study included 64 participants. |
| Selective reporting (reporting bias) | High risk | Authors did not report the length of the follow‐up after treatment, but responded to our contact and provided these data. However, authors reported only mean value for VAS results, without standard deviation, and did not provide us these data. |
| Other bias | Unclear risk | The clinical tool used (MSS) is validated for SSc, and is inappropriate for the measurement of morphea skin involvement, which could affect the result. |
| Methods | This was a prospective, randomised, double‐blind, within‐patient, controlled pilot trial conducted in the Netherlands. The aim of this study was to evaluate the efficiency of tacrolimus 0.1% ointment versus emollient petrolatum on active plaque morphea. | |
| Participants | Participants were recruited from the outpatients' clinic of the Dermatology Department of the Radboud University Nijmegen Medical Centre. Inclusion criteria: 2 or more active morphea lesions separated by at least 15 cm, no concomitant topical treatment for at least 3 weeks, and no use of systemic immunosuppressants, penicillamine, interferon‐gamma or phototherapy for at least 3 months. An active morphea plaque was defined as a sclerotic plaque with an erythematous border. Exclusion criteria: SSc (this diagnosis was excluded by a rheumatologist for all patients according to American College of Rheumatology criteria) and pseudosclerosis, proven adverse reactions to tacrolimus in the past (e.g. hypersensitivity/intolerance), women who were pregnant, nursing, or planning to become pregnant during the study, an active skin infection at the site of the morphea plaque, and recent vaccination (within 28 days prior to the start of this study). Borrelia burgdorferi infection was excluded by serology. Criteria for therapy interruption: participants were discontinued from the study if they developed an active skin infection, became pregnant, initiated prohibited medication during study, experienced serious adverse events, or failed to comply with the treatment application protocols, evaluations, or other study requirements. Number of participants: 10 Number of lesions randomised: 20 (10 group 1 + 10 group 2) Number of lesions analysed: 20 (10 group 1 + 10 group 2) Women: 7 Men: 3 Age: over 18 years old; mean age was 44.3 ± 22.1 years. Ethnicity: 9 patients were Caucasians and 1 patient was an Indonesian Creole. Morphea type: plaque Locations of the lesions: trunk (n = 6) and arms (n = 4). Length of illness: 3.4 ± 2.8 years. Extensiveness of the morphea lesions (MSS): 4.1 ± 1.9 Participant's prior treatments: topical corticosteroids (n = 9), oral corticosteroids (n = 1), penicillin (n = 1), penicillamine (n = 1), UVB‐TL01 phototherapy (n = 2), PUVA phototherapy (n = 1), and methotrexate (n = 6). | |
| Interventions | Treated lesions: a. Therapy and dosage: participants were required to apply tacrolimus 0.1% ointment twice daily on 1 of the selected lesions. b. Administration: topical c. Duration of treatment: 12 weeks d. Follow‐up after treatment: none Control lesions: a. Therapy and dosage: participants were required to apply petrolatum ointment (placebo) twice daily on the other selected lesion, which served as a control. b. Administration: topical c. Duration of treatment: 12 weeks d. Follow‐up after treatment: none | |
| Outcomes | Measurement of the surface area of the 2 lesions: an adhesive transparent film pre‐printed with squared centimetres was used to measure the surface area of the 2 lesions. The film was applied on the skin of the participant and the borders of the indurated lesions were marked with permanent colour. Objective measurements of the hardness of the skin were performed using a durometer. The durometer is fitted with a calibrated gauge that registers linearly divided units on a scale of 0 to 100. The hardness of the skin was measured by 1 investigator at 10 locations distributed equally on the morphea plaque, 3 times at each location, and the score was averaged. The averages of the 10 points were summed to give the total durometer score for 1 plaque (thus, in theory, the total durometer score ranged from 0 to 1000). The locations were selected preferentially on sites with no bony structures present directly beneath the skin. At the first visit, the measure points were photographed to guarantee measurements were taken at the same location on each subsequent visit. The clinical features of each plaque were also evaluated using the modified DIET score, that is, dyspigmentation (D), induration (I), erythema (E), telangiectasia (T) plus atrophy (A). Each clinical feature was rated on a scale of 0 (none), 1 (mild), 2 (moderate), and 3 (severe). The total clinical feature score for each plaque was determined by the sum of the separate features. The minimum score was 0 and the maximum score was 15. Adverse reactions of the applied ointments were recorded and the amount of medication applied was calculated by subtracting the remaining ointment from the total amount the patient started with. Assessments: follow‐up visits were performed every 4 weeks, and results analysed before and after treatment. | |
| Notes | Outcome measurement product information/details: the adhesive transparent film was from 3M Health Care (St Paul, MN, USA). The durometer was the 1600‐OO rex Gauge Co. (Glenview, IL, USA). When taking measurements, the durometer was used at a temperature of 24 °C and rested against the skin with the force of gravity, with a constant weight that did not allow generation of additional pressure. Trial registration: this was a pilot study and authors did not mention a registered protocol. Ethics committee approval: Radboud University Nijmegen. Funding sources: authors declared no funding. Declarations of interest: authors declared no conflicts of interested. | |
| Risk of bias | ||
| Bias | Authors' judgement | Support for judgement |
| Random sequence generation (selection bias) | Unclear risk | Quote: "Tacrolimus 0.1% ointment and petrolatum were randomly assigned to the two plaques." Comment: authors did not describe the method used to generate the random sequence in sufficient detail to allow an assessment of whether the allocation was adequate to produce comparable groups. |
| Allocation concealment (selection bias) | Unclear risk | Authors did not provide enough information to judge if the intervention allocation could be foreseen before or during the recruitment of participants. |
| Blinding of participants and personnel (performance bias) | Low risk | Quote: "The ointments were blinded for patient and investigator". Comment: participants and personnel were effectively blinded from knowledge of which intervention a participant received. It is unlikely that the blinding could have been broken. |
| Blinding of outcome assessment (detection bias) | Unclear risk | Authors did not provide enough information to assess if the outcome assessors were effectively blinded from knowledge of which intervention a participant received. |
| Incomplete outcome data (attrition bias) | Low risk | Quote: "All patients completed the study". Comment: authors included all participants in the analysis. There is no missing outcome data. |
| Selective reporting (reporting bias) | Unclear risk | The study protocol is not available. |
| Other bias | Unclear risk | The clinical tool used (modified DIET score) assessed individual lesions instead of all the lesions of the individual, which could affect the result |
| Methods | This is a double‐blinded within‐individual randomised controlled trial with adult participants comparing tranilast plus topical corticosteroid betamethasone valerate 0.1% versus topical corticosteroid betamethasone valerate 0.1%. | |
| Participants | Inclusion criteria: adults (individuals over 18 years of age) with morphea and no significant renal, hematological or hepatic disease. Only women not pregnant or lactating included. Exclusion criteria: less than 18 years of age, pregnant or lactating women, Number of participants: 3 participants with morphea. This study also included 1 participant with limited scleroderma. Number of lesions randomised: 22 Number of lesions analysed: 22 Women: 2 Men: 1 Age: 21, 25 and 77 years old. Ethnicity: 9 participants were skin type III, 37 participants were skin type IV and 17 participants were skin type V, according to Fitzpatrick’s classification. Morphea Type: plaque (1), linear (1) and generalised morphea (1). | |
| Interventions | Treated lesions (B): a. Therapy and dosage: topical betamethasone valerate 0.1% applied twice daily. Dosage of 1 finger tip unit (0.5g) per hand sized region (125 cm²). b. Administration: topical c. Duration of treatment: 3 months d. Follow‐up after treatment: none Treated lesions (B+T): a. Therapy and dosage: topical betamethasone valerate 0.1% and tranilast 1% applied twice daily. Dosage of 1 finger tip unit (0.5g) per hand sized region (125 cm²). b. Administration: topical c. Duration of treatment: 3 months d. Follow‐up after treatment: none All patients continued with their routine therapy. This varied form sole therapy in plaque disease and limited scleroderma to methotrexate in generalized morphea and methotrexate and hydroxychloroquine in linear morphea. Participant's adjuvant therapy: Nil (1), Methotrexate 20 mg weekly plus hydroxychloroquine 400 mg daily (1), Methotrexate 10 mg weekly (1). | |
| Outcomes | Protocol: monitoring to be done 3 months after commencing therapy, via the Localized Scleroderma Cutaneous Assessment Tool (LoSCAT) scores, and monthly, via laboratory tests and cream return. Methods: assessment was via Localized Scleroderma Assessment Results: LoSCAT, The Physician Global Assessment of Activity (PGA‐A) and The Physician Global Assessment of Damage (PGA‐D). | |
| Notes | Trial registration: ACTRN12615001356550. Ethics committee approval: Greenslopes Private Hospital Ethics Committee. Funding sources: authors declared no funding. Declarations of interest: author declared no conflicts of interested. | |
| Risk of bias | ||
| Bias | Authors' judgement | Support for judgement |
| Random sequence generation (selection bias) | Low risk | Quote: "Randomization was done via the MS Excel random number function. Number one was used to assign B/T application to the proximal/right treatment site with B to the comparator site and number two to assign B application to the proximal/right treatment site with B/T to the comparator site". Comment: the method used to generate the random sequence was adequate to produce comparable groups. |
| Allocation concealment (selection bias) | Low risk | Quote: "The list was provided to the study coordinator who liaised with the patients". Comment: authors responded to our contact and confirmed the list was only provided to the nurse who provided the participants with the trial agents. Thus, intervention allocation could not be foreseen before or during the recruitment of participants. |
| Blinding of participants and personnel (performance bias) | Low risk | Quote: "The investigators were blinded to the randomisation protocol". Quote: "Betamethasone valerate 0.1% in pracisal (B) was used as a control with betamethasone valerate 0.1% and tranilast 1% in pracisal (B/T) at the contralateral treatment site. Both agents were prepared by a registered compounding pharmacy (Wickham House Compounding Pharmacy, Brisbane, QLD, Australia). Comment: participants and personnel were effectively blinded from knowledge of which intervention a participant received. It is unlikely that the blinding could have been broken. |
| Blinding of outcome assessment (detection bias) | Low risk | Quote: "The investigators were blinded to the randomisation protocol". Comment: authors responded to our contact and confirmed the outcome assessors were effectively blinded from knowledge of which intervention a participant received. |
| Incomplete outcome data (attrition bias) | Low risk | Authors responded to our contact and confirmed that all participants completed the study, and also provided standard deviation values. |
| Selective reporting (reporting bias) | Low risk | Authors reported all outcomes pre‐specified in the study protocol. |
| Other bias | Unclear risk | Authors responded to our contact and confirmed that there were no significant baseline differences between groups. However, the clinical tool used (adapted LoSCAT) assessed individual lesions instead of all the lesions of the individual, which could affect the result. |
| Methods | This was a prospective, randomised, within‐patient, 3‐arm comparison trial conducted in Austria. The aim of this study was to evaluate the relative efficacy of low‐ versus medium‐dose UVA‐1 phototherapy for plaque‐type morphea, with a control plaque that remained unirradiated. The study extended during a follow‐up period of 1 year after treatment to assess the duration of the therapeutic response. | |
| Participants | Inclusion criteria: presence of active plaque‐type morphea with at least 3 lesions of comparable localization and evolution. Exclusion criteria: other types of morphea or systemic scleroderma, pregnancy or lactation, age younger than 14 years, severe cardiac insufficiency, systemic or local corticosteroids or any other disease‐related therapies within 4 weeks before study entry, abnormal photosensitivity, or intake of photosensitising drugs. Number of participants: 16 Number of lesions randomised: 48 (16 group 1 + 16 group 2 + 16 group 3) Number of lesions analysed: 42 (14 group 1 + 14 group 2 + 14 group 3) Women: 10 Men: 4 Age: 15 to 69 years old (median 49 years) Ethnicity: Caucasian, 3 participants had skin type II and 11 participants had skin type III. Morphea type: plaque Length of illness: between 4 months and 10 years (median 30 months). Participant's prior treatments: all participants had been unresponsive to previous treatment with topical corticosteroids. | |
| Interventions | Lesion 1: a. Therapy and dosage: the participant's whole body (including a selected target plaque) was treated with medium‐dose UVA‐1 (70 J/cm²), 4 times a week for 5 weeks and 2 times a week for another 5 weeks (30 UVA‐1 exposures totalising 2100 J/cm²). b. Administration: topical c. Duration of treatment: 10 weeks d. Follow‐up after treatment: 12 months Lesion 2: a. Therapy and dosage: a second plaque only received 20 J/cm² (low‐dose UVA‐1), 4 times a week for 5 weeks and 2 times a week for another 5 weeks (30 UVA‐1 exposures totalising 600 J/cm²). b. Administration: topical c. Duration of treatment: 10 weeks d. Follow‐up after treatment: 12 months Lesion 3: a. Therapy and dosage: a third plaque was always shielded from irradiation (unirradiated control). b. Administration: topical c. Duration of treatment: 10 weeks d. Follow‐up after treatment: 12 months Additional therapy for all lesions was restricted to the use of emollients that were applied once every evening. | |
| Outcomes | Primary outcome: mean decrease in skin thickness at the end of the treatment as assessed by high‐frequency ultrasound. Secondary outcomes: mean decrease in skin thickness during the follow‐up period and the mean decrease in the clinical scleroderma score. Authors used a numeric scleroderma scoring systema according to a modified score of Hulshof and colleagues and Rodnan and colleagues. For each plaque, a sum score for the intensity of erythema and induration were each assessed on a 4‐point ordinal scale between 0 (absent) and 3 (maximum intensity). Atrophy was assessed as 0 (absent) or 1 (present). Assessments: the participants were examined by the same investigator at baseline, at the end of phototherapy, and 3, 6 and 12 months after treatment. The mean value of 3 ultrasound measurements was taken. All side effects of treatment were recorded during the study | |
| Notes | Intervention product information/details: 24‐kW dermalight ultrA1 unit (Dr Sellmeier, Gevelsberg, Germany) with an emission spectrum between 340 and 440 nm. The irradiance at skin level was measured with a double monochromator (Bentham DM 150, Bentham Instruments Ltd, Reading, Berkshire, UK) and ranged between 70 and 75 mW/cm². Outcome measurement product information/details: high‐frequency ultrasound system (Dermascan C, Cortex Technology, Hadsund, Denmark) with a long‐focusing transducer. The probe had a frequency of 20 MHz. The total thickness of epidermis and dermis was measured. The gain compensation curve was adjusted in the oblique position at 20 to 45 dB. Trial registration: authors did not mention a registered protocol. Ethics committee approval: Medical University of Vienna. Funding sources: authors declared no funding. Declarations of interest: authors declared no conflicts of interested. | |
| Risk of bias | ||
| Bias | Authors' judgement | Support for judgement |
| Random sequence generation (selection bias) | Low risk | Quote: "Allocation to treatment with 70 J/cm², 20 J/cm², or no irradiation was done by using a computer‐generated randomisation list". Comment: The method used to generate the random sequence was adequate to produce comparable groups. |
| Allocation concealment (selection bias) | Unclear risk | Authors did not provide enough information to judge if the intervention allocation could be foreseen before or during the recruitment of participants. |
| Blinding of participants and personnel (performance bias) | High risk | Quote: "Each time, the patient’s whole body (including a selected target plaque) was treated with medium‐dose UVA1 (70 J/cm²) with the exception of a second plaque that only received 20 J/cm² (low‐dose UVA1) and a third plaque that was always shielded from irradiation to rule out spontaneous remission (unirradiated control)." Comment: each participant had 1 lesion treated differently from the whole body, and 1 untreated lesion. Thus, participants and personnel had knowledge of the treatment. The outcome is likely to be influenced by lack of blinding. |
| Blinding of outcome assessment (detection bias) | High risk | Quote: "The patients were always examined by the same unblinded investigator. A blinded assessment was not performed because UVA1‐induced pigmentation in the periphery of the target lesions would have immediately allowed the investigator to distinguish between irradiated and control plaques". Comment: The outcome assessor was unblinded from knowledge of which intervention a participant received. The outcome is likely to be influenced by lack of blinding. |
| Incomplete outcome data (attrition bias) | High risk | Quote: "Two patients were withdrawn from evaluation because of irregular attendance to treatment". Comment: authors excluded these 2 participants from the statistical evaluation, performing 'as treated' analysis. ITT analysis includes data from all randomised participants, regardless of study completion. |
| Selective reporting (reporting bias) | High risk | Authors reported only median or mean value (without standard deviation) for outcomes results. |
| Other bias | Unclear risk | The clinical tool used assessed individual lesions instead of all the lesions of the individual, which could affect the result |
| Methods | This was a parallel intra‐individual comparative randomised controlled clinical trial conducted in Egypt. The aim of this study was to evaluate the efficacy of the fractional carbon dioxide laser as a new modality for treatment of morphea and to compare its results with the well‐established method of UVA‐1 phototherapy. | |
| Participants | Patients with localized morphea who consecutively presented over 1 year to outpatient clinics of Dermatology Department, Kasr Al‐Aini Hospitals, Faculty of Medicine, Cairo University, were assessed for eligibility. Inclusion criteria: patients with plaque and linear morphea (limb variant and en coup de sabre), either newly diagnosed or discontinuing any treatments for at least 3 months before the study. Exclusion criteria: patients with deep and systemic types of morphea, contraindications to phototherapy and/or laser therapy. Number of participants: 21 Number of lesions randomised: 42 (21 group 1 + 21 group 2) Number of lesions analysed: 34 (17 group 1 + 17 group 2) Women: 15 Men: 2 Age: 7 to 47 years old; mean age was 25.6 ± 11.06 years. Ethnicity: 10 participants had skin type III and 7 participants had skin type IV. Morphea type: plaque (n = 12), linear (n = 3), en coup de sabre (n = 2). Stage of disease: active (n = 7), indurated (n = 9), atrophic (n = 1). Length of illness: between 6 and 96 months (mean 23.6 ± 29.3 months). Participant's prior treatments: 12 participants had tried previous therapies. | |
| Interventions | Lesion 1: a. Therapy and dosage: fractional CO₂ laser treatment, 3 sessions separated by 1‐month intervals. b. Administration: topical c. Duration of treatment: 10 weeks d. Follow‐up after treatment: none Lesion 2: a. Therapy and dosage: low‐dose UVA‐1 phototherapy (30 J/cm²), 3 sessions a week. b. Administration: topical c. Duration of treatment: 10 weeks d. Follow‐up after treatment: none | |
| Outcomes | Primary outcome: clinical improvement (regarding thickness, dermal atrophy, dyschromia, and erythema based on the scores adopted and modified from the Localised Scleroderma Cutaneous Assessment Tool ‐ LoSCAT), histopathological and immunohistochemical analysis, and patient satisfaction scores (regarding overall improvement, the feasibility of therapy, and side effects according to a standardised patient satisfaction score). Results were compared to those of the standard treatment with low‐dose UVA‐1 phototherapy. Secondary outcomes: assessing the complications and the mechanism of action of fractional CO₂ laser on collagen remodeling. Dermal thickness in mm was measured by ultrasound biomicroscopy (UBM). Assessments: clinical evaluation was done before, on monthly basis, and at the end of the study. Patient satisfaction scores were evaluated at the end point of the study. Improvement was graded as follows: poor: no improvement, fair: < 40 %, good: 40% to 59 %, very good: ≥ 60 % improvement. End of study (EoS) was at the last session in UVA‐1‐treated areas and 1 month after the last session in FAL‐treated areas. | |
| Notes | Intervention product information/details: for phototherapy, a hand lamp unit (Waldmann, UV 109 A,Germany) was used with a radiation spectrum ranging from 350 to 400 nm with a maximum peak at 370 nm. For laser therapy, a DEKA fractional CO₂ laser (SmartXideDOT, Italy) was used (power 25 W stack 2, dwelling time 500 msec, spacing 500 μm). Outcome measurement product information/details: paradigm ultrasound biomicroscopy plus Model P45 using very high frequency ultrasound (50 MHz). Trial registration: authors registered the protocol of this study on clinical trial.gov (ID: NCT02002897). Ethics committee approval: Dermatology Research Ethical Committee (Derma REC) at Kasr Al‐Aini Hospital. Funding sources: Cairo University (in partial). Declarations of interest: authors declared no conflicts of interest | |
| Risk of bias | ||
| Bias | Authors' judgement | Support for judgement |
| Random sequence generation (selection bias) | Low risk | Quote: "Randomization was carried out using the sealed envelope method where the patients drew lots between sealed envelopes, contact cards with treatment codes either UVA‐1 phototherapy for lesion A and fractional CO₂ laser therapy for lesion B". Comment: the method used to generate the random sequence was adequate to produce comparable groups. |
| Allocation concealment (selection bias) | Low risk | Participants and investigators enrolling participants could not foresee assignment (sequence generation process: sealed envelopes). |
| Blinding of participants and personnel (performance bias) | High risk | Considering the nature of the interventions, the protocol determined an open‐label study. Participants and personnel had knowledge of the treatment. The outcome is likely to be influenced by lack of blinding. |
| Blinding of outcome assessment (detection bias) | Low risk | Quote: "The first author generated the random allocation and enrolled the participants, whereas clinical assessment was done by the fourth author who was blinded to the used intervention". Comment: the outcome assessor was effectively blinded from knowledge of which intervention a participant received. It is unlikely that the blinding could have been broken. |
| Incomplete outcome data (attrition bias) | High risk | Quote: "Demographic and clinical data of the 17 patients are summarized in Table 2". Comment: authors excluded from the analysis 4 participants who did not complete the study. Thus, authors performed 'as‐treated' analysis. |
| Selective reporting (reporting bias) | Low risk | Authors reported all outcomes pre‐specified in the study protocol. |
| Other bias | Unclear risk | The clinical tool used (adapted LoSCAT) assessed individual lesions instead of all the lesions of the individual, which could affect the result. |
| Methods | This was a prospective, controlled, randomised pilot trial conducted in Germany. The aim of this study was to assess the efficacy and tolerability of a Traditional Chinese Medicine (TCM) treatment for localised scleroderma established in China in European participants. | |
| Participants | Participants were recruited in clinics from January to October 2004. Inclusion criteria: individuals between 18 and 75 years old with an histologically secured localised scleroderma, type plaque or linear morphea of any duration, presenting < 10 foci and a lesion between 10 cm² to 300 cm², who have not used any other local and/or systemic therapy for morphea 4 weeks prior to inclusion in the study. Exclusion criteria: punctuate lesions or lenticular spots; lesion extent > 500 cm²; systemic involvement or other special forms; systemic immunosuppressant or immunomodulatory medication; positive serology for Borrelia; heart or cardiovascular disease, hepatitis, asymptomatic elevation of renal retention values or renal disease; intolerance to penicillin or ingredients of the herbal oil; pregnant and breastfeeding women. Criteria for interruption of the therapy : patient's wish, local and systemic intolerance, or disease progression (growth of focus > 5 cm², more than 2 new foci). Number of participants randomised: 24 (12 group 1 + 12 group 2) Number of participants analysed: authors did not report this information. Women: 17 (9 group 1 + 8 group 2) Men: 7 (3 group 1 + 4 group 2) Age range: from 18 to 68 years old, mean 43 (from 18 to 68 years old, mean 43.5 group 1+ from 19 to 62 years old, mean 40.5 group 2) Ethnicity: European participants Morphea Type: 18 plaque, 6 linear; > 5 foci in all patients (6 to 10, mean 7) Length of illness: 5 years (from 0.5 to 40) Extent of selected marker lesions: between 10 and 300 cm²; mean 180.2 cm² group 1 + 129.5 cm² group 2) Participant's past treatments: systemic antibiotics (n = 5), systemic glucocorticoids (n = 4), local glucocorticoids (n = 19), chloroquine (n = 1), bath PUVA (n = 7) | |
| Interventions | Group 1: a. Therapy and dosage: 200ml of a TCM herbs solution (tea), twice a day. Additionally, vitamin B6 (3× 20 mg capsules per day) and manual application (with rubbing movements) of a herbal oil onto the affected body sites, once a day, during 5 minutes. b. Administration: oral intake and topical c. Duration of treatment: 12 weeks d. Follow‐up after treatment: 12 weeks Group 2: a. Therapy and dosage: phenoxymethylpenicillin 1.2 mega 3 times a day. Addditionally, manual application (with rubbing movements) of base cream DAC onto the affected body sites, once a day, during 5 minutes. b. Administration: oral intake and topical c. Duration of treatment: 6 weeks (penicillin) and 12 weeks (cream) d. Follow‐up after treatment: 12 weeks | |
| Outcomes | Planimetric assessment of the extent of the marker lesion using a stencil, sonographic assessment of skin thickness, and laboratory assessments: differential blood count, GPT, GOT, Gamma‐GT, AP, CRP, creatinine, serology for ANA. Assessments: the area and thickness of the marker lesions was assessed at baseline and weeks 2, 4, 6, 8, 10, 12 and 24. Antinuclear antibody test at baseline and week 12, other laboratory assessments at baseline and weeks 4, 8, 12 and 24. | |
| Notes | Intervention product details: Composition of the TCM herbal tea (group 1): Radix astragali, Rhizoma Atractylodis Macrocephalae, Pachyma, Semen sinapis albae, Radix salviae miltiorrhizae, Flos carthami, Rhizoma zedoariae, Ramulus Cinnamomi, Caulis spatolobi, Bombyx batryticatus, Rhizoma dioscoreae, Herba Lycopodii, Semen coicis, Cortex eucommiae, Radix paeoniae rubra, Radix paeoniae alba, Fructus ligustri and Fructus corni. A laboratory tested the TCM used in this study for contaminations with hydrocortisone, lead, cadmium and mercury. Composition of the herbal oil (group 1): true dragon red flower oil, paraffin, cassia oil, camphor, cinnamon, turpentine, cinnamaldehyde and wintergreen oil. DAC base cream (group 2): a standard moisturizing base cream from the Deutsche Arzneimittel‐Codex (DAC, German Pharmaceutical Codex). Outcome measurement product details: sonography with a Esaote ultrasound (20 MHz). Trial registration: this was a pilot study and authors did not mention a registered protocol. Ethics committee approval: Charité Humboldt University Berlin. Funding sources: Verein zur Foerderung der Dermatologie e.v. Berlin. Declarations of interest: authors declared no conflict of interest. | |
| Risk of bias | ||
| Bias | Authors' judgement | Support for judgement |
| Random sequence generation (selection bias) | Unclear risk | Authors did not describe the method used to generate the random sequence in sufficient detail to allow an assessment of whether the allocation was adequate to produce comparable groups. |
| Allocation concealment (selection bias) | Unclear risk | Authors did not provide enough information to judge if the intervention allocation could be foreseen before or during the recruitment of participants. |
| Blinding of participants and personnel (performance bias) | High risk | The interventions had different forms of administration. Participants and personnel had knowledge of which intervention a participant received. The outcome is likely to be influenced by lack of blinding. |
| Blinding of outcome assessment (detection bias) | High risk | Authors did not clearly describe whether the outcome assessors were effectively blinded from knowledge of which UVA dose each participant received. However, authors responded to our contact and informed that the outcome assessors were unblinded to the knowledge of which intervention a participant received. Thus, the outcome measurement of interest is likely to be influenced by lack of blinding. |
| Incomplete outcome data (attrition bias) | High risk | Authors responded to our contact and confirmed they excluded from the analysis 4 participants who experienced side effects ('as treated' analysis). Only 24 participants were randomised. |
| Selective reporting (reporting bias) | High risk | Authors reported only mean value for outcomes results, without standard deviation, and did not provide us this data. |
| Other bias | Unclear risk | The assessment was of individual lesions instead of all the lesions of the individual, which could affect the result |
| Methods | This was a randomised controlled trial conducted in China. The aim of this study was to assess the clinical efficacy and safety of surrounding needle, moxibustion and hot compress of Traditional Chinese Medicine (TCM) herbs for localised scleroderma. | |
| Participants | Participants were enrolled in dermatology outpatient clinics from March 2010 to June 2011. Inclusion criteria: individuals aged 18 to 65 years, with a confirmed diagnosis of localised scleroderma based on characteristics of skin lesions and tissue biopsy, voluntarily participating in the study and giving a written consent. Exclusion criteria: pregnant/breastfeeding women; allergy to Chinese medicine; having oral steroids in the prior 2 weeks and/or having oral or topical steroids in the prior week before treatment; individuals with co‐morbidities (cerebral cardiovascular disease, live, renal and hematopoietic system disease) or mental disorders. Number of participants randomised: 42 (23 group 1 + 19 group 2) Number of participants analysed: 41 (22 group 1 + 19 group 2) Women: 22 Men: 20 Age range: from 18 to 65 years old Ethnicity: authors did not report this information. Morphea Type: authors did not report this information. Length of illness (mean): 14.2 years group 1 +13.6 years group 2 Affected areas: 7 in head‐face, 11 in body and 5 in limbs group 1 + 6 in head‐face, 9 in body and 4 in limbs group 2 | |
| Interventions | Group 1: a. Therapy and dosage: surrounding needle at local area and Hegu, Zusanli, Yanglingquan and Waiguan area for 30 minutes every the other day. Additionally, hot external application of hot compress herbs at local area for 30 minutes, twice a day, and moxibustion at affected site as well as Hegu and Zusanli area for 30 minutes every day, plus 4 Centella triterpenes tablets (6 mg per tablet), 3 times a day (total 12 tablets), and 1 vitamin E tablet (0.1 g), 3 times a day (total 3 tablets). b. Administration: manual application (each treatment should be separated for at least 2 hours) and oral intake. c. Duration of treatment: 6 months d. Follow‐up after treatment: none Group 2: a. Therapy and dosage: external application of heparin sodium cream at affected areas, twice a day, plus 4 Centella triterpenes tablets (6 mg per tablet), 3 times a day (total 12 tablets), and 1 vitamin E tablet (0.1 g), 3 times a day (total 3 tablets). b. Administration: oral intake and topical c. Duration of treatment: 6 months d. Follow‐up after treatment: none | |
| Outcomes | Outcomes: authors have not clearly defined primary and secondary outcomes. Outcomes included clinical assessment according to TCM syndromes criteria, scores of skin sclerosis based on Steen criteria, scores of joint pain based on TCM syndromes criteria and scores of joint function based on Kahan criteria, as well as assessment of safety. Assessments: at baseline and after the treatment | |
| Notes | Trial registration: authors did not mention a registered protocol Ethics committee approval: yes Funding sources: governmental funding bodies Declarations of interest: authors did not report this information | |
| Risk of bias | ||
| Bias | Authors' judgement | Support for judgement |
| Random sequence generation (selection bias) | Low risk | The translator informed that the method used to generate the random sequence was a random number table. Thus, it was adequate to produce comparable groups. |
| Allocation concealment (selection bias) | Unclear risk | Authors did not provide enough information to judge if the intervention allocation could be foreseen before or during the recruitment of participants. |
| Blinding of participants and personnel (performance bias) | High risk | The interventions had different forms of administration. Participants and personnel had knowledge of which intervention a participant received. The outcome is likely to be influenced by lack of blinding. |
| Blinding of outcome assessment (detection bias) | Unclear risk | Authors did not provide enough information to assess if the outcome assessors were effectively blinded from knowledge of which intervention a participant received. |
| Incomplete outcome data (attrition bias) | Low risk | The translator informed that 1 participant from the intervention group dropped out because of pain due to acupuncture and authors excluded this participant from the data analysis. However, this probably does not represent serious threats to validity of the results. |
| Selective reporting (reporting bias) | Unclear risk | The study protocol is not available. |
| Other bias | Unclear risk | The outcome assessment followed criteria from TCM, which could affect the result. |
| Methods | This was a multi‐centre, randomised, double‐blind, placebo‐controlled trial, conducted in Italy. The aim of this study was to assess the clinical efficacy and safety of methotrexate (MTX) compared with placebo in children and adolescents with active juvenile localized scleroderma. | |
| Participants | This study was a cooperative effort of the Italian Pediatric Rheumatology and Dermatology Study Groups, in which 14 paediatric rheumatology and dermatology centres participated. Informed consent was sought from the parents and patients according to legal requirements. After consent was obtained, patients were stratified according to juvenile localized scleroderma subtype to ensure comparable distribution between treatment groups. The recruitment period was from June 2005 to March 2009. Inclusion criteria: diagnosis of juvenile localised scleroderma (linear, generalised, or mixed subtype) disease in an active phase, onset before 16 years of age, and absence of immunosuppressive treatment during the 6 months prior to enrolment. Active disease was defined as the appearance of new lesions or increased size of preexisting lesions, with signs of active inflammation such as erythema and/or positive thermography findings. Exclusion criteria: SSc, major concomitant medical conditions, leukopenia < 3.0 × 10⁹/litre, thrombocytopenia 100 × 10⁹/litre, liver transaminase levels more than twice the upper limit of normal, or renal impairment defined as creatinine clearance < 90 ml/minute/1.73 m², or if the participant or parent was unwilling or unable to adhere to the protocol. Number of participants randomised: 70 (46 group 1 + 24 group 2) Number of participants analysed: 70 (46 group 1 + 24 group 2) Women: 50 (34 group 1 + 16 group 2) Men: 20 (12 group 1 + 8 group 2) Age (range; mean ± SD, years): 6–17 years (9 ± 4.9 group 1 + 10.2 ± 4.8 group 2) Age at disease onset (mean ± SD, years): 6.9 ± 3.8 group 1 + 8.0 ± 3.4 group 2 Ethnicity: authors did not report this information. Length of illness (mean ± SD, years): 2.3 years (2.4 ± 2.2 group 1 + 2.1 ± 2.8 group 2) Morphea type: linear scleroderma (n = 44; 32 group 1 + 12 group 2), generalised morphea (n = 18; 10 group 1 + 8 group 2) and mixed subtype (linear / circumscribed; n = 8; 4 group 1 + 4 group 2). Participant's prior treatments: 22 patients had been previously treated with topical steroids, 6 with D‐penicillamine, 1 with cyclosporin A, and 13 with other non‐immunomodulatory drugs before study entry. | |
| Interventions | Group 1: a. Therapy and dosage: oral MTX at a dosage of 15 mg/m² once per week (maximum 20 mg), plus folic acid supplementation (2.5 mg, 48 hours after MTX treatment) and oral prednisone (1 mg/kg/day, maximum 50 mg, in a single morning dose for 3 months, followed by gradual tapering for 1 month until discontinuation). b. Administration: oral c. Duration of treatment: 12 months or until flare of the disease d. Follow‐up after treatment: none Group 2: a. Therapy and dosage: oral placebo at a dosage of 15 mg/m² once per week (maximum 20 mg) plus folic acid supplementation (2.5 mg, 48 hours after placebo treatment) and oral prednisone (1 mg/kg/day, maximum 50 mg, in a single morning dose for 3 months, followed by gradual tapering for 1 month until discontinuation) b. Administration: oral c. Duration of treatment: 12 months or until flare of the disease. d. Follow‐up after treatment: none | |
| Outcomes | Primary outcomes: rate of response to treatment at the end of the 12‐month follow‐up. Responders were defined as participants who satisfied all 3 criteria, i.e., SSR ≤ 1, decreased ΔTh% of at least 10% compared to baseline, and absence of new lesions. At baseline, a single lesion judged as active by both clinical evaluation and thermography was selected as “target,” and its size was measured by a computerized skin scoring (CSS) system. Authors calculated the ratio between area of the lesion and body surface area, expressed as a percentage (standardized computerized skin score (S‐CSS)), to analyse the progression of the skin lesions, and considering that almost all patients were in a growing stage. This parameter helps to distinguish whether the enlargement of a lesion is related to disease progression or simply to the natural process of growth over the time. The values obtained at baseline (t0) and at the following visits (tn) allow calculation of the skin score rate (SSR), i.e. the ratio tn S‐CSS:t0 S‐CSS. In this way, the change of a lesion becomes independent of the natural growth of the body surface area. An SSR of ≤ 1 means decreased extension of the lesion, and an SSR of > 1 indicates an increase. The degree of inflammation was assessed by infrared thermography, according to a standardized procedure, and performed by the same investigator, using the same infrared camera. All patients were scanned 15 minutes after acclimatization, wearing underwear only. A lesion was considered positive on thermography (active lesion) when a substantial area > 0.5 °C warmer than the matching opposite limb or body area site was visible. Authors calculated the percentage thermal change from the baseline value (ΔTh%) according to the formula ([tn − t0]/t0) × 100, where tn was the temperature value at the time of evaluation and t0 was the value at baseline. A negative ΔTh% value meant improvement, and a positive ΔTh% value meant worsening of the target lesion. If there was doubt about characterization of a lesion in atrophic skin as active, a careful clinical evaluation was performed by 2 independent observers, and their assessment was compared to the thermography result, to avoid false‐positive results. Secondary outcomes: the proportion of responder patients who had disease flare, the changes from baseline in each of the 3 response parameters (SSR, ΔTh%, new lesions), and assessment of safety and tolerability. Disease flare was defined as the occurrence of at least 1 of the following: SSR > 1; < 10% improvement or positive ΔTh% value; or appearance of new lesions. Clinical assessment of general systems and of the skin lesions also included the physician’s global assessment of disease severity (100 mm visual analogue scale (VAS)), parents’ global assessment of the patient’s overall well‐being (100 mm VAS), and functional ability assessment using the validated translated version of the Childhood Health Assessment Questionnaire (C‐HAQ) disability index (0 to 3 point scale). The shape and size of the lesions and presence of new lesions were assessed by clinical examination and represented on a mannequin. A digital photograph was also taken at each visit. The following laboratory parameters were measured: haemoglobin level, mean red blood cell volume, white blood cell and differential cell count, platelet count, erythrocyte sedimentation rate, and levels of C‐reactive protein, serum creatinine, blood urea nitrogen and glucose, serum glutamic oxaloacetic transaminase, serum glutamic pyruvic transaminase, and gamma glutamyl transpeptidase. At study entry and after 3 and 12 months, levels of creatine kinase, aldolase, serum immunoglobulins (IgG, IgA, IgM), and complement fractions (C3 and C4) were also measured and urinalysis was performed. At study entry and after 12 months, the following autoantibodies were assessed: antinuclear antibody (ANA) (by indirect immunofluorescence on Hep‐2 cells), anti–double‐stranded DNA (anti‐dsDNA), anti–topoisomerase I (anti–Scl‐70), anti‐centromere antibody, anti–extractable nuclear antigen, anticardiolipin antibody, anti‐2‐glycoprotein I, lupus anticoagulant, and rheumatoid factor (RF). At each visit, adverse events were carefully monitored, specifically the occurrence of skin rash, anorexia, nausea, vomiting, gastrointestinal discomfort, diarrhoea, change in behavior, weight gain, and headache. Follow‐up duration: each patient was scheduled to be examined and to have laboratory tests during a total of 6 visits over a 12‐month period (at study entry and after 1, 3, 6, 9, and 12 months). | |
| Notes | Participants were given the option to receive open‐label treatment with MTX in a 2‐year follow‐up treatment period if they had a flare of scleroderma in the double‐blind period or completed the double‐blind period without flare. Thermographer information/details: GM, infrared camera (ThermaCAM PM695; Flir Systems). Withdrawals: 32 participants (15 group 1 + 17 group 2) prematurely discontinued the study drug because of disease flare. Trial registration: authors did not mention a registered protocol. Ethics committee approval: University Hospital of Padua, where all patients were evaluated. Funding sources: supported by Mediafriends, ONLUS, Milan, Italy, and Il Volo, Association for Rheumatic Diseases in Children, ONLUS, Padua, Italy. Declarations of interest: authors did not report this information. ‐ Authors published this study 3 times. | |
| Risk of bias | ||
| Bias | Authors' judgement | Support for judgement |
| Random sequence generation (selection bias) | Low risk | Quote: "To reduce the risk of prolonged exposure to the placebo treatment and considering the difficulty for parents to accept a 9‐month period without active treatment if the patient was included in the placebo arm, a 2:1 MTX/placebo randomisation rate was adopted. A computer‐generated randomisation list was used to randomise patients to receive MTX or placebo. Patients were assigned numbers according to the sequence in which they entered the study". Comment: the method used to generate the random sequence was adequate to produce comparable groups. |
| Allocation concealment (selection bias) | Unclear risk | Authors did not provide enough information to judge if the intervention allocation could be foreseen before or during the recruitment of participants. |
| Blinding of participants and personnel (performance bias) | Low risk | Quote: "MTX was provided in the form of tablets in doses of 2.5 mg, with corresponding placebo tablets. The production of the study medications, packaging, and labelling were done by a certified pharmaceutical laboratory". Comment: participants and personnel were effectively blinded from knowledge of which intervention a participant received. It is unlikely that the blinding could have been broken. |
| Blinding of outcome assessment (detection bias) | Low risk | Quote: "The code was not broken until completion of the study, except in cases of medical emergency or relapse". Comment: outcome assessors were effectively blinded from knowledge of which intervention a participant received. |
| Incomplete outcome data (attrition bias) | Low risk | Quote: "Data were analysed according to the intent‐to‐treat principle; all patients were assessed at each of the 6 time points, whether or not they were still receiving treatment". Quote: "All 70 enrolled patients were qualified for the intent‐to‐treat analysis of efficacy. Among them, 38 (54.3%) completed the 12‐month trial, including 31 (67.4%) of the 46 patients in the MTX group and 7 (29.2%) of the 24 patients in the placebo group (P = 0.005). In all cases, the reason for premature discontinuation of the study drug was disease flare" Comment: Authors performed ITT analysis. |
| Selective reporting (reporting bias) | High risk | Quote: "Although a trend toward improvement in the physician's and the patient's/parents' global assessment of disease severity and functional ability (evaluated using the C‐HAQ) was found in MTX treated patients (data not shown), the changes did not reach statistical significance". Comment: authors reported no numerical data for outcomes of interest. |
| Other bias | Low risk | Besides no baseline differences, the global tool of assessment, although not validated, considers the disease activity and also the disease progression in children at a growing stage. |
Characteristics of excluded studies [ordered by study ID]
| Study | Reason for exclusion |
| This study investigated calcitriol for treating morphea in 7 young participants (mean age: 7.3 years) and was not an RCT. This study was published in French and without an abstract in English. | |
| This descriptive study reported experiences with ultrasonics and lidase phonophoresis for various forms of scleroderma. This study was published in Russian and without an abstract in English. | |
| This non‐randomised, open trial investigated the anti‐inflammatory agent Elarzone‐Dausse in disorders affecting the venous system. This study was published in French and without an abstract in English. | |
| This multicentre, prospective, non‐randomised, vehicle‐controlled trial evaluated the therapeutic potential and safety profile of imiquimod 5% cream in plaque‐type morphea. 25 adult participants from 2 Canadian centres with histologically confirmed plaque‐type morphea were enrolled. Imiquimod 5% was applied to a representative plaque and, if more than 1 lesion were present, vehicle was applied to a control plaque for 9 months (non‐randomised selection). Treatment efficacy was assessed with the dyspigmentation, induration, erythema, and telangiectasias (DIET) score, histology, and ultrasound evaluation. | |
| This study investigated the efficacy of Prostaglandin E1 and propylene glycol alginate sodium in the treatment of urticarial vasculitis, which appears in the progression of SSc. This study was published in Chinese and without an abstract in English. | |
| This abstract reported a prospective, controlled, non‐randomised study aiming to assess the efficacy, tolerance and safety of Climen (combined estrogenic and gestagenic drug) in the treatment of localised scleroderma. This study included 17 postmenopausal women aged from 45 to 56 without contraindications to the gonadotherapy, and a control group of 20 participants matched by age and clinical features. Climen was administered orally for 21 days a month during 3 to 6 months (mean 5 months) versus placebo in control group. No other therapy was used. The outcomes measures included scoring of the number and square of lesions (maximum worse score was 30). | |
| This was an open, non‐randomised study investigating the efficacy, potential limitations, and biological mechanisms of UV‐A1 phototherapy for skin sclerosis due to collagen deposition disorders. 8 participants with scleroderma and 4 participants with sclerodermatous graft‐vs‐host disease were treated with high‐dose (130 J/cm²) UV‐A1 phototherapy 3 times per week for 14 weeks. 2 participants with scleroderma and 4 participants with morphea were treated with medium‐dose (65 J/cm²) UV‐A1 phototherapy 3 times per week for 14 weeks. Healthy volunteers without skin disease were treated with UV‐A1 irradiation at various doses and frequencies, with biopsies performed afterwards. In sclerotic skin, induration was clinically assessed using a scoring scale. In normal skin, quantitative polymerase chain reaction was used to assess anti‐fibrotic responses, defined as decreased type I and type III procollagen and increased matrix metalloproteinase levels. |
Characteristics of studies awaiting assessment [ordered by study ID]
| Methods | A prospective randomised open label trial comparing high‐dose UVA‐1 or medium‐dose UVA‐1 versus fluocinonide 0.05% cream in the treatment of morphea |
| Participants | Inclusion criteria: male and female subjects 18 years of age or older; symmetric limited morphea. Exclusion criteria: known sensitivity to fluocinonide 0.05% cream; clinical evidence of superinfected skin; immunocompromised state (including previously documented HIV); generalized scleroderma; previous history of skin cancer; non‐English speaking individuals. |
| Interventions | Interventions groups: 1: Medium‐dose (60 J/cm²) UVA‐1 3x/week for 12 weeks to 1 morphea plaque and fluocinonide 0.05% cream to another morphea plaque twice daily for twelve weeks; 2: High‐dose (120 J/cm²) UVA‐1 treatment 3x/week for 12 weeks to 1 morphea plaque and fluocinonide 0.05% cream twice daily for 12 weeks to another morphea plaque. |
| Outcomes | Authors only described that they would assess the efficacy of UVA‐1 treatment vs. topical steroid during 5 years, indicating no measures for the evaluations. |
| Notes |
| Methods | A randomised, blinded, and controlled trial assessing the efficacy and safety of UVA1 phototherapy in the treatment of active morphea in adults and children. |
| Participants | Presence of at least 1 active morphea lesion (linear, plaque, generalized, or mixed subtypes) confirmed by the primary investigator and/or by histopathological examination. |
| Interventions | 2 intervention groups: 1: medium dose (70 J/cm²) phototherapy (active UVA1 phototherapy) with an ultraviolet translucent acrylic screen 3 times per week for 10 weeks; 2: "sham" UVA1 (0 J/cm²) phototherapy with an ultraviolet opaque acrylic screen 3 times per week for 10 weeks. The phototherapists, patients, and principal investigator were blinded to whether the patients receive active or sham UVA1 phototherapy. Patients only allowed to apply emollients during the study. |
| Outcomes | The primary outcome measure is mean change in Localized Scleroderma Severity Index (LoSSI), a validated clinical score of morphea activity, from baseline versus after 30 treatments. Follow‐up: 3 years. The secondary outcome measure is the physician's global assessment of disease activity (PGA‐A). To identify UVA1‐induced molecular pathways that may account for the efficacy of UVA1 phototherapy in morphea, authors performed gene expression profiling using RNA derived from affected and non‐lesional whole skin from patients with morphea before and after UVA1 phototherapy. |
| Notes |
Data and analyses
| Outcome or subgroup title | No. of studies | No. of participants | Statistical method | Effect size |
| 1 Modified Skin Score (MSS) at the end of the eight‐week treatment Show forest plot | 1 | 44 | Mean Difference (IV, Random, 95% CI) | 1.60 [‐1.70, 4.90] |
| Analysis 1.1  Comparison 1 Medium‐dose UVA‐1 (50 J/cm²) x Low‐dose UVA‐1 (20 J/cm²) phototherapy, Outcome 1 Modified Skin Score (MSS) at the end of the eight‐week treatment. | ||||
| 2 Modified Skin Score (MSS) at last follow‐up visit (week 20) Show forest plot | 1 | 44 | Mean Difference (IV, Random, 95% CI) | 2.5 [‐1.90, 6.90] |
| Analysis 1.2  Comparison 1 Medium‐dose UVA‐1 (50 J/cm²) x Low‐dose UVA‐1 (20 J/cm²) phototherapy, Outcome 2 Modified Skin Score (MSS) at last follow‐up visit (week 20). | ||||
| 3 Number of participants with mild tanning Show forest plot | 1 | 44 | Risk Ratio (M‐H, Random, 95% CI) | 1.0 [0.91, 1.10] |
| Analysis 1.3  Comparison 1 Medium‐dose UVA‐1 (50 J/cm²) x Low‐dose UVA‐1 (20 J/cm²) phototherapy, Outcome 3 Number of participants with mild tanning. | ||||
| 4 Ultrasound dermal density at the end of the eight‐week treatment Show forest plot | 1 | 36 | Mean Difference (IV, Random, 95% CI) | ‐16.43 [‐34.87, 2.01] |
| Analysis 1.4  Comparison 1 Medium‐dose UVA‐1 (50 J/cm²) x Low‐dose UVA‐1 (20 J/cm²) phototherapy, Outcome 4 Ultrasound dermal density at the end of the eight‐week treatment. | ||||
| 5 Ultrasound corium thickness at the end of the eight‐week treatment Show forest plot | 1 | 36 | Mean Difference (IV, Random, 95% CI) | 196.29 [‐162.28, 554.86] |
| Analysis 1.5  Comparison 1 Medium‐dose UVA‐1 (50 J/cm²) x Low‐dose UVA‐1 (20 J/cm²) phototherapy, Outcome 5 Ultrasound corium thickness at the end of the eight‐week treatment. | ||||
| Outcome or subgroup title | No. of studies | No. of participants | Statistical method | Effect size |
| 1 Modified Skin Score (MSS) at the end of the eight‐week treatment Show forest plot | 1 | 35 | Mean Difference (IV, Random, 95% CI) | ‐1.70 [‐5.27, 1.87] |
| Analysis 2.1  Comparison 2 Narrowband UVB x Medium‐dose UVA‐1 (50 J/cm²) phototherapy, Outcome 1 Modified Skin Score (MSS) at the end of the eight‐week treatment. | ||||
| 2 Modified Skin Score (MSS) at last follow‐up visit (week 20) Show forest plot | 1 | 35 | Mean Difference (IV, Random, 95% CI) | ‐2.10 [‐6.73, 2.53] |
| Analysis 2.2  Comparison 2 Narrowband UVB x Medium‐dose UVA‐1 (50 J/cm²) phototherapy, Outcome 2 Modified Skin Score (MSS) at last follow‐up visit (week 20). | ||||
| 3 Number of participants with mild tanning Show forest plot | 1 | 35 | Risk Ratio (M‐H, Random, 95% CI) | 0.03 [0.00, 0.42] |
| Analysis 2.3  Comparison 2 Narrowband UVB x Medium‐dose UVA‐1 (50 J/cm²) phototherapy, Outcome 3 Number of participants with mild tanning. | ||||
| 4 Number of participants with transient erythema Show forest plot | 1 | 35 | Risk Ratio (M‐H, Random, 95% CI) | 6.63 [0.37, 119.59] |
| Analysis 2.4  Comparison 2 Narrowband UVB x Medium‐dose UVA‐1 (50 J/cm²) phototherapy, Outcome 4 Number of participants with transient erythema. | ||||
| 5 Ultrasound dermal density at the end of the eight‐week treatment Show forest plot | 1 | 28 | Mean Difference (IV, Random, 95% CI) | 17.78 [‐6.08, 41.64] |
| Analysis 2.5  Comparison 2 Narrowband UVB x Medium‐dose UVA‐1 (50 J/cm²) phototherapy, Outcome 5 Ultrasound dermal density at the end of the eight‐week treatment. | ||||
| 6 Ultrasound corium thickness at the end of the eight‐week treatment Show forest plot | 1 | 28 | Mean Difference (IV, Random, 95% CI) | ‐78.35 [‐528.59, 371.89] |
| Analysis 2.6  Comparison 2 Narrowband UVB x Medium‐dose UVA‐1 (50 J/cm²) phototherapy, Outcome 6 Ultrasound corium thickness at the end of the eight‐week treatment. | ||||
| Outcome or subgroup title | No. of studies | No. of participants | Statistical method | Effect size |
| 1 Modified Skin Score (MSS) at the end of the eight‐week treatment Show forest plot | 1 | 45 | Mean Difference (IV, Random, 95% CI) | ‐0.10 [‐2.49, 2.29] |
| Analysis 3.1  Comparison 3 Narrowband UVB X Low‐dose UVA‐1 (20 J/cm²) phototherapy, Outcome 1 Modified Skin Score (MSS) at the end of the eight‐week treatment. | ||||
| 2 Modified Skin Score (MSS) at last follow‐up visit (week 20) Show forest plot | 1 | 45 | Mean Difference (IV, Random, 95% CI) | 0.40 [‐2.17, 2.97] |
| Analysis 3.2  Comparison 3 Narrowband UVB X Low‐dose UVA‐1 (20 J/cm²) phototherapy, Outcome 2 Modified Skin Score (MSS) at last follow‐up visit (week 20). | ||||
| 3 Number of participants with mild tanning Show forest plot | 1 | 45 | Risk Ratio (M‐H, Random, 95% CI) | 0.03 [0.00, 0.41] |
| Analysis 3.3  Comparison 3 Narrowband UVB X Low‐dose UVA‐1 (20 J/cm²) phototherapy, Outcome 3 Number of participants with mild tanning. | ||||
| 4 Number of participants with transient erythema Show forest plot | 1 | 45 | Risk Ratio (M‐H, Random, 95% CI) | 10.32 [0.56, 188.49] |
| Analysis 3.4  Comparison 3 Narrowband UVB X Low‐dose UVA‐1 (20 J/cm²) phototherapy, Outcome 4 Number of participants with transient erythema. | ||||
| 5 Ultrasound dermal density at the end of the eight‐week treatment Show forest plot | 1 | 32 | Mean Difference (IV, Random, 95% CI) | 1.35 [‐19.39, 22.09] |
| Analysis 3.5  Comparison 3 Narrowband UVB X Low‐dose UVA‐1 (20 J/cm²) phototherapy, Outcome 5 Ultrasound dermal density at the end of the eight‐week treatment. | ||||
| 6 Ultrasound corium thickness at the end of the eight‐week treatment Show forest plot | 1 | 32 | Mean Difference (IV, Random, 95% CI) | 117.94 [‐311.20, 547.08] |
| Analysis 3.6  Comparison 3 Narrowband UVB X Low‐dose UVA‐1 (20 J/cm²) phototherapy, Outcome 6 Ultrasound corium thickness at the end of the eight‐week treatment. | ||||
| Outcome or subgroup title | No. of studies | No. of participants | Statistical method | Effect size |
| 1 Number of plaques with moderate to significant tanning Show forest plot | 1 | Risk Ratio (Random, 95% CI) | 29.00 [1.90, 443.28] | |
| Analysis 4.1  Comparison 4 Medium‐dose (70 J/cm²) or Low‐dose (20 J/cm²) UVA‐1 phototherapy x No treatment, Outcome 1 Number of plaques with moderate to significant tanning. | ||||
| 2 Number of plaques with painless erythema Show forest plot | 1 | Risk Ratio (Random, 95% CI) | 4.41 [0.23, 84.79] | |
| Analysis 4.2  Comparison 4 Medium‐dose (70 J/cm²) or Low‐dose (20 J/cm²) UVA‐1 phototherapy x No treatment, Outcome 2 Number of plaques with painless erythema. | ||||
| 3 Number of plaques with pruritus Show forest plot | 1 | Risk Ratio (Random, 95% CI) | 4.41 [0.23, 84.79] | |
| Analysis 4.3  Comparison 4 Medium‐dose (70 J/cm²) or Low‐dose (20 J/cm²) UVA‐1 phototherapy x No treatment, Outcome 3 Number of plaques with pruritus. | ||||
| Outcome or subgroup title | No. of studies | No. of participants | Statistical method | Effect size |
| 1 Number of participants with generalised tanning Show forest plot | 1 | 47 | Risk Ratio (M‐H, Random, 95% CI) | 1.0 [0.92, 1.09] |
| Analysis 5.1  Comparison 5 20 J/cm2 UVA x 10 J/cm² UVA phototherapy, Outcome 1 Number of participants with generalised tanning. | ||||
| 2 Number of participants with temporary pruritus Show forest plot | 1 | 47 | Risk Ratio (M‐H, Random, 95% CI) | 0.81 [0.18, 3.60] |
| Analysis 5.2  Comparison 5 20 J/cm2 UVA x 10 J/cm² UVA phototherapy, Outcome 2 Number of participants with temporary pruritus. | ||||
| 3 Number of participants with increased erythema and exacerbated pain Show forest plot | 1 | 47 | Risk Ratio (M‐H, Random, 95% CI) | 2.44 [0.10, 57.08] |
| Analysis 5.3  Comparison 5 20 J/cm2 UVA x 10 J/cm² UVA phototherapy, Outcome 3 Number of participants with increased erythema and exacerbated pain. | ||||
| 4 Number of participants with skin softening at the end of the seven‐week treatment Show forest plot | 1 | 47 | Risk Ratio (M‐H, Random, 95% CI) | 1.21 [0.69, 2.11] |
| Analysis 5.4  Comparison 5 20 J/cm2 UVA x 10 J/cm² UVA phototherapy, Outcome 4 Number of participants with skin softening at the end of the seven‐week treatment. | ||||
| Outcome or subgroup title | No. of studies | No. of participants | Statistical method | Effect size |
| 1 Number of participants with generalised tanning Show forest plot | 1 | 42 | Risk Ratio (M‐H, Random, 95% CI) | 1.0 [0.91, 1.10] |
| Analysis 6.1  Comparison 6 20 J/cm2 UVA x 5 J/cm² UVA phototherapy, Outcome 1 Number of participants with generalised tanning. | ||||
| 2 Number of participants with temporary pruritus Show forest plot | 1 | 42 | Risk Ratio (M‐H, Random, 95% CI) | 0.62 [0.14, 2.69] |
| Analysis 6.2  Comparison 6 20 J/cm2 UVA x 5 J/cm² UVA phototherapy, Outcome 2 Number of participants with temporary pruritus. | ||||
| 3 Number of participants with increased erythema and exacerbated pain Show forest plot | 1 | 42 | Risk Ratio (M‐H, Random, 95% CI) | 1.89 [0.08, 43.75] |
| Analysis 6.3  Comparison 6 20 J/cm2 UVA x 5 J/cm² UVA phototherapy, Outcome 3 Number of participants with increased erythema and exacerbated pain. | ||||
| 4 Number of participants with skin softening at the end of the seven‐week treatment Show forest plot | 1 | 42 | Risk Ratio (M‐H, Random, 95% CI) | 1.54 [0.75, 3.14] |
| Analysis 6.4  Comparison 6 20 J/cm2 UVA x 5 J/cm² UVA phototherapy, Outcome 4 Number of participants with skin softening at the end of the seven‐week treatment. | ||||
| Outcome or subgroup title | No. of studies | No. of participants | Statistical method | Effect size |
| 1 Number of participants with generalised tanning Show forest plot | 1 | 37 | Risk Ratio (M‐H, Random, 95% CI) | 1.0 [0.90, 1.11] |
| Analysis 7.1  Comparison 7 10 J/cm2 UVA x 5 J/cm² UVA phototherapy, Outcome 1 Number of participants with generalised tanning. | ||||
| 2 Number of participants with temporary pruritus Show forest plot | 1 | 37 | Risk Ratio (M‐H, Random, 95% CI) | 0.76 [0.18, 3.29] |
| Analysis 7.2  Comparison 7 10 J/cm2 UVA x 5 J/cm² UVA phototherapy, Outcome 2 Number of participants with temporary pruritus. | ||||
| 3 Number of participants with skin softening at the end of the seven‐week treatment Show forest plot | 1 | 37 | Risk Ratio (M‐H, Random, 95% CI) | 1.27 [0.58, 2.76] |
| Analysis 7.3  Comparison 7 10 J/cm2 UVA x 5 J/cm² UVA phototherapy, Outcome 3 Number of participants with skin softening at the end of the seven‐week treatment. | ||||
| Outcome or subgroup title | No. of studies | No. of participants | Statistical method | Effect size |
| 1 Number of plaques with pigmentation Show forest plot | 1 | Risk Ratio (Random, 95% CI) | 13.00 [0.89, 189.38] | |
| Analysis 8.1  Comparison 8 Photodynamic therapy × No Treatment, Outcome 1 Number of plaques with pigmentation. | ||||
| 2 Number of plaques with burning sensation during phototherapy Show forest plot | 1 | Risk Ratio (Random, 95% CI) | 9.00 [0.59, 137.65] | |
| Analysis 8.2  Comparison 8 Photodynamic therapy × No Treatment, Outcome 2 Number of plaques with burning sensation during phototherapy. | ||||
| 3 Number of plaques with dryness Show forest plot | 1 | Risk Ratio (Random, 95% CI) | 3.00 [0.15, 61.73] | |
| Analysis 8.3  Comparison 8 Photodynamic therapy × No Treatment, Outcome 3 Number of plaques with dryness. | ||||
| 4 Number of plaques with erythema Show forest plot | 1 | Risk Ratio (Random, 95% CI) | 5.00 [0.29, 86.43] | |
| Analysis 8.4  Comparison 8 Photodynamic therapy × No Treatment, Outcome 4 Number of plaques with erythema. | ||||
| 5 Number of plaques with pruritus Show forest plot | 1 | Risk Ratio (Random, 95% CI) | 3.00 [0.15, 61.73] | |
| Analysis 8.5  Comparison 8 Photodynamic therapy × No Treatment, Outcome 5 Number of plaques with pruritus. | ||||
| 6 Number of plaques with reduction in the skin score at the 12‐week follow‐up Show forest plot | 1 | Risk Ratio (Random, 95% CI) | 1.0 [0.45, 2.23] | |
| Analysis 8.6  Comparison 8 Photodynamic therapy × No Treatment, Outcome 6 Number of plaques with reduction in the skin score at the 12‐week follow‐up. | ||||
| Outcome or subgroup title | No. of studies | No. of participants | Statistical method | Effect size |
| 1 Number of lesions with mild to moderate pain during therapy Show forest plot | 1 | Risk Ratio (Random, 95% CI) | 35.00 [2.27, 538.86] | |
| Analysis 9.1  Comparison 9 Fractional carbon dioxide laser × Low‐dose UVA‐1 (30 J/cm²) phototherapy, Outcome 1 Number of lesions with mild to moderate pain during therapy. | ||||
| 2 Number of lesions with marked pain during therapy Show forest plot | 1 | Risk Ratio (Random, 95% CI) | 21.00 [1.33, 332.06] | |
| Analysis 9.2  Comparison 9 Fractional carbon dioxide laser × Low‐dose UVA‐1 (30 J/cm²) phototherapy, Outcome 2 Number of lesions with marked pain during therapy. | ||||
| 3 Number of lesions with pruritus in first 24h Show forest plot | 1 | Risk Ratio (Random, 95% CI) | 17.00 [1.06, 273.00] | |
| Analysis 9.3  Comparison 9 Fractional carbon dioxide laser × Low‐dose UVA‐1 (30 J/cm²) phototherapy, Outcome 3 Number of lesions with pruritus in first 24h. | ||||
| 4 Number of lesions with hyperpigmentation Show forest plot | 1 | Risk Ratio (Random, 95% CI) | 0.25 [0.03, 2.01] | |
| Analysis 9.4  Comparison 9 Fractional carbon dioxide laser × Low‐dose UVA‐1 (30 J/cm²) phototherapy, Outcome 4 Number of lesions with hyperpigmentation. | ||||
| 5 Number of lesions with persistent erythema Show forest plot | 1 | Risk Ratio (Random, 95% CI) | 3.00 [0.13, 68.84] | |
| Analysis 9.5  Comparison 9 Fractional carbon dioxide laser × Low‐dose UVA‐1 (30 J/cm²) phototherapy, Outcome 5 Number of lesions with persistent erythema. | ||||
| 6 Ultrasound biomicroscopy dermal thickness at the 10‐week follow‐up Show forest plot | 1 | Mean Difference (Random, 95% CI) | ‐0.15 [‐0.33, 0.03] | |
| Analysis 9.6  Comparison 9 Fractional carbon dioxide laser × Low‐dose UVA‐1 (30 J/cm²) phototherapy, Outcome 6 Ultrasound biomicroscopy dermal thickness at the 10‐week follow‐up. | ||||
| 7 Clinical score at the 10‐week follow‐up Show forest plot | 1 | Mean Difference (Random, 95% CI) | ‐1.59 [‐2.82, ‐0.36] | |
| Analysis 9.7  Comparison 9 Fractional carbon dioxide laser × Low‐dose UVA‐1 (30 J/cm²) phototherapy, Outcome 7 Clinical score at the 10‐week follow‐up. | ||||
| 8 Participant satisfaction score at the 10‐week follow‐up Show forest plot | 1 | Mean Difference (Random, 95% CI) | 1.12 [0.80, 1.44] | |
| Analysis 9.8  Comparison 9 Fractional carbon dioxide laser × Low‐dose UVA‐1 (30 J/cm²) phototherapy, Outcome 8 Participant satisfaction score at the 10‐week follow‐up. | ||||
| 9 Number of lesions with good or very good improvement in the clinical score at the 10‐week follow‐up Show forest plot | 1 | Risk Ratio (Random, 95% CI) | 2.67 [1.39, 5.13] | |
| Analysis 9.9  Comparison 9 Fractional carbon dioxide laser × Low‐dose UVA‐1 (30 J/cm²) phototherapy, Outcome 9 Number of lesions with good or very good improvement in the clinical score at the 10‐week follow‐up. | ||||
| Outcome or subgroup title | No. of studies | No. of participants | Statistical method | Effect size |
| 1 Number of participants with short‐duration pain at injection site Show forest plot | 1 | 27 | Risk Ratio (M‐H, Random, 95% CI) | 5.79 [1.86, 18.02] |
| Analysis 10.1  Comparison 10 Polymerized collagen intralesional injection (0.2 to 1.0 mL / 1.66 to 8.3 mg weekly) × Methylprednisolone subcutaneous injection (maximum dose of 20 mg or 5.0 mL monthly) plus placebo intralesional injection, Outcome 1 Number of participants with short‐duration pain at injection site. | ||||
| 2 Number of participants with pruritus Show forest plot | 1 | 27 | Risk Ratio (M‐H, Random, 95% CI) | 0.07 [0.00, 1.14] |
| Analysis 10.2  Comparison 10 Polymerized collagen intralesional injection (0.2 to 1.0 mL / 1.66 to 8.3 mg weekly) × Methylprednisolone subcutaneous injection (maximum dose of 20 mg or 5.0 mL monthly) plus placebo intralesional injection, Outcome 2 Number of participants with pruritus. | ||||
| 3 Number of participants with sclerosis Show forest plot | 1 | 27 | Risk Ratio (M‐H, Random, 95% CI) | 0.36 [0.02, 8.06] |
| Analysis 10.3  Comparison 10 Polymerized collagen intralesional injection (0.2 to 1.0 mL / 1.66 to 8.3 mg weekly) × Methylprednisolone subcutaneous injection (maximum dose of 20 mg or 5.0 mL monthly) plus placebo intralesional injection, Outcome 3 Number of participants with sclerosis. | ||||
| 4 Skin score at the end of the three‐month treatment Show forest plot | 1 | 27 | Mean Difference (IV, Random, 95% CI) | 1.30 [0.31, 2.29] |
| Analysis 10.4  Comparison 10 Polymerized collagen intralesional injection (0.2 to 1.0 mL / 1.66 to 8.3 mg weekly) × Methylprednisolone subcutaneous injection (maximum dose of 20 mg or 5.0 mL monthly) plus placebo intralesional injection, Outcome 4 Skin score at the end of the three‐month treatment. | ||||
| 5 Skin score at last follow‐up visit (month nine) Show forest plot | 1 | 27 | Mean Difference (IV, Random, 95% CI) | 0.5 [‐0.25, 1.25] |
| Analysis 10.5  Comparison 10 Polymerized collagen intralesional injection (0.2 to 1.0 mL / 1.66 to 8.3 mg weekly) × Methylprednisolone subcutaneous injection (maximum dose of 20 mg or 5.0 mL monthly) plus placebo intralesional injection, Outcome 5 Skin score at last follow‐up visit (month nine). | ||||
| 6 Number of morphea lesions at the end of the three‐month treatment Show forest plot | 1 | 27 | Mean Difference (IV, Random, 95% CI) | 0.20 [‐0.16, 0.56] |
| Analysis 10.6  Comparison 10 Polymerized collagen intralesional injection (0.2 to 1.0 mL / 1.66 to 8.3 mg weekly) × Methylprednisolone subcutaneous injection (maximum dose of 20 mg or 5.0 mL monthly) plus placebo intralesional injection, Outcome 6 Number of morphea lesions at the end of the three‐month treatment. | ||||
| Outcome or subgroup title | No. of studies | No. of participants | Statistical method | Effect size |
| 1 Clinical response at the end of the 12‐month treatment Show forest plot | 1 | 70 | Risk Ratio (M‐H, Random, 95% CI) | 2.31 [1.20, 4.45] |
| Analysis 11.1  Comparison 11 Oral methotrexate (15 mg/m², maximum 20 mg a week) plus oral prednisone × Placebo plus oral prednisone, Outcome 1 Clinical response at the end of the 12‐month treatment. | ||||
| 2 Number of participants with at least one adverse event Show forest plot | 1 | 70 | Risk Ratio (M‐H, Random, 95% CI) | 1.23 [0.75, 2.04] |
| Analysis 11.2  Comparison 11 Oral methotrexate (15 mg/m², maximum 20 mg a week) plus oral prednisone × Placebo plus oral prednisone, Outcome 2 Number of participants with at least one adverse event. | ||||
| 3 Skin Score Rate (SSR) at the end of the 12‐month treatment Show forest plot | 1 | 70 | Mean Difference (IV, Random, 95% CI) | ‐0.31 [‐0.35, ‐0.27] |
| Analysis 11.3  Comparison 11 Oral methotrexate (15 mg/m², maximum 20 mg a week) plus oral prednisone × Placebo plus oral prednisone, Outcome 3 Skin Score Rate (SSR) at the end of the 12‐month treatment. | ||||
| 4 Percentage thermal change at the end of the 12‐month treatment Show forest plot | 1 | 70 | Mean Difference (IV, Random, 95% CI) | ‐32.3 [‐37.92, ‐26.68] |
| Analysis 11.4  Comparison 11 Oral methotrexate (15 mg/m², maximum 20 mg a week) plus oral prednisone × Placebo plus oral prednisone, Outcome 4 Percentage thermal change at the end of the 12‐month treatment. | ||||
| 5 Number of participants with new lesions at the end of the 12‐month treatment Show forest plot | 1 | 70 | Risk Ratio (M‐H, Random, 95% CI) | 0.39 [0.10, 1.61] |
| Analysis 11.5  Comparison 11 Oral methotrexate (15 mg/m², maximum 20 mg a week) plus oral prednisone × Placebo plus oral prednisone, Outcome 5 Number of participants with new lesions at the end of the 12‐month treatment. | ||||
| Outcome or subgroup title | No. of studies | No. of participants | Statistical method | Effect size |
| 1 Modified Skin Score (MSS) at the end of the three‐month treatment Show forest plot | 1 | 25 | Mean Difference (IV, Random, 95% CI) | 0.5 [‐1.93, 2.93] |
| Analysis 12.1  Comparison 12 Oral hydroxychloroquine (200 mg twice a day) plus topical corticosteroid x Oral methotrexate (15 mg a week) plus topical corticosteroid, Outcome 1 Modified Skin Score (MSS) at the end of the three‐month treatment. | ||||
| 2 Number of participants with liver enzymes rise more than three times during the three‐month treatment Show forest plot | 1 | 25 | Risk Ratio (M‐H, Random, 95% CI) | 0.13 [0.01, 2.33] |
| Analysis 12.2  Comparison 12 Oral hydroxychloroquine (200 mg twice a day) plus topical corticosteroid x Oral methotrexate (15 mg a week) plus topical corticosteroid, Outcome 2 Number of participants with liver enzymes rise more than three times during the three‐month treatment. | ||||
| 3 VAS for participants' estimate of skin tightness at the end of the three‐month treatment Show forest plot | 1 | 25 | Mean Difference (IV, Random, 95% CI) | 0.30 [‐0.49, 1.09] |
| Analysis 12.3  Comparison 12 Oral hydroxychloroquine (200 mg twice a day) plus topical corticosteroid x Oral methotrexate (15 mg a week) plus topical corticosteroid, Outcome 3 VAS for participants' estimate of skin tightness at the end of the three‐month treatment. | ||||
| 4 VAS for participants' estimate of pruritus at the end of the three‐month treatment Show forest plot | 1 | 25 | Mean Difference (IV, Random, 95% CI) | ‐2.3 [‐3.25, ‐1.35] |
| Analysis 12.4  Comparison 12 Oral hydroxychloroquine (200 mg twice a day) plus topical corticosteroid x Oral methotrexate (15 mg a week) plus topical corticosteroid, Outcome 4 VAS for participants' estimate of pruritus at the end of the three‐month treatment. | ||||
| Outcome or subgroup title | No. of studies | No. of participants | Statistical method | Effect size |
| 1 Number of plaques with pruritus Show forest plot | 1 | Risk Ratio (Random, 95% CI) | 3.00 [0.14, 65.90] | |
| Analysis 13.1  Comparison 13 Topical tacrolimus 0.1% × Placebo, Outcome 1 Number of plaques with pruritus. | ||||
| 2 Durometer score at the end of the 12‐week treatment Show forest plot | 1 | Mean Difference (Random, 95% CI) | 47.2 [‐44.55, 138.95] | |
| Analysis 13.2  Comparison 13 Topical tacrolimus 0.1% × Placebo, Outcome 2 Durometer score at the end of the 12‐week treatment. | ||||
| 3 Plaque surface area at the end of the 12‐week treatment Show forest plot | 1 | Mean Difference (Random, 95% CI) | 0.5 [‐38.35, 39.35] | |
| Analysis 13.3  Comparison 13 Topical tacrolimus 0.1% × Placebo, Outcome 3 Plaque surface area at the end of the 12‐week treatment. | ||||
| 4 Number of plaques with a reduced modified DIET score at the end of the 12‐week treatment Show forest plot | 1 | Risk Ratio (Random, 95% CI) | 1.14 [0.69, 1.90] | |
| Analysis 13.4  Comparison 13 Topical tacrolimus 0.1% × Placebo, Outcome 4 Number of plaques with a reduced modified DIET score at the end of the 12‐week treatment. | ||||
| 5 Modified DIET score at the end of the 12‐week treatment Show forest plot | 1 | Mean Difference (Random, 95% CI) | ‐1.7 [‐3.11, ‐0.29] | |
| Analysis 13.5  Comparison 13 Topical tacrolimus 0.1% × Placebo, Outcome 5 Modified DIET score at the end of the 12‐week treatment. | ||||
| Outcome or subgroup title | No. of studies | No. of participants | Statistical method | Effect size |
| 1 Number of participants with transient hypercalciuria Show forest plot | 1 | 27 | Risk Ratio (M‐H, Random, 95% CI) | 7.50 [0.42, 132.58] |
| Analysis 14.1  Comparison 14 Oral calcitriol (0.75 μg increased to 1.25 μg/day) × Placebo, Outcome 1 Number of participants with transient hypercalciuria. | ||||
| 2 Skin score at the end of the 9‐month treatment Show forest plot | 1 | 20 | Mean Difference (IV, Random, 95% CI) | 1.10 [‐2.98, 5.18] |
| Analysis 14.2  Comparison 14 Oral calcitriol (0.75 μg increased to 1.25 μg/day) × Placebo, Outcome 2 Skin score at the end of the 9‐month treatment. | ||||
| 3 Skin score at the end of the 15‐month follow‐up Show forest plot | 1 | 20 | Mean Difference (IV, Random, 95% CI) | 3.70 [‐1.49, 8.89] |
| Analysis 14.3  Comparison 14 Oral calcitriol (0.75 μg increased to 1.25 μg/day) × Placebo, Outcome 3 Skin score at the end of the 15‐month follow‐up. | ||||
| Outcome or subgroup title | No. of studies | No. of participants | Statistical method | Effect size |
| 1 Clinical score at the end of the three‐month treatment Show forest plot | 1 | Mean Difference (Random, 95% CI) | ‐1.5 [‐3.88, 0.88] | |
| Analysis 15.1  Comparison 15 Tranilast plus topical betamethasone valerate 0.1% versus topical betamethasone valerate 0.1%, Outcome 1 Clinical score at the end of the three‐month treatment. | ||||
| 2 Physician Global Assessment of Activity at the end of the three‐month treatment Show forest plot | 1 | Mean Difference (Random, 95% CI) | ‐7.5 [‐23.73, 8.73] | |
| Analysis 15.2  Comparison 15 Tranilast plus topical betamethasone valerate 0.1% versus topical betamethasone valerate 0.1%, Outcome 2 Physician Global Assessment of Activity at the end of the three‐month treatment. | ||||
| 3 Number of lesions with disease progression at the end of the three‐month treatment Show forest plot | 1 | Risk Ratio (Random, 95% CI) | 0.24 [0.01, 4.47] | |
| Analysis 15.3  Comparison 15 Tranilast plus topical betamethasone valerate 0.1% versus topical betamethasone valerate 0.1%, Outcome 3 Number of lesions with disease progression at the end of the three‐month treatment. | ||||
| 4 Physician Global Assessment of Damage at the end of the three‐month treatment Show forest plot | 1 | Mean Difference (Random, 95% CI) | ‐6.00 [‐24.90, 12.90] | |
| Analysis 15.4  Comparison 15 Tranilast plus topical betamethasone valerate 0.1% versus topical betamethasone valerate 0.1%, Outcome 4 Physician Global Assessment of Damage at the end of the three‐month treatment. | ||||
| Outcome or subgroup title | No. of studies | No. of participants | Statistical method | Effect size |
| 1 Number of participants with adverse events Show forest plot | 1 | 24 | Risk Ratio (M‐H, Random, 95% CI) | 1.0 [0.17, 5.98] |
| Analysis 16.1  Comparison 16 Traditional Chinese Medicine herbal tea plus herbal oil and vitamin B6 x Phenoxymethylpenicillin plus DAC base cream, Outcome 1 Number of participants with adverse events. | ||||
| Outcome or subgroup title | No. of studies | No. of participants | Statistical method | Effect size |
| 1 Number of participants with significant clinical response at the end of the six‐month treatment Show forest plot | 1 | 41 | Risk Ratio (M‐H, Random, 95% CI) | 1.64 [1.04, 2.59] |
| Analysis 17.1  Comparison 17 Acupuncture, hot herbal compress, and moxibustion plus Centella triterpenes tablets and vitamin E × Heparin sodium cream plus Centella triterpenes tablets and vitamin E, Outcome 1 Number of participants with significant clinical response at the end of the six‐month treatment. | ||||
| 2 Number of participants with pain during treatment Show forest plot | 1 | 41 | Risk Ratio (M‐H, Random, 95% CI) | 2.61 [0.11, 60.51] |
| Analysis 17.2  Comparison 17 Acupuncture, hot herbal compress, and moxibustion plus Centella triterpenes tablets and vitamin E × Heparin sodium cream plus Centella triterpenes tablets and vitamin E, Outcome 2 Number of participants with pain during treatment. | ||||
| 3 Skin sclerosis score at the end of the six‐month treatment Show forest plot | 1 | 41 | Mean Difference (IV, Random, 95% CI) | ‐10.34 [‐16.83, ‐3.85] |
| Analysis 17.3  Comparison 17 Acupuncture, hot herbal compress, and moxibustion plus Centella triterpenes tablets and vitamin E × Heparin sodium cream plus Centella triterpenes tablets and vitamin E, Outcome 3 Skin sclerosis score at the end of the six‐month treatment. | ||||
| 4 Joint function score at the end of the six‐month treatment period Show forest plot | 1 | 41 | Mean Difference (IV, Random, 95% CI) | ‐1.65 [‐2.95, ‐0.35] |
| Analysis 17.4  Comparison 17 Acupuncture, hot herbal compress, and moxibustion plus Centella triterpenes tablets and vitamin E × Heparin sodium cream plus Centella triterpenes tablets and vitamin E, Outcome 4 Joint function score at the end of the six‐month treatment period. | ||||
| 5 Joint pain score at the end of the six‐month treatment Show forest plot | 1 | 41 | Mean Difference (IV, Random, 95% CI) | ‐6.63 [‐11.20, ‐2.06] |
| Analysis 17.5  Comparison 17 Acupuncture, hot herbal compress, and moxibustion plus Centella triterpenes tablets and vitamin E × Heparin sodium cream plus Centella triterpenes tablets and vitamin E, Outcome 5 Joint pain score at the end of the six‐month treatment. | ||||

A ‐ Confluent sclero‐atrophic lesions, with hypochromic, achromic and brownish areas on the thighs, generalised morphea; B ‐ sclero‐atrophic oval lesion with dyschromic areas and halo erythematosus in its right and inferior portion, active circumscribed morphea; C ‐ brown macula with discretely erythematous areas and irregular borders, circumscribed morphea in involution. Copyright © 2019 Monica RA Vasconcellos: reproduced with permission.

Linear scleroderma. A ‐ Sclero‐atrophic lesion involving the back of the hand and fingers, with deviation in the fourth and fifth chirodactyls; B – Streak of atrophy in the tongue (left) and dental implant defect (right); C – segmental sclero‐atrophic lesions in the trunk and limbs interspersed by hyper pigmented maculae. Copyright © 2019 Monica RA Vasconcellos: reproduced with permission.

Study flow diagram.
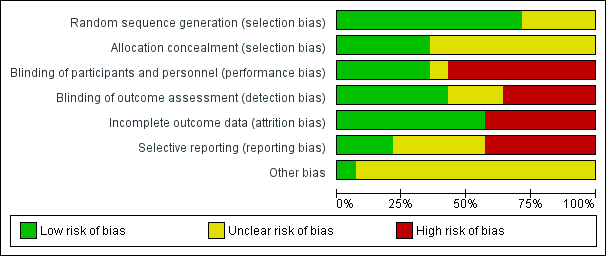
Risk of bias graph: review authors' judgements about each 'Risk of bias' item represented as percentages across all included studies.

Risk of bias summary: review authors' judgements about each 'Risk of bias' item for each included study.

Comparison 1 Medium‐dose UVA‐1 (50 J/cm²) x Low‐dose UVA‐1 (20 J/cm²) phototherapy, Outcome 1 Modified Skin Score (MSS) at the end of the eight‐week treatment.

Comparison 1 Medium‐dose UVA‐1 (50 J/cm²) x Low‐dose UVA‐1 (20 J/cm²) phototherapy, Outcome 2 Modified Skin Score (MSS) at last follow‐up visit (week 20).

Comparison 1 Medium‐dose UVA‐1 (50 J/cm²) x Low‐dose UVA‐1 (20 J/cm²) phototherapy, Outcome 3 Number of participants with mild tanning.
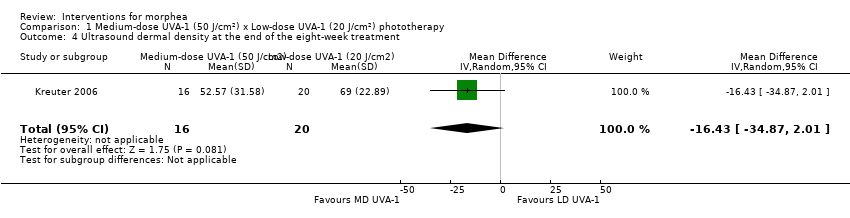
Comparison 1 Medium‐dose UVA‐1 (50 J/cm²) x Low‐dose UVA‐1 (20 J/cm²) phototherapy, Outcome 4 Ultrasound dermal density at the end of the eight‐week treatment.
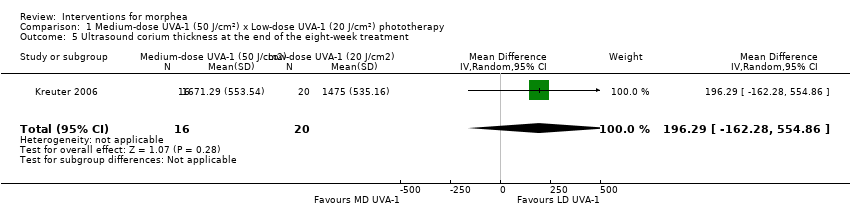
Comparison 1 Medium‐dose UVA‐1 (50 J/cm²) x Low‐dose UVA‐1 (20 J/cm²) phototherapy, Outcome 5 Ultrasound corium thickness at the end of the eight‐week treatment.

Comparison 2 Narrowband UVB x Medium‐dose UVA‐1 (50 J/cm²) phototherapy, Outcome 1 Modified Skin Score (MSS) at the end of the eight‐week treatment.
Comparison 2 Narrowband UVB x Medium‐dose UVA‐1 (50 J/cm²) phototherapy, Outcome 2 Modified Skin Score (MSS) at last follow‐up visit (week 20).
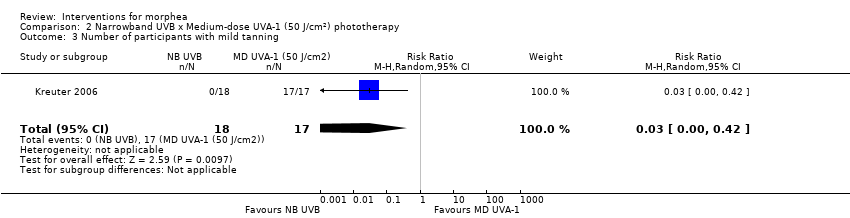
Comparison 2 Narrowband UVB x Medium‐dose UVA‐1 (50 J/cm²) phototherapy, Outcome 3 Number of participants with mild tanning.

Comparison 2 Narrowband UVB x Medium‐dose UVA‐1 (50 J/cm²) phototherapy, Outcome 4 Number of participants with transient erythema.

Comparison 2 Narrowband UVB x Medium‐dose UVA‐1 (50 J/cm²) phototherapy, Outcome 5 Ultrasound dermal density at the end of the eight‐week treatment.

Comparison 2 Narrowband UVB x Medium‐dose UVA‐1 (50 J/cm²) phototherapy, Outcome 6 Ultrasound corium thickness at the end of the eight‐week treatment.
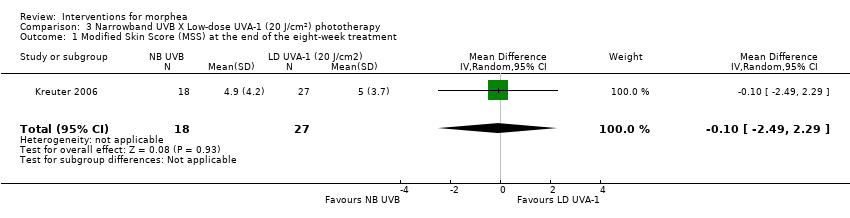
Comparison 3 Narrowband UVB X Low‐dose UVA‐1 (20 J/cm²) phototherapy, Outcome 1 Modified Skin Score (MSS) at the end of the eight‐week treatment.

Comparison 3 Narrowband UVB X Low‐dose UVA‐1 (20 J/cm²) phototherapy, Outcome 2 Modified Skin Score (MSS) at last follow‐up visit (week 20).

Comparison 3 Narrowband UVB X Low‐dose UVA‐1 (20 J/cm²) phototherapy, Outcome 3 Number of participants with mild tanning.

Comparison 3 Narrowband UVB X Low‐dose UVA‐1 (20 J/cm²) phototherapy, Outcome 4 Number of participants with transient erythema.

Comparison 3 Narrowband UVB X Low‐dose UVA‐1 (20 J/cm²) phototherapy, Outcome 5 Ultrasound dermal density at the end of the eight‐week treatment.

Comparison 3 Narrowband UVB X Low‐dose UVA‐1 (20 J/cm²) phototherapy, Outcome 6 Ultrasound corium thickness at the end of the eight‐week treatment.

Comparison 4 Medium‐dose (70 J/cm²) or Low‐dose (20 J/cm²) UVA‐1 phototherapy x No treatment, Outcome 1 Number of plaques with moderate to significant tanning.
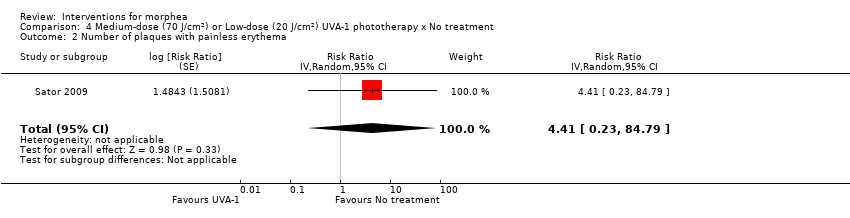
Comparison 4 Medium‐dose (70 J/cm²) or Low‐dose (20 J/cm²) UVA‐1 phototherapy x No treatment, Outcome 2 Number of plaques with painless erythema.

Comparison 4 Medium‐dose (70 J/cm²) or Low‐dose (20 J/cm²) UVA‐1 phototherapy x No treatment, Outcome 3 Number of plaques with pruritus.

Comparison 5 20 J/cm2 UVA x 10 J/cm² UVA phototherapy, Outcome 1 Number of participants with generalised tanning.

Comparison 5 20 J/cm2 UVA x 10 J/cm² UVA phototherapy, Outcome 2 Number of participants with temporary pruritus.
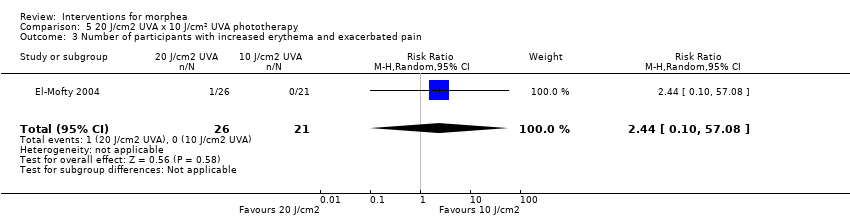
Comparison 5 20 J/cm2 UVA x 10 J/cm² UVA phototherapy, Outcome 3 Number of participants with increased erythema and exacerbated pain.

Comparison 5 20 J/cm2 UVA x 10 J/cm² UVA phototherapy, Outcome 4 Number of participants with skin softening at the end of the seven‐week treatment.
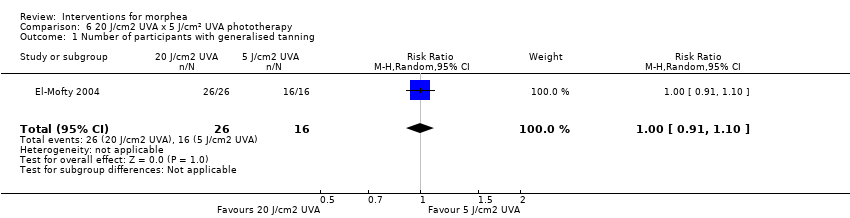
Comparison 6 20 J/cm2 UVA x 5 J/cm² UVA phototherapy, Outcome 1 Number of participants with generalised tanning.

Comparison 6 20 J/cm2 UVA x 5 J/cm² UVA phototherapy, Outcome 2 Number of participants with temporary pruritus.

Comparison 6 20 J/cm2 UVA x 5 J/cm² UVA phototherapy, Outcome 3 Number of participants with increased erythema and exacerbated pain.
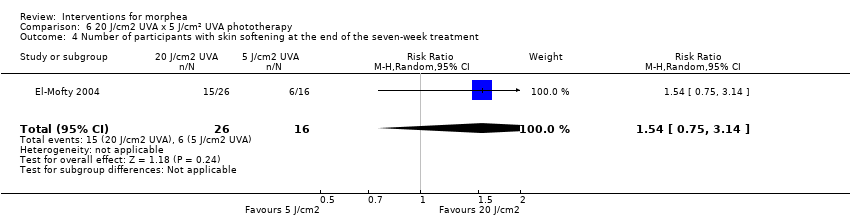
Comparison 6 20 J/cm2 UVA x 5 J/cm² UVA phototherapy, Outcome 4 Number of participants with skin softening at the end of the seven‐week treatment.

Comparison 7 10 J/cm2 UVA x 5 J/cm² UVA phototherapy, Outcome 1 Number of participants with generalised tanning.

Comparison 7 10 J/cm2 UVA x 5 J/cm² UVA phototherapy, Outcome 2 Number of participants with temporary pruritus.
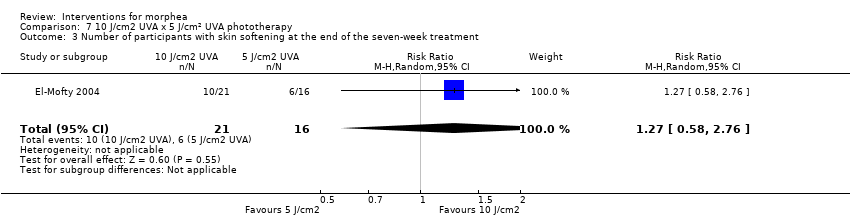
Comparison 7 10 J/cm2 UVA x 5 J/cm² UVA phototherapy, Outcome 3 Number of participants with skin softening at the end of the seven‐week treatment.

Comparison 8 Photodynamic therapy × No Treatment, Outcome 1 Number of plaques with pigmentation.
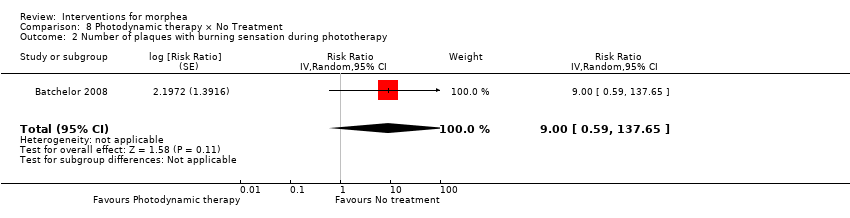
Comparison 8 Photodynamic therapy × No Treatment, Outcome 2 Number of plaques with burning sensation during phototherapy.

Comparison 8 Photodynamic therapy × No Treatment, Outcome 3 Number of plaques with dryness.

Comparison 8 Photodynamic therapy × No Treatment, Outcome 4 Number of plaques with erythema.

Comparison 8 Photodynamic therapy × No Treatment, Outcome 5 Number of plaques with pruritus.
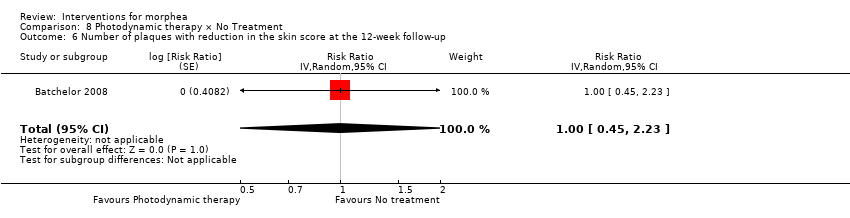
Comparison 8 Photodynamic therapy × No Treatment, Outcome 6 Number of plaques with reduction in the skin score at the 12‐week follow‐up.

Comparison 9 Fractional carbon dioxide laser × Low‐dose UVA‐1 (30 J/cm²) phototherapy, Outcome 1 Number of lesions with mild to moderate pain during therapy.

Comparison 9 Fractional carbon dioxide laser × Low‐dose UVA‐1 (30 J/cm²) phototherapy, Outcome 2 Number of lesions with marked pain during therapy.
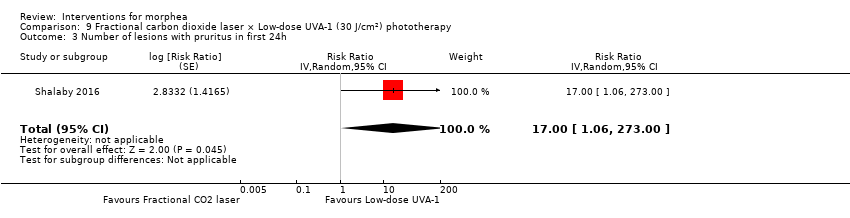
Comparison 9 Fractional carbon dioxide laser × Low‐dose UVA‐1 (30 J/cm²) phototherapy, Outcome 3 Number of lesions with pruritus in first 24h.
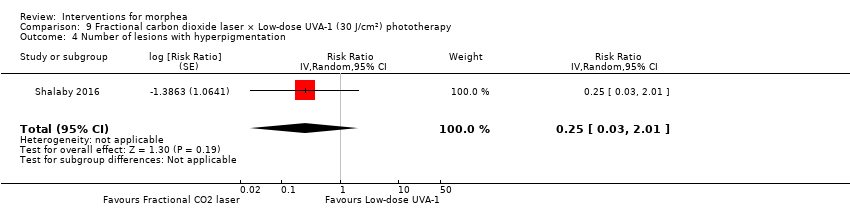
Comparison 9 Fractional carbon dioxide laser × Low‐dose UVA‐1 (30 J/cm²) phototherapy, Outcome 4 Number of lesions with hyperpigmentation.
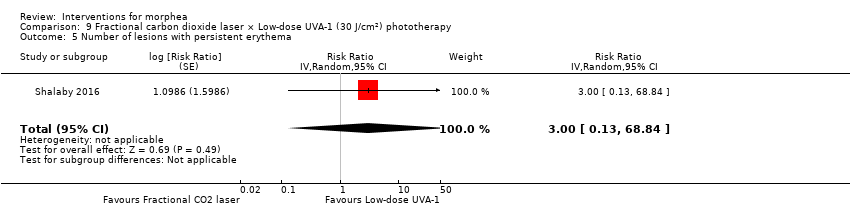
Comparison 9 Fractional carbon dioxide laser × Low‐dose UVA‐1 (30 J/cm²) phototherapy, Outcome 5 Number of lesions with persistent erythema.
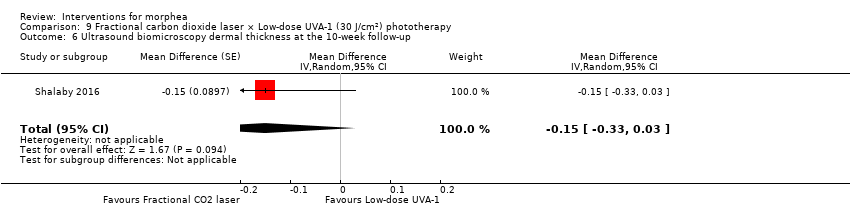
Comparison 9 Fractional carbon dioxide laser × Low‐dose UVA‐1 (30 J/cm²) phototherapy, Outcome 6 Ultrasound biomicroscopy dermal thickness at the 10‐week follow‐up.

Comparison 9 Fractional carbon dioxide laser × Low‐dose UVA‐1 (30 J/cm²) phototherapy, Outcome 7 Clinical score at the 10‐week follow‐up.
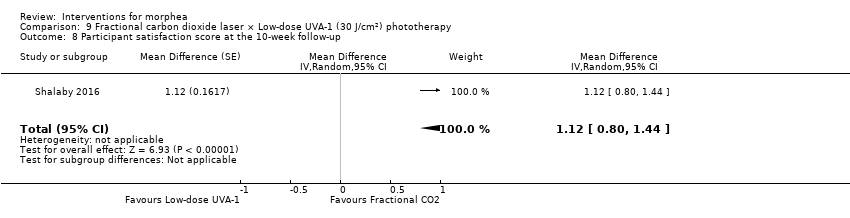
Comparison 9 Fractional carbon dioxide laser × Low‐dose UVA‐1 (30 J/cm²) phototherapy, Outcome 8 Participant satisfaction score at the 10‐week follow‐up.

Comparison 9 Fractional carbon dioxide laser × Low‐dose UVA‐1 (30 J/cm²) phototherapy, Outcome 9 Number of lesions with good or very good improvement in the clinical score at the 10‐week follow‐up.
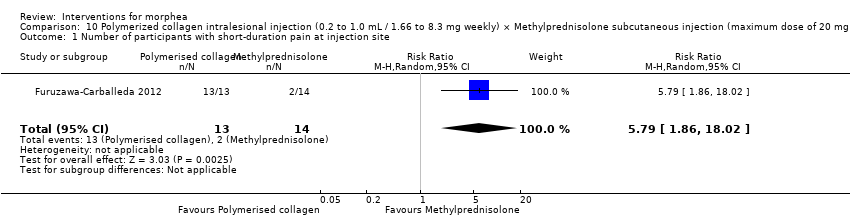
Comparison 10 Polymerized collagen intralesional injection (0.2 to 1.0 mL / 1.66 to 8.3 mg weekly) × Methylprednisolone subcutaneous injection (maximum dose of 20 mg or 5.0 mL monthly) plus placebo intralesional injection, Outcome 1 Number of participants with short‐duration pain at injection site.
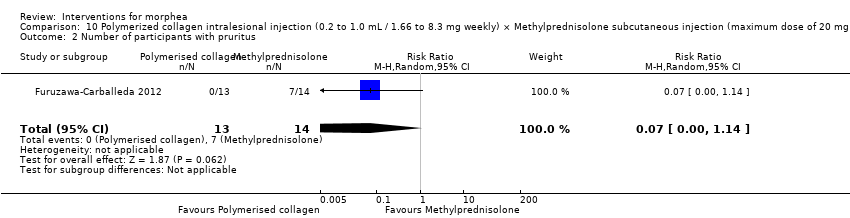
Comparison 10 Polymerized collagen intralesional injection (0.2 to 1.0 mL / 1.66 to 8.3 mg weekly) × Methylprednisolone subcutaneous injection (maximum dose of 20 mg or 5.0 mL monthly) plus placebo intralesional injection, Outcome 2 Number of participants with pruritus.

Comparison 10 Polymerized collagen intralesional injection (0.2 to 1.0 mL / 1.66 to 8.3 mg weekly) × Methylprednisolone subcutaneous injection (maximum dose of 20 mg or 5.0 mL monthly) plus placebo intralesional injection, Outcome 3 Number of participants with sclerosis.

Comparison 10 Polymerized collagen intralesional injection (0.2 to 1.0 mL / 1.66 to 8.3 mg weekly) × Methylprednisolone subcutaneous injection (maximum dose of 20 mg or 5.0 mL monthly) plus placebo intralesional injection, Outcome 4 Skin score at the end of the three‐month treatment.
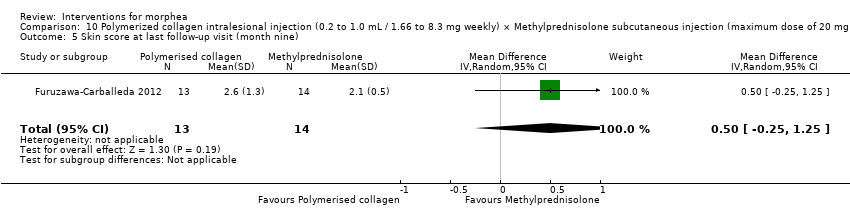
Comparison 10 Polymerized collagen intralesional injection (0.2 to 1.0 mL / 1.66 to 8.3 mg weekly) × Methylprednisolone subcutaneous injection (maximum dose of 20 mg or 5.0 mL monthly) plus placebo intralesional injection, Outcome 5 Skin score at last follow‐up visit (month nine).

Comparison 10 Polymerized collagen intralesional injection (0.2 to 1.0 mL / 1.66 to 8.3 mg weekly) × Methylprednisolone subcutaneous injection (maximum dose of 20 mg or 5.0 mL monthly) plus placebo intralesional injection, Outcome 6 Number of morphea lesions at the end of the three‐month treatment.

Comparison 11 Oral methotrexate (15 mg/m², maximum 20 mg a week) plus oral prednisone × Placebo plus oral prednisone, Outcome 1 Clinical response at the end of the 12‐month treatment.
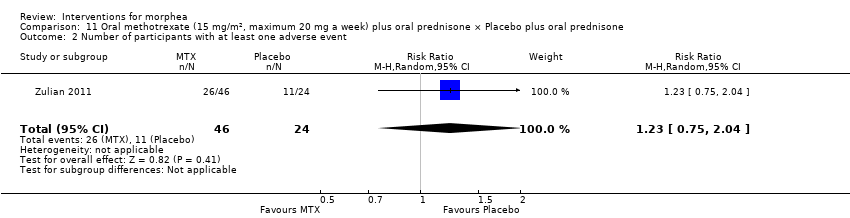
Comparison 11 Oral methotrexate (15 mg/m², maximum 20 mg a week) plus oral prednisone × Placebo plus oral prednisone, Outcome 2 Number of participants with at least one adverse event.

Comparison 11 Oral methotrexate (15 mg/m², maximum 20 mg a week) plus oral prednisone × Placebo plus oral prednisone, Outcome 3 Skin Score Rate (SSR) at the end of the 12‐month treatment.
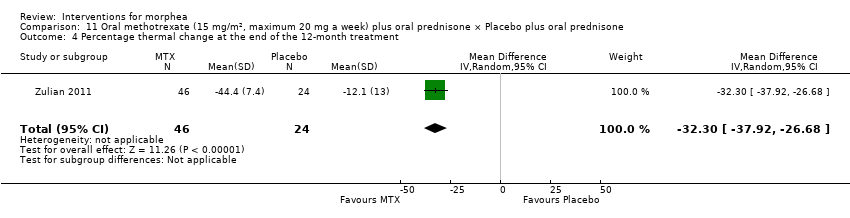
Comparison 11 Oral methotrexate (15 mg/m², maximum 20 mg a week) plus oral prednisone × Placebo plus oral prednisone, Outcome 4 Percentage thermal change at the end of the 12‐month treatment.

Comparison 11 Oral methotrexate (15 mg/m², maximum 20 mg a week) plus oral prednisone × Placebo plus oral prednisone, Outcome 5 Number of participants with new lesions at the end of the 12‐month treatment.
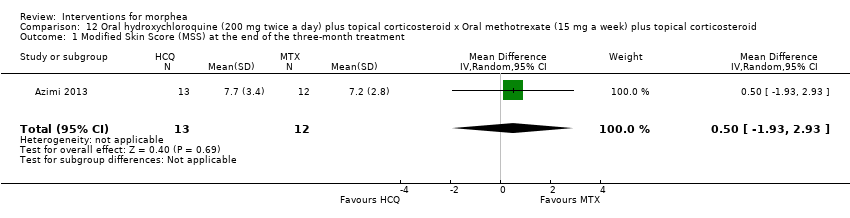
Comparison 12 Oral hydroxychloroquine (200 mg twice a day) plus topical corticosteroid x Oral methotrexate (15 mg a week) plus topical corticosteroid, Outcome 1 Modified Skin Score (MSS) at the end of the three‐month treatment.

Comparison 12 Oral hydroxychloroquine (200 mg twice a day) plus topical corticosteroid x Oral methotrexate (15 mg a week) plus topical corticosteroid, Outcome 2 Number of participants with liver enzymes rise more than three times during the three‐month treatment.

Comparison 12 Oral hydroxychloroquine (200 mg twice a day) plus topical corticosteroid x Oral methotrexate (15 mg a week) plus topical corticosteroid, Outcome 3 VAS for participants' estimate of skin tightness at the end of the three‐month treatment.

Comparison 12 Oral hydroxychloroquine (200 mg twice a day) plus topical corticosteroid x Oral methotrexate (15 mg a week) plus topical corticosteroid, Outcome 4 VAS for participants' estimate of pruritus at the end of the three‐month treatment.
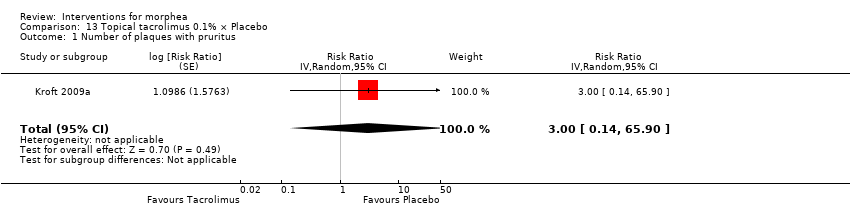
Comparison 13 Topical tacrolimus 0.1% × Placebo, Outcome 1 Number of plaques with pruritus.

Comparison 13 Topical tacrolimus 0.1% × Placebo, Outcome 2 Durometer score at the end of the 12‐week treatment.

Comparison 13 Topical tacrolimus 0.1% × Placebo, Outcome 3 Plaque surface area at the end of the 12‐week treatment.

Comparison 13 Topical tacrolimus 0.1% × Placebo, Outcome 4 Number of plaques with a reduced modified DIET score at the end of the 12‐week treatment.

Comparison 13 Topical tacrolimus 0.1% × Placebo, Outcome 5 Modified DIET score at the end of the 12‐week treatment.
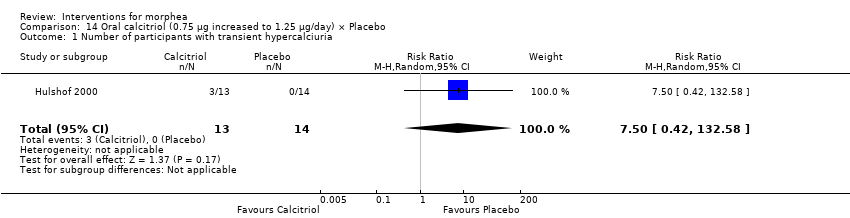
Comparison 14 Oral calcitriol (0.75 μg increased to 1.25 μg/day) × Placebo, Outcome 1 Number of participants with transient hypercalciuria.

Comparison 14 Oral calcitriol (0.75 μg increased to 1.25 μg/day) × Placebo, Outcome 2 Skin score at the end of the 9‐month treatment.
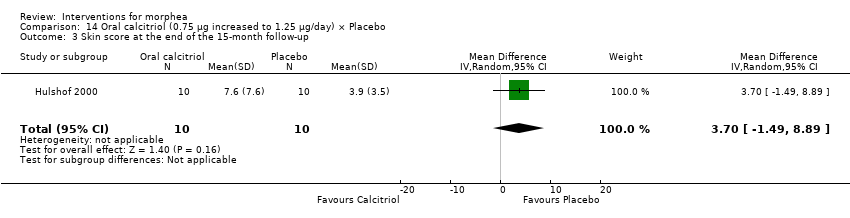
Comparison 14 Oral calcitriol (0.75 μg increased to 1.25 μg/day) × Placebo, Outcome 3 Skin score at the end of the 15‐month follow‐up.

Comparison 15 Tranilast plus topical betamethasone valerate 0.1% versus topical betamethasone valerate 0.1%, Outcome 1 Clinical score at the end of the three‐month treatment.
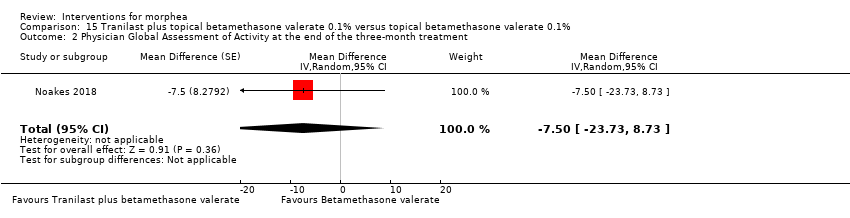
Comparison 15 Tranilast plus topical betamethasone valerate 0.1% versus topical betamethasone valerate 0.1%, Outcome 2 Physician Global Assessment of Activity at the end of the three‐month treatment.

Comparison 15 Tranilast plus topical betamethasone valerate 0.1% versus topical betamethasone valerate 0.1%, Outcome 3 Number of lesions with disease progression at the end of the three‐month treatment.
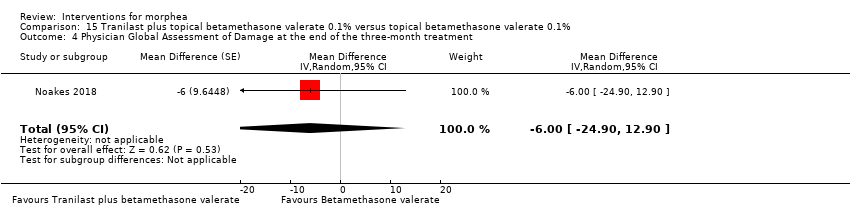
Comparison 15 Tranilast plus topical betamethasone valerate 0.1% versus topical betamethasone valerate 0.1%, Outcome 4 Physician Global Assessment of Damage at the end of the three‐month treatment.

Comparison 16 Traditional Chinese Medicine herbal tea plus herbal oil and vitamin B6 x Phenoxymethylpenicillin plus DAC base cream, Outcome 1 Number of participants with adverse events.
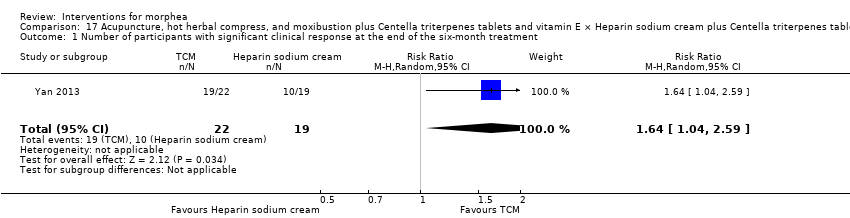
Comparison 17 Acupuncture, hot herbal compress, and moxibustion plus Centella triterpenes tablets and vitamin E × Heparin sodium cream plus Centella triterpenes tablets and vitamin E, Outcome 1 Number of participants with significant clinical response at the end of the six‐month treatment.
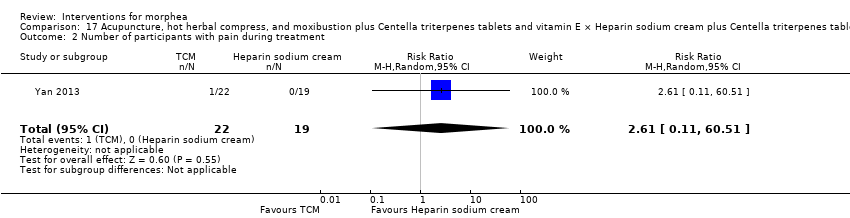
Comparison 17 Acupuncture, hot herbal compress, and moxibustion plus Centella triterpenes tablets and vitamin E × Heparin sodium cream plus Centella triterpenes tablets and vitamin E, Outcome 2 Number of participants with pain during treatment.
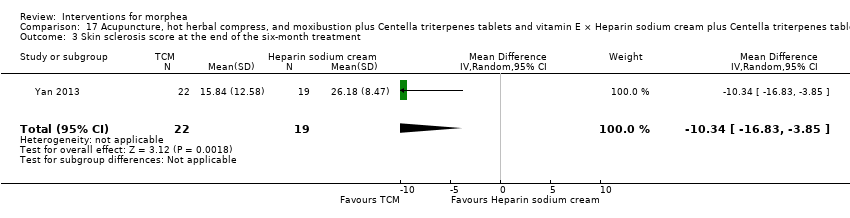
Comparison 17 Acupuncture, hot herbal compress, and moxibustion plus Centella triterpenes tablets and vitamin E × Heparin sodium cream plus Centella triterpenes tablets and vitamin E, Outcome 3 Skin sclerosis score at the end of the six‐month treatment.

Comparison 17 Acupuncture, hot herbal compress, and moxibustion plus Centella triterpenes tablets and vitamin E × Heparin sodium cream plus Centella triterpenes tablets and vitamin E, Outcome 4 Joint function score at the end of the six‐month treatment period.
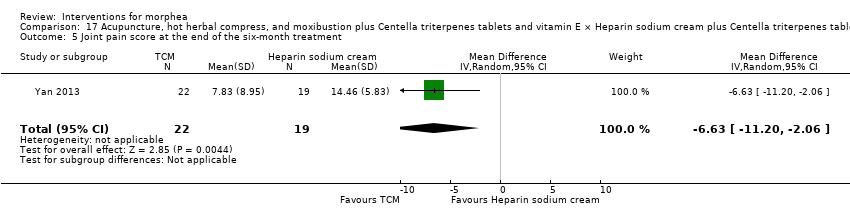
Comparison 17 Acupuncture, hot herbal compress, and moxibustion plus Centella triterpenes tablets and vitamin E × Heparin sodium cream plus Centella triterpenes tablets and vitamin E, Outcome 5 Joint pain score at the end of the six‐month treatment.
| Oral methotrexate and oral prednisone compared to placebo and oral prednisone for juvenile morphea | ||||||
| Patient or population: children and adolescents with active morphea (linear scleroderma, generalised morphea and mixed subtype: linear and circumscribed). | ||||||
| Outcomes | Anticipated absolute effects* (95% CI) | Relative effect | № of participants | Quality of the evidence | Comments | |
| Risk with placebo plus folic acid supplementation and oral prednisone | Risk with oral methotrexate plus folic acid supplementation and oral prednisone | |||||
| Primary outcome: Global improvement of disease activity or damage assessed by a medical practitioner or by participants | Children and adolescents with morphea | RR 2.31 | 70 | ⊕⊕⊝⊝ | ||
| 292 per 1000 | 674 per 1000 | |||||
| Primary outcome: Adverse effects | Children and adolescents with morphea | RR 1.23 | 70 | ⊕⊝⊝⊝ | ||
| 458 per 1000 | 564 per 1000 | |||||
| Secondary outcome: Improvement of disease activity (reduction in lesion size) | The mean SSR was 1.1 | MD 0.31 lower | ‐ | 70 | ⊕⊕⊝⊝ | |
| Secondary outcome: Improvement of disease damage | See comment | ‐ | 70 | ‐ | Authors reported no significant differences between groups in the Childhood Health Assessment Questionnaire (C‐HAQ) disability index, but reported no numerical data. | |
| *The risk in the intervention group (and its 95% CI) is based on the assumed risk in the comparison group and the relative effect of the intervention (and its 95% CI). | ||||||
| GRADE Working Group grades of evidence | ||||||
| aDowngraded by 2 levels to low quality evidence. 1 level due to unclear risk of selection bias (allocation concealment) and high risk of reporting bias (selective reporting). Downgraded by 1 level due to small number of events (less than 300 events). bDowngraded by 2 levels to low quality evidence. 1 level due to unclear risk of selection bias (allocation concealment) and high risk of reporting bias (selective reporting). Downgraded by 1 level due to small number of events (less than 300 events) and wide confidence interval (includes both null effect and appreciable harm). cDowngraded by 2 levels to low quality evidence. 1 level due to unclear risk of selection bias (allocation concealment) and high risk of reporting bias (selective reporting). Downgraded by 1 level due to small number of participants (less than 400 participants). | ||||||
| Medium‐dose UVA‐1 phototherapy (50 J/cm²) compared to low‐dose UVA‐1 phototherapy (20 J/cm²) for morphea | ||||||
| Patient or population: children and adults with active morphea (circumscribed morphea, linear scleroderma (with trunk/limb variant and head variant), generalised morphea, or mixed morphea). | ||||||
| Outcomes | Anticipated absolute effects* (95% CI) | Relative effect | № of participants | Quality of the evidence | Comments | |
| Risk with low‐dose UVA‐1 phototherapy (20 J/cm²) | Risk with Medium‐dose UVA‐1 phototherapy (50 J/cm²) | |||||
| Primary outcome: Global improvement of disease activity or damage assessed by a medical practitioner or by participants | The mean score (MSS) was 5 | MD 1.60 more | ‐ | 44 | ⊕⊝⊝⊝ | |
| Primary outcome: Adverse effects | Individuals with morphea | RR 1.00 | 44 | ⊕⊝⊝⊝ | ||
| 1000 per 1000 | 1000 per 1000 | |||||
| Secondary outcome: Improvement of disease activity (skin softening) | The mean ultrasound score was 69 | MD 16.43 lower | ‐ | 36 | ⊕⊝⊝⊝ | |
| Secondary outcome: Improvement of disease damage ‒ not measured | See comment | ‐ | ‐ | ‐ | There was no measure of this outcome for this comparison. | |
| *The risk in the intervention group (and its 95% CI) is based on the assumed risk in the comparison group and the relative effect of the intervention (and its 95% CI). CI: Confidence interval; RR: Risk ratio; OR: Odds ratio; | ||||||
| GRADE Working Group grades of evidence | ||||||
| aDowngraded by 2 levels to low quality evidence. 1 level due to high risk of performance bias (blinding of participants and personnel), detection bias (blinding of outcome assessment) and reporting bias (selective reporting). Downgraded by 1 level due to small number of participants (less than 400 participants). bDowngraded by 2 levels to low quality evidence. 1 level due to high risk of performance bias (blinding of participants and personnel), detection bias (blinding of outcome assessment) and reporting bias (selective reporting). Downgraded by 1 level due to small number of events (less than 300 events). cDowngraded by 2 levels to low quality evidence. 1 level due to high risk of performance bias (blinding of participants and personnel), detection bias (blinding of outcome assessment) and reporting bias (selective reporting). Downgraded by 1 level due to small number of participants (less than 400 participants) and wide confidence interval (includes both null effect and appreciable benefit). | ||||||
| Narrowband UVB phototherapy compared to medium‐dose UVA‐1 phototherapy (50 J/cm2) for morphea | ||||||
| Patient or population: children and adults with active morphea (circumscribed morphea, linear scleroderma (with trunk/limb variant and head variant), generalised morphea, or mixed morphea). | ||||||
| Outcomes | Anticipated absolute effects* (95% CI) | Relative effect | № of participants | Quality of the evidence | Comments | |
| Risk with medium‐dose UVA‐1 phototherapy (50 J/cm2) | Risk with Narrowband UVB phototherapy | |||||
| Primary outcome: Global improvement of disease activity or damage assessed by a medical practitioner or by participants | The mean score (MSS) was 6.6 | MD 1.70 lower | ‐ | 35 | ⊕⊝⊝⊝ | |
| Primary outcome: Adverse effects | Individuals with morphea | RR 0.03 | 35 | ⊕⊝⊝⊝ | ||
| 1000 per 1000 | 30 per 1000 | |||||
| Secondary outcome: Improvement of disease activity (skin softening) | The mean ultrasound score was 52.57 | MD 17.78 higher | ‐ | 28 | ⊕⊝⊝⊝ | |
| Secondary outcome: Improvement of disease damage ‐ not measured | See comment | ‐ | ‐ | ‐ | There was no measure of this outcome for this comparison. | |
| *The risk in the intervention group (and its 95% CI) is based on the assumed risk in the comparison group and the relative effect of the intervention (and its 95% CI). | ||||||
| GRADE Working Group grades of evidence | ||||||
| aDowngraded by 2 levels to low quality evidence. 1 level due to high risk of performance bias (blinding of participants and personnel), detection bias (blinding of outcome assessment) and reporting bias (selective reporting). Downgraded by 1 level due to small number of participants (less than 400 participants). bDowngraded by 2 levels to low quality evidence. 1 level due to high risk of performance bias (blinding of participants and personnel), detection bias (blinding of outcome assessment) and reporting bias (selective reporting). Downgraded by 1 level due to small number of events (less than 300 events). cDowngraded by 2 levels to low quality evidence. 1 level due to high risk of performance bias (blinding of participants and personnel), detection bias (blinding of outcome assessment) and reporting bias (selective reporting). Downgraded by 1 level due to small number of participants (less than 400 participants) and wide confidence interval (includes both null effect and appreciable benefit). | ||||||
| Narrowband UVB compared to low‐dose UVA‐1 phototherapy (20 J/cm2) for morphea | ||||||
| Patient or population: children and adults with active morphea (circumscribed morphea, linear scleroderma (with trunk/limb variant and head variant), generalised morphea, or mixed morphea). | ||||||
| Outcomes | Anticipated absolute effects* (95% CI) | Relative effect | № of participants | Quality of the evidence | Comments | |
| Risk with low‐dose UVA‐1 phototherapy (20 J/cm2) | Risk with Narrowband UVB | |||||
| Primary outcome: Global improvement of disease activity or damage assessed by a medical practitioner or by participants | The mean score (MSS) was 5 | MD 0.10 lower | ‐ | 45 | ⊕⊝⊝⊝ | |
| Primary outcome: Adverse effects | Individuals with morphea | RR 0.03 | 45 | ⊕⊝⊝⊝ Low b | ||
| 1000 per 1000 | 30 per 1000 | |||||
| Secondary outcome: Improvement of disease activity (skin softening) | The mean ultrasound score was 69 | MD 1.35 higher | ‐ | 32 | ⊕⊝⊝⊝ | |
| Secondary outcome: Improvement of disease damage ‐ not measured | See comment | ‐ | ‐ | ‐ | There was no measure of this outcome for this comparison. | |
| *The risk in the intervention group (and its 95% CI) is based on the assumed risk in the comparison group and the relative effect of the intervention (and its 95% CI). | ||||||
| GRADE Working Group grades of evidence | ||||||
| aDowngraded by 2 levels to low quality evidence. 1 level due to high risk of performance bias (blinding of participants and personnel), detection bias (blinding of outcome assessment) and reporting bias (selective reporting). Downgraded by 1 level due to small number of participants (less than 400 participants). bDowngraded by 2 levels to low quality evidence. 1 level due to high risk of performance bias (blinding of participants and personnel), detection bias (blinding of outcome assessment) and reporting bias (selective reporting). Downgraded by 1 level due to small number of events (less than 300 events). cDowngraded by 3 levels to very low quality evidence. 1 level due to high risk of performance bias (blinding of participants and personnel), detection bias (blinding of outcome assessment) and reporting bias (selective reporting). Downgraded by 2 levels due to small number of participants (less than 400 participants) and wide confidence interval (includes both null effect and appreciable benefit). | ||||||
| Term | Definition |
| ALA | 5‐aminolaevulinic acid |
| BB | broad‐band |
| CDLQI | Children's Dermatology Life Quality Index |
| C‐HAQ | Childhood Health Assessment Questionnaire |
| CI | confidence interval |
| CO₂ | carbon dioxide |
| DIET | dyspigmentation, induration, erythema, telangiectasia |
| DLQI | Dermatology Life Quality Index |
| DNA | deoxyribonucleic acid |
| HCQ | hydroxychloroquine |
| IFN‐γ | interferon gamma |
| ITT | intention‐to‐treat |
| ISDL | Impact of Chronic Skin Disease on Daily Life scale |
| LoSCAT | Localized Scleroderma Cutaneous Assessment Tool |
| LoSDI | Localized Scleroderma Skin Damage Index |
| LoSSI | Localized Scleroderma Skin Severity Index |
| mLoSSI | Modified Localized Scleroderma Skin Severity Index |
| mRSS | Modified Rodnan Skin Score |
| MD | mean difference |
| MHz | megahertz |
| MSS | modified skin score |
| MTX | methotrexate |
| NNT | number needed to treat |
| PDT | photodynamic therapy |
| PGA‐D | Physician Global Assessment of disease Damage |
| PtGA‐S | Patient Global Assessment of disease Severity |
| PUVA | psoralen plus ultraviolet A |
| RCT | randomised controlled trial |
| RR | risk ratio |
| RSS | Rodnan skin score |
| SMD | standardised mean differences |
| SSc | systemic sclerosis |
| SSR | skin score rate |
| UV | ultraviolet |
| UVA | ultraviolet A |
| UVB | ultraviolet B |
| VAS | visual analogue scale |
| ΔTh% | percentage thermal change from baseline |
| Study ID | Date contacted | Information requested | Date of reply |
| 26 April 2016, 4 July 2016 | The register of the trial, ethics committee approval and funding source; If it was a single‐centre or double‐centre study; The methods used to generate the random sequence and to conceal it; If the outcome assessor was blinded from knowledge of which intervention a participant received; If authors could provide separate data for children and adults; What was the type of morphea and the sex of the four participants who discontinued the treatment. | 26 April 2016, 5 July 2016 | |
| 26 April 2016, 4 July 2016 | If the study was conducted both at the Dermatologic Centre Ladislado de la Pascua and at the department of Immunology and Rheumatology of the National Institute of Medical Sciences and Nutrition Salvador Zubirán; If the trial was registered and received funding; If there were significant baseline differences between the intervention groups; The method used to conceal the random sequence; If authors could provide the baseline mRSS for the intervention groups separately; If authors could provide the numerical data for adverse events. | 26 April 2016, 7 July 2016 | |
| 26 April 2016, 3 October 2016 | The register of the trial, ethics committee approval, funding source and declaration of interests; The method used to conceal the random sequence; If the outcome assessor of skin score was blinded from knowledge of which intervention a participant received; What was the duration of the follow‐up after treatment; If authors could provide VAS data with standard deviation. | 4 October 2016 | |
| 10 June 2017, 22 July 2018, 26 July 2018, 28 July 2018 | If this study was completed, and if authors have published the results or could provide data; If the trial received funding; The method used to conceal the random sequence; If outcome assessors were blinded from knowledge of which intervention a participant received; If the LoSCAT, PGA‐A and the PGA‐D included only participants with morphea; If there were baseline differences between treatment sites; If any participant left the study before completion; If authors could provide standard deviation values or raw data from the treatment sites. | 11 June 2017, 23 July 2018 27 July 2018 | |
| 26 April 2016, 3 October 2016 | The register of the trial, ethics committee approval, funding source and declaration of interests; The methods used to generate the random sequence and to conceal it; If outcome assessors were blinded from knowledge of which intervention a participant received; If authors included the four participants who experienced side effects in the analysis after treatment; If authors could provide data of the planimetry and skin thickness assessments with standard deviation. | 28 April 2016 | |
| 4 July 2016 | If this study was completed, and if authors have published the results or could provide data. | 7 July 2016 |
| Outcome or subgroup title | No. of studies | No. of participants | Statistical method | Effect size |
| 1 Modified Skin Score (MSS) at the end of the eight‐week treatment Show forest plot | 1 | 44 | Mean Difference (IV, Random, 95% CI) | 1.60 [‐1.70, 4.90] |
| 2 Modified Skin Score (MSS) at last follow‐up visit (week 20) Show forest plot | 1 | 44 | Mean Difference (IV, Random, 95% CI) | 2.5 [‐1.90, 6.90] |
| 3 Number of participants with mild tanning Show forest plot | 1 | 44 | Risk Ratio (M‐H, Random, 95% CI) | 1.0 [0.91, 1.10] |
| 4 Ultrasound dermal density at the end of the eight‐week treatment Show forest plot | 1 | 36 | Mean Difference (IV, Random, 95% CI) | ‐16.43 [‐34.87, 2.01] |
| 5 Ultrasound corium thickness at the end of the eight‐week treatment Show forest plot | 1 | 36 | Mean Difference (IV, Random, 95% CI) | 196.29 [‐162.28, 554.86] |
| Outcome or subgroup title | No. of studies | No. of participants | Statistical method | Effect size |
| 1 Modified Skin Score (MSS) at the end of the eight‐week treatment Show forest plot | 1 | 35 | Mean Difference (IV, Random, 95% CI) | ‐1.70 [‐5.27, 1.87] |
| 2 Modified Skin Score (MSS) at last follow‐up visit (week 20) Show forest plot | 1 | 35 | Mean Difference (IV, Random, 95% CI) | ‐2.10 [‐6.73, 2.53] |
| 3 Number of participants with mild tanning Show forest plot | 1 | 35 | Risk Ratio (M‐H, Random, 95% CI) | 0.03 [0.00, 0.42] |
| 4 Number of participants with transient erythema Show forest plot | 1 | 35 | Risk Ratio (M‐H, Random, 95% CI) | 6.63 [0.37, 119.59] |
| 5 Ultrasound dermal density at the end of the eight‐week treatment Show forest plot | 1 | 28 | Mean Difference (IV, Random, 95% CI) | 17.78 [‐6.08, 41.64] |
| 6 Ultrasound corium thickness at the end of the eight‐week treatment Show forest plot | 1 | 28 | Mean Difference (IV, Random, 95% CI) | ‐78.35 [‐528.59, 371.89] |
| Outcome or subgroup title | No. of studies | No. of participants | Statistical method | Effect size |
| 1 Modified Skin Score (MSS) at the end of the eight‐week treatment Show forest plot | 1 | 45 | Mean Difference (IV, Random, 95% CI) | ‐0.10 [‐2.49, 2.29] |
| 2 Modified Skin Score (MSS) at last follow‐up visit (week 20) Show forest plot | 1 | 45 | Mean Difference (IV, Random, 95% CI) | 0.40 [‐2.17, 2.97] |
| 3 Number of participants with mild tanning Show forest plot | 1 | 45 | Risk Ratio (M‐H, Random, 95% CI) | 0.03 [0.00, 0.41] |
| 4 Number of participants with transient erythema Show forest plot | 1 | 45 | Risk Ratio (M‐H, Random, 95% CI) | 10.32 [0.56, 188.49] |
| 5 Ultrasound dermal density at the end of the eight‐week treatment Show forest plot | 1 | 32 | Mean Difference (IV, Random, 95% CI) | 1.35 [‐19.39, 22.09] |
| 6 Ultrasound corium thickness at the end of the eight‐week treatment Show forest plot | 1 | 32 | Mean Difference (IV, Random, 95% CI) | 117.94 [‐311.20, 547.08] |
| Outcome or subgroup title | No. of studies | No. of participants | Statistical method | Effect size |
| 1 Number of plaques with moderate to significant tanning Show forest plot | 1 | Risk Ratio (Random, 95% CI) | 29.00 [1.90, 443.28] | |
| 2 Number of plaques with painless erythema Show forest plot | 1 | Risk Ratio (Random, 95% CI) | 4.41 [0.23, 84.79] | |
| 3 Number of plaques with pruritus Show forest plot | 1 | Risk Ratio (Random, 95% CI) | 4.41 [0.23, 84.79] | |
| Outcome or subgroup title | No. of studies | No. of participants | Statistical method | Effect size |
| 1 Number of participants with generalised tanning Show forest plot | 1 | 47 | Risk Ratio (M‐H, Random, 95% CI) | 1.0 [0.92, 1.09] |
| 2 Number of participants with temporary pruritus Show forest plot | 1 | 47 | Risk Ratio (M‐H, Random, 95% CI) | 0.81 [0.18, 3.60] |
| 3 Number of participants with increased erythema and exacerbated pain Show forest plot | 1 | 47 | Risk Ratio (M‐H, Random, 95% CI) | 2.44 [0.10, 57.08] |
| 4 Number of participants with skin softening at the end of the seven‐week treatment Show forest plot | 1 | 47 | Risk Ratio (M‐H, Random, 95% CI) | 1.21 [0.69, 2.11] |
| Outcome or subgroup title | No. of studies | No. of participants | Statistical method | Effect size |
| 1 Number of participants with generalised tanning Show forest plot | 1 | 42 | Risk Ratio (M‐H, Random, 95% CI) | 1.0 [0.91, 1.10] |
| 2 Number of participants with temporary pruritus Show forest plot | 1 | 42 | Risk Ratio (M‐H, Random, 95% CI) | 0.62 [0.14, 2.69] |
| 3 Number of participants with increased erythema and exacerbated pain Show forest plot | 1 | 42 | Risk Ratio (M‐H, Random, 95% CI) | 1.89 [0.08, 43.75] |
| 4 Number of participants with skin softening at the end of the seven‐week treatment Show forest plot | 1 | 42 | Risk Ratio (M‐H, Random, 95% CI) | 1.54 [0.75, 3.14] |
| Outcome or subgroup title | No. of studies | No. of participants | Statistical method | Effect size |
| 1 Number of participants with generalised tanning Show forest plot | 1 | 37 | Risk Ratio (M‐H, Random, 95% CI) | 1.0 [0.90, 1.11] |
| 2 Number of participants with temporary pruritus Show forest plot | 1 | 37 | Risk Ratio (M‐H, Random, 95% CI) | 0.76 [0.18, 3.29] |
| 3 Number of participants with skin softening at the end of the seven‐week treatment Show forest plot | 1 | 37 | Risk Ratio (M‐H, Random, 95% CI) | 1.27 [0.58, 2.76] |
| Outcome or subgroup title | No. of studies | No. of participants | Statistical method | Effect size |
| 1 Number of plaques with pigmentation Show forest plot | 1 | Risk Ratio (Random, 95% CI) | 13.00 [0.89, 189.38] | |
| 2 Number of plaques with burning sensation during phototherapy Show forest plot | 1 | Risk Ratio (Random, 95% CI) | 9.00 [0.59, 137.65] | |
| 3 Number of plaques with dryness Show forest plot | 1 | Risk Ratio (Random, 95% CI) | 3.00 [0.15, 61.73] | |
| 4 Number of plaques with erythema Show forest plot | 1 | Risk Ratio (Random, 95% CI) | 5.00 [0.29, 86.43] | |
| 5 Number of plaques with pruritus Show forest plot | 1 | Risk Ratio (Random, 95% CI) | 3.00 [0.15, 61.73] | |
| 6 Number of plaques with reduction in the skin score at the 12‐week follow‐up Show forest plot | 1 | Risk Ratio (Random, 95% CI) | 1.0 [0.45, 2.23] | |
| Outcome or subgroup title | No. of studies | No. of participants | Statistical method | Effect size |
| 1 Number of lesions with mild to moderate pain during therapy Show forest plot | 1 | Risk Ratio (Random, 95% CI) | 35.00 [2.27, 538.86] | |
| 2 Number of lesions with marked pain during therapy Show forest plot | 1 | Risk Ratio (Random, 95% CI) | 21.00 [1.33, 332.06] | |
| 3 Number of lesions with pruritus in first 24h Show forest plot | 1 | Risk Ratio (Random, 95% CI) | 17.00 [1.06, 273.00] | |
| 4 Number of lesions with hyperpigmentation Show forest plot | 1 | Risk Ratio (Random, 95% CI) | 0.25 [0.03, 2.01] | |
| 5 Number of lesions with persistent erythema Show forest plot | 1 | Risk Ratio (Random, 95% CI) | 3.00 [0.13, 68.84] | |
| 6 Ultrasound biomicroscopy dermal thickness at the 10‐week follow‐up Show forest plot | 1 | Mean Difference (Random, 95% CI) | ‐0.15 [‐0.33, 0.03] | |
| 7 Clinical score at the 10‐week follow‐up Show forest plot | 1 | Mean Difference (Random, 95% CI) | ‐1.59 [‐2.82, ‐0.36] | |
| 8 Participant satisfaction score at the 10‐week follow‐up Show forest plot | 1 | Mean Difference (Random, 95% CI) | 1.12 [0.80, 1.44] | |
| 9 Number of lesions with good or very good improvement in the clinical score at the 10‐week follow‐up Show forest plot | 1 | Risk Ratio (Random, 95% CI) | 2.67 [1.39, 5.13] | |
| Outcome or subgroup title | No. of studies | No. of participants | Statistical method | Effect size |
| 1 Number of participants with short‐duration pain at injection site Show forest plot | 1 | 27 | Risk Ratio (M‐H, Random, 95% CI) | 5.79 [1.86, 18.02] |
| 2 Number of participants with pruritus Show forest plot | 1 | 27 | Risk Ratio (M‐H, Random, 95% CI) | 0.07 [0.00, 1.14] |
| 3 Number of participants with sclerosis Show forest plot | 1 | 27 | Risk Ratio (M‐H, Random, 95% CI) | 0.36 [0.02, 8.06] |
| 4 Skin score at the end of the three‐month treatment Show forest plot | 1 | 27 | Mean Difference (IV, Random, 95% CI) | 1.30 [0.31, 2.29] |
| 5 Skin score at last follow‐up visit (month nine) Show forest plot | 1 | 27 | Mean Difference (IV, Random, 95% CI) | 0.5 [‐0.25, 1.25] |
| 6 Number of morphea lesions at the end of the three‐month treatment Show forest plot | 1 | 27 | Mean Difference (IV, Random, 95% CI) | 0.20 [‐0.16, 0.56] |
| Outcome or subgroup title | No. of studies | No. of participants | Statistical method | Effect size |
| 1 Clinical response at the end of the 12‐month treatment Show forest plot | 1 | 70 | Risk Ratio (M‐H, Random, 95% CI) | 2.31 [1.20, 4.45] |
| 2 Number of participants with at least one adverse event Show forest plot | 1 | 70 | Risk Ratio (M‐H, Random, 95% CI) | 1.23 [0.75, 2.04] |
| 3 Skin Score Rate (SSR) at the end of the 12‐month treatment Show forest plot | 1 | 70 | Mean Difference (IV, Random, 95% CI) | ‐0.31 [‐0.35, ‐0.27] |
| 4 Percentage thermal change at the end of the 12‐month treatment Show forest plot | 1 | 70 | Mean Difference (IV, Random, 95% CI) | ‐32.3 [‐37.92, ‐26.68] |
| 5 Number of participants with new lesions at the end of the 12‐month treatment Show forest plot | 1 | 70 | Risk Ratio (M‐H, Random, 95% CI) | 0.39 [0.10, 1.61] |
| Outcome or subgroup title | No. of studies | No. of participants | Statistical method | Effect size |
| 1 Modified Skin Score (MSS) at the end of the three‐month treatment Show forest plot | 1 | 25 | Mean Difference (IV, Random, 95% CI) | 0.5 [‐1.93, 2.93] |
| 2 Number of participants with liver enzymes rise more than three times during the three‐month treatment Show forest plot | 1 | 25 | Risk Ratio (M‐H, Random, 95% CI) | 0.13 [0.01, 2.33] |
| 3 VAS for participants' estimate of skin tightness at the end of the three‐month treatment Show forest plot | 1 | 25 | Mean Difference (IV, Random, 95% CI) | 0.30 [‐0.49, 1.09] |
| 4 VAS for participants' estimate of pruritus at the end of the three‐month treatment Show forest plot | 1 | 25 | Mean Difference (IV, Random, 95% CI) | ‐2.3 [‐3.25, ‐1.35] |
| Outcome or subgroup title | No. of studies | No. of participants | Statistical method | Effect size |
| 1 Number of plaques with pruritus Show forest plot | 1 | Risk Ratio (Random, 95% CI) | 3.00 [0.14, 65.90] | |
| 2 Durometer score at the end of the 12‐week treatment Show forest plot | 1 | Mean Difference (Random, 95% CI) | 47.2 [‐44.55, 138.95] | |
| 3 Plaque surface area at the end of the 12‐week treatment Show forest plot | 1 | Mean Difference (Random, 95% CI) | 0.5 [‐38.35, 39.35] | |
| 4 Number of plaques with a reduced modified DIET score at the end of the 12‐week treatment Show forest plot | 1 | Risk Ratio (Random, 95% CI) | 1.14 [0.69, 1.90] | |
| 5 Modified DIET score at the end of the 12‐week treatment Show forest plot | 1 | Mean Difference (Random, 95% CI) | ‐1.7 [‐3.11, ‐0.29] | |
| Outcome or subgroup title | No. of studies | No. of participants | Statistical method | Effect size |
| 1 Number of participants with transient hypercalciuria Show forest plot | 1 | 27 | Risk Ratio (M‐H, Random, 95% CI) | 7.50 [0.42, 132.58] |
| 2 Skin score at the end of the 9‐month treatment Show forest plot | 1 | 20 | Mean Difference (IV, Random, 95% CI) | 1.10 [‐2.98, 5.18] |
| 3 Skin score at the end of the 15‐month follow‐up Show forest plot | 1 | 20 | Mean Difference (IV, Random, 95% CI) | 3.70 [‐1.49, 8.89] |
| Outcome or subgroup title | No. of studies | No. of participants | Statistical method | Effect size |
| 1 Clinical score at the end of the three‐month treatment Show forest plot | 1 | Mean Difference (Random, 95% CI) | ‐1.5 [‐3.88, 0.88] | |
| 2 Physician Global Assessment of Activity at the end of the three‐month treatment Show forest plot | 1 | Mean Difference (Random, 95% CI) | ‐7.5 [‐23.73, 8.73] | |
| 3 Number of lesions with disease progression at the end of the three‐month treatment Show forest plot | 1 | Risk Ratio (Random, 95% CI) | 0.24 [0.01, 4.47] | |
| 4 Physician Global Assessment of Damage at the end of the three‐month treatment Show forest plot | 1 | Mean Difference (Random, 95% CI) | ‐6.00 [‐24.90, 12.90] | |
| Outcome or subgroup title | No. of studies | No. of participants | Statistical method | Effect size |
| 1 Number of participants with adverse events Show forest plot | 1 | 24 | Risk Ratio (M‐H, Random, 95% CI) | 1.0 [0.17, 5.98] |
| Outcome or subgroup title | No. of studies | No. of participants | Statistical method | Effect size |
| 1 Number of participants with significant clinical response at the end of the six‐month treatment Show forest plot | 1 | 41 | Risk Ratio (M‐H, Random, 95% CI) | 1.64 [1.04, 2.59] |
| 2 Number of participants with pain during treatment Show forest plot | 1 | 41 | Risk Ratio (M‐H, Random, 95% CI) | 2.61 [0.11, 60.51] |
| 3 Skin sclerosis score at the end of the six‐month treatment Show forest plot | 1 | 41 | Mean Difference (IV, Random, 95% CI) | ‐10.34 [‐16.83, ‐3.85] |
| 4 Joint function score at the end of the six‐month treatment period Show forest plot | 1 | 41 | Mean Difference (IV, Random, 95% CI) | ‐1.65 [‐2.95, ‐0.35] |
| 5 Joint pain score at the end of the six‐month treatment Show forest plot | 1 | 41 | Mean Difference (IV, Random, 95% CI) | ‐6.63 [‐11.20, ‐2.06] |