Interventions for morphea
Abstract
Background
Morphea (morphoea) is an immune‐mediated disease in which excess synthesis and deposition of collagen in the skin and underlying connective tissues results in hardened cutaneous areas. Morphea has different clinical features according to the subtype and stage of evolution of the disease. There is currently no consensus on optimal interventions for morphea.
Objectives
To assess the effects of treatments for people with any form of morphea.
Search methods
We searched the following databases up to July 2018: the Cochrane Skin Specialised Register, CENTRAL, MEDLINE, Embase, LILACS, and five trial registers. We checked the reference lists of included studies for further references to relevant randomised controlled trials.
Selection criteria
Randomised controlled trials of topical, intralesional, or systemic treatments (isolated or combined) in anyone who has been clinically diagnosed by a medical practitioner with any form of morphea. Eligible controls were placebo, no intervention, any other treatment, or different doses or duration of a treatment.
Data collection and analysis
We used standard methodological procedures expected by Cochrane. The primary outcomes were global improvement of disease activity or damage assessed by a medical practitioner or by participants, and adverse effects. Secondary outcomes were improvement of disease activity and improvement of disease damage. We used GRADE to assess the quality of the evidence for each outcome.
Main results
We included 14 trials, with a total of 429 randomised participants, aged between 3 and 76 years. There were juvenile and adult participants; over half were female, and the majority had circumscribed morphea, followed by linear scleroderma. The settings of the studies (where described) included a dermatologic centre, a national laboratory centre, paediatric rheumatology and dermatology centres, and a university hospital or medical centre.
The studies evaluated heterogenous therapies for different types of morphea, covering a wide range of comparisons. We were unable to conduct any meta‐analyses. Seven studies investigated topical medications, two evaluated intralesional medications, and five investigated systemic medications. The study duration ranged from seven weeks to 15 months from baseline.
We present here results for our primary outcomes for our four key comparisons. All of these results are based on low‐quality evidence.
The included studies were at high risk of performance, detection, attrition, and reporting bias.
Global improvement of disease activity or damage after treatment may be higher with oral methotrexate (15 mg/m², maximum 20 mg, once a week, for 12 months or until disease flare) plus oral prednisone (1 mg/kg a day, maximum of 50 mg, in a single morning dose, for three months, and one month with gradually decreased dose until discontinuation) than with placebo plus oral prednisone in children and adolescents with active morphea (linear scleroderma, generalised morphea or mixed morphea: linear and circumscribed) (risk ratio (RR) 2.31, 95% confidence interval (CI) 1.20 to 4.45; number needed to treat for an additional beneficial outcome (NNTB) 3; 1 randomised controlled trial (RCT); 70 participants, all juvenile). This outcome was measured 12 months from the start of treatment or until flare of the disease. Data were not available separately for each morphea type. There may be little or no difference in the number of participants experiencing at least one adverse event with oral methotrexate (26/46) or placebo (11/24) (RR 1.23, 95% CI 0.75 to 2.04; 1 RCT; 70 participants assessed during the 12‐month follow‐up). Adverse events related to methotrexate included alopecia, nausea, headache, fatigue and hepatotoxicity, whilst adverse events related to prednisone (given in both groups) included weight gain (more than 5% of body weight) and striae rubrae.
One three‐armed RCT compared the following treatments: medium‐dose (50 J/cm²) UVA‐1; low‐dose (20 J/cm²) UVA‐1; and narrowband UVB phototherapy. There may be little or no difference between treatments in global improvement of disease activity or damage, as assessed through the modified skin score (where high values represent a worse outcome): medium‐dose UVA‐1 phototherapy versus low‐dose UVA‐1 group: MD 1.60, 95% CI −1.70 to 4.90 (44 participants); narrowband UVB phototherapy versus medium‐dose UVA‐1 group: MD −1.70, 95% CI −5.27 to 1.87 (35 participants); and narrowband UVB versus low‐dose UVA‐1 group: MD −0.10, 95% CI −2.49 to 2.29 (45 participants). This RCT included children and adults with active morphea (circumscribed morphea, linear scleroderma (with trunk/limb variant and head variant), generalised morphea, or mixed morphea), who received phototherapy five times a week, for eight weeks. Outcomes were measured at eight weeks from the start of treatment.
Safety data, measured throughout treatment, from the same RCT (62 participants) showed that treatment with UVA‐1 phototherapy may cause mild tanning compared to narrowband UVB: narrowband UVB versus medium‐dose UVA‐1: RR 0.03, 95% CI 0.00 to 0.42; 35 participants; narrowband UVB versus low‐dose UVA‐1: RR 0.03, 95% CI 0.00 to 0.41; 45 participants. However, there may be no difference in the number of participants reporting mild tanning when comparing medium and low dose UVA‐1 phototherapy (RR 1.00, 95% CI 0.91 to 1.10; 44 participants). Transient erythema was reported in three participants with narrowband UVB and no participants in the low‐ or medium‐dose UVA‐1 groups.
Authors' conclusions
Compared to placebo plus oral prednisone, oral methotrexate plus oral prednisone may improve disease activity or damage in juvenile active morphea (linear scleroderma, generalised morphea or mixed morphea: linear and circumscribed), but there may be a slightly increased chance of experiencing at least one adverse event.
When medium‐dose UVA‐1 (50 J/cm²), low‐dose UVA‐1 (20 J/cm²), and narrowband UVB were compared against each other in treating children and adults with active morphea (circumscribed morphea, linear scleroderma, generalised morphea and mixed morphea), there may be little or no difference between these treatments on global improvement of disease activity or damage. UVA‐1 phototherapy may cause more mild tanning than narrowband UVB, but there may be no difference between medium‐ and low‐dose UVA‐1 phototherapy. These results are based on low‐quality evidence.
Limitations of data and analyses include risk of bias and imprecision (small number of participants or events and wide confidence intervals). We encourage multicentre RCTs to increase sample size and evaluate, with validated tools, different treatment responses according to the subtypes of morphea and age groups.
PICO
Plain language summary
Interventions for morphea
Review question
The aim of this Cochrane Review was to assess the effects of treatments, either given in isolation or combination, for people with morphea (morphoea), when compared with an inactive substance (placebo), no intervention, any other treatment, or different doses or duration of a treatment. We collected and analysed all relevant studies published up to July 2018.
Background
Morphea is a rare disease that causes skin hardening. It affects adults and children equally, and is more common in females. There are different subtypes of morphea, with different characteristics: circumscribed morphea is generally less severe than the other subtypes; linear scleroderma can cause significant body differences, possibly affecting growth in children; generalised morphea is a severe type involving multiple areas of the body; pansclerotic morphea is a severe and progressive type of generalised morphea; and mixed morphea is the presence of two or more disease types. Recurrence rates are high, and even when disease activity reduces, a person can be left with permanent effects. This review intended to assess the safety and effectiveness of different treatments for morphea.
Study characteristics
We found 14 relevant studies, with a total of 429 participants, including children and adults aged from three to 76 years. Over half of the participants were female. Most participants had circumscribed morphea, followed by linear scleroderma. Six studies did not describe their setting, but the rest were set in university hospital, medical centre, or national laboratory centre. Seven studies received funding from either universities, government or association scholarships, or the pharmaceutical industry. Six studies had no funding, and one study did not report this information.
Seven studies compared topical medications: phototherapy; an immunosuppressive (suppresses immune system activity); an antiallergic drug; and a corticosteroid (an anti‐inflammatory). Two studies compared medications within the lesion itself: collagen, and an immunomodulator (modifies the immune response). Five studies compared systemic medications (meaning they affect the whole body): an immunosuppressive; traditional Chinese medicine therapies; and a vitamin D analogue (a form of vitamin D). These treatments were compared with either no treatment; placebo; differing doses of phototherapy; hydroxychloroquine (an immune system regulator); emollient petrolatum (moisturising treatment); corticosteroids; an anticoagulant agent (blood thinner) taken with a medicinal plant extract and vitamin E tablet; or antibiotic with base cream. The studies lasted between seven weeks and 15 months.
Key results
The results we present in this summary are based on low‐quality evidence.
Children and teenagers with active morphea (linear scleroderma, generalised morphea and mixed morphea: linear and circumscribed) may experience greater improvement of disease activity or damage with oral methotrexate plus prednisone than with placebo plus prednisone. We would expect that out of 100 children and teenagers, 67 would experience improvement with methotrexate, compared with 29 given placebo; this is based on results measured either 12 months after start of treatment or until flare of the disease. In addition, there may be little or no difference in the number of participants experiencing at least one side effect during treatment (such as hair loss, headache, sickness, tiredness, or liver damage) between those given methotrexate and those given placebo. Side effects from prednisone (given in both groups) included weight gain and stretch marks. We would expect that out of 100 children and teenagers, 56 would experience at least one side effect with methotrexate, compared with 46 given placebo.
Children and adults with active morphea (circumscribed morphea, linear scleroderma, generalised morphea, or mixed morphea) may present similar reduction in disease activity or damage with medium‐dose (50 J/cm²) UVA‐1, low‐dose (20 J/cm²) UVA‐1, or narrowband UVB phototherapy. Those treated with medium‐dose (50 J/cm²) UVA‐1 or low‐dose (20 J/cm²) UVA‐1 phototherapy may have mild tanning after the treatment compared to those treated with narrowband UVB phototherapy. However, there may be no difference in the number of participants reporting mild tanning when comparing medium‐ and low‐dose UVA‐1 phototherapy. Temporary redness was reported in three participants given narrowband UVB and none of the participants in either the low‐ or medium‐dose UVA‐1 groups.
Quality of the evidence
We considered the quality of evidence as low because most studies included few participants and there were concerns over the design of some studies, such as no treatment masking and incomplete analysis.
Authors' conclusions
Summary of findings
| Oral methotrexate and oral prednisone compared to placebo and oral prednisone for juvenile morphea | ||||||
| Patient or population: children and adolescents with active morphea (linear scleroderma, generalised morphea and mixed subtype: linear and circumscribed). | ||||||
| Outcomes | Anticipated absolute effects* (95% CI) | Relative effect | № of participants | Quality of the evidence | Comments | |
| Risk with placebo plus folic acid supplementation and oral prednisone | Risk with oral methotrexate plus folic acid supplementation and oral prednisone | |||||
| Primary outcome: Global improvement of disease activity or damage assessed by a medical practitioner or by participants | Children and adolescents with morphea | RR 2.31 | 70 | ⊕⊕⊝⊝ | ||
| 292 per 1000 | 674 per 1000 | |||||
| Primary outcome: Adverse effects | Children and adolescents with morphea | RR 1.23 | 70 | ⊕⊝⊝⊝ | ||
| 458 per 1000 | 564 per 1000 | |||||
| Secondary outcome: Improvement of disease activity (reduction in lesion size) | The mean SSR was 1.1 | MD 0.31 lower | ‐ | 70 | ⊕⊕⊝⊝ | |
| Secondary outcome: Improvement of disease damage | See comment | ‐ | 70 | ‐ | Authors reported no significant differences between groups in the Childhood Health Assessment Questionnaire (C‐HAQ) disability index, but reported no numerical data. | |
| *The risk in the intervention group (and its 95% CI) is based on the assumed risk in the comparison group and the relative effect of the intervention (and its 95% CI). | ||||||
| GRADE Working Group grades of evidence | ||||||
| aDowngraded by 2 levels to low quality evidence. 1 level due to unclear risk of selection bias (allocation concealment) and high risk of reporting bias (selective reporting). Downgraded by 1 level due to small number of events (less than 300 events). bDowngraded by 2 levels to low quality evidence. 1 level due to unclear risk of selection bias (allocation concealment) and high risk of reporting bias (selective reporting). Downgraded by 1 level due to small number of events (less than 300 events) and wide confidence interval (includes both null effect and appreciable harm). cDowngraded by 2 levels to low quality evidence. 1 level due to unclear risk of selection bias (allocation concealment) and high risk of reporting bias (selective reporting). Downgraded by 1 level due to small number of participants (less than 400 participants). | ||||||
| Medium‐dose UVA‐1 phototherapy (50 J/cm²) compared to low‐dose UVA‐1 phototherapy (20 J/cm²) for morphea | ||||||
| Patient or population: children and adults with active morphea (circumscribed morphea, linear scleroderma (with trunk/limb variant and head variant), generalised morphea, or mixed morphea). | ||||||
| Outcomes | Anticipated absolute effects* (95% CI) | Relative effect | № of participants | Quality of the evidence | Comments | |
| Risk with low‐dose UVA‐1 phototherapy (20 J/cm²) | Risk with Medium‐dose UVA‐1 phototherapy (50 J/cm²) | |||||
| Primary outcome: Global improvement of disease activity or damage assessed by a medical practitioner or by participants | The mean score (MSS) was 5 | MD 1.60 more | ‐ | 44 | ⊕⊝⊝⊝ | |
| Primary outcome: Adverse effects | Individuals with morphea | RR 1.00 | 44 | ⊕⊝⊝⊝ | ||
| 1000 per 1000 | 1000 per 1000 | |||||
| Secondary outcome: Improvement of disease activity (skin softening) | The mean ultrasound score was 69 | MD 16.43 lower | ‐ | 36 | ⊕⊝⊝⊝ | |
| Secondary outcome: Improvement of disease damage ‒ not measured | See comment | ‐ | ‐ | ‐ | There was no measure of this outcome for this comparison. | |
| *The risk in the intervention group (and its 95% CI) is based on the assumed risk in the comparison group and the relative effect of the intervention (and its 95% CI). CI: Confidence interval; RR: Risk ratio; OR: Odds ratio; | ||||||
| GRADE Working Group grades of evidence | ||||||
| aDowngraded by 2 levels to low quality evidence. 1 level due to high risk of performance bias (blinding of participants and personnel), detection bias (blinding of outcome assessment) and reporting bias (selective reporting). Downgraded by 1 level due to small number of participants (less than 400 participants). bDowngraded by 2 levels to low quality evidence. 1 level due to high risk of performance bias (blinding of participants and personnel), detection bias (blinding of outcome assessment) and reporting bias (selective reporting). Downgraded by 1 level due to small number of events (less than 300 events). cDowngraded by 2 levels to low quality evidence. 1 level due to high risk of performance bias (blinding of participants and personnel), detection bias (blinding of outcome assessment) and reporting bias (selective reporting). Downgraded by 1 level due to small number of participants (less than 400 participants) and wide confidence interval (includes both null effect and appreciable benefit). | ||||||
| Narrowband UVB phototherapy compared to medium‐dose UVA‐1 phototherapy (50 J/cm2) for morphea | ||||||
| Patient or population: children and adults with active morphea (circumscribed morphea, linear scleroderma (with trunk/limb variant and head variant), generalised morphea, or mixed morphea). | ||||||
| Outcomes | Anticipated absolute effects* (95% CI) | Relative effect | № of participants | Quality of the evidence | Comments | |
| Risk with medium‐dose UVA‐1 phototherapy (50 J/cm2) | Risk with Narrowband UVB phototherapy | |||||
| Primary outcome: Global improvement of disease activity or damage assessed by a medical practitioner or by participants | The mean score (MSS) was 6.6 | MD 1.70 lower | ‐ | 35 | ⊕⊝⊝⊝ | |
| Primary outcome: Adverse effects | Individuals with morphea | RR 0.03 | 35 | ⊕⊝⊝⊝ | ||
| 1000 per 1000 | 30 per 1000 | |||||
| Secondary outcome: Improvement of disease activity (skin softening) | The mean ultrasound score was 52.57 | MD 17.78 higher | ‐ | 28 | ⊕⊝⊝⊝ | |
| Secondary outcome: Improvement of disease damage ‐ not measured | See comment | ‐ | ‐ | ‐ | There was no measure of this outcome for this comparison. | |
| *The risk in the intervention group (and its 95% CI) is based on the assumed risk in the comparison group and the relative effect of the intervention (and its 95% CI). | ||||||
| GRADE Working Group grades of evidence | ||||||
| aDowngraded by 2 levels to low quality evidence. 1 level due to high risk of performance bias (blinding of participants and personnel), detection bias (blinding of outcome assessment) and reporting bias (selective reporting). Downgraded by 1 level due to small number of participants (less than 400 participants). bDowngraded by 2 levels to low quality evidence. 1 level due to high risk of performance bias (blinding of participants and personnel), detection bias (blinding of outcome assessment) and reporting bias (selective reporting). Downgraded by 1 level due to small number of events (less than 300 events). cDowngraded by 2 levels to low quality evidence. 1 level due to high risk of performance bias (blinding of participants and personnel), detection bias (blinding of outcome assessment) and reporting bias (selective reporting). Downgraded by 1 level due to small number of participants (less than 400 participants) and wide confidence interval (includes both null effect and appreciable benefit). | ||||||
| Narrowband UVB compared to low‐dose UVA‐1 phototherapy (20 J/cm2) for morphea | ||||||
| Patient or population: children and adults with active morphea (circumscribed morphea, linear scleroderma (with trunk/limb variant and head variant), generalised morphea, or mixed morphea). | ||||||
| Outcomes | Anticipated absolute effects* (95% CI) | Relative effect | № of participants | Quality of the evidence | Comments | |
| Risk with low‐dose UVA‐1 phototherapy (20 J/cm2) | Risk with Narrowband UVB | |||||
| Primary outcome: Global improvement of disease activity or damage assessed by a medical practitioner or by participants | The mean score (MSS) was 5 | MD 0.10 lower | ‐ | 45 | ⊕⊝⊝⊝ | |
| Primary outcome: Adverse effects | Individuals with morphea | RR 0.03 | 45 | ⊕⊝⊝⊝ Low b | ||
| 1000 per 1000 | 30 per 1000 | |||||
| Secondary outcome: Improvement of disease activity (skin softening) | The mean ultrasound score was 69 | MD 1.35 higher | ‐ | 32 | ⊕⊝⊝⊝ | |
| Secondary outcome: Improvement of disease damage ‐ not measured | See comment | ‐ | ‐ | ‐ | There was no measure of this outcome for this comparison. | |
| *The risk in the intervention group (and its 95% CI) is based on the assumed risk in the comparison group and the relative effect of the intervention (and its 95% CI). | ||||||
| GRADE Working Group grades of evidence | ||||||
| aDowngraded by 2 levels to low quality evidence. 1 level due to high risk of performance bias (blinding of participants and personnel), detection bias (blinding of outcome assessment) and reporting bias (selective reporting). Downgraded by 1 level due to small number of participants (less than 400 participants). bDowngraded by 2 levels to low quality evidence. 1 level due to high risk of performance bias (blinding of participants and personnel), detection bias (blinding of outcome assessment) and reporting bias (selective reporting). Downgraded by 1 level due to small number of events (less than 300 events). cDowngraded by 3 levels to very low quality evidence. 1 level due to high risk of performance bias (blinding of participants and personnel), detection bias (blinding of outcome assessment) and reporting bias (selective reporting). Downgraded by 2 levels due to small number of participants (less than 400 participants) and wide confidence interval (includes both null effect and appreciable benefit). | ||||||
Background
Please note that we include a glossary in Table 1 to explain the abbreviated terms we use.
| Term | Definition |
| ALA | 5‐aminolaevulinic acid |
| BB | broad‐band |
| CDLQI | Children's Dermatology Life Quality Index |
| C‐HAQ | Childhood Health Assessment Questionnaire |
| CI | confidence interval |
| CO₂ | carbon dioxide |
| DIET | dyspigmentation, induration, erythema, telangiectasia |
| DLQI | Dermatology Life Quality Index |
| DNA | deoxyribonucleic acid |
| HCQ | hydroxychloroquine |
| IFN‐γ | interferon gamma |
| ITT | intention‐to‐treat |
| ISDL | Impact of Chronic Skin Disease on Daily Life scale |
| LoSCAT | Localized Scleroderma Cutaneous Assessment Tool |
| LoSDI | Localized Scleroderma Skin Damage Index |
| LoSSI | Localized Scleroderma Skin Severity Index |
| mLoSSI | Modified Localized Scleroderma Skin Severity Index |
| mRSS | Modified Rodnan Skin Score |
| MD | mean difference |
| MHz | megahertz |
| MSS | modified skin score |
| MTX | methotrexate |
| NNT | number needed to treat |
| PDT | photodynamic therapy |
| PGA‐D | Physician Global Assessment of disease Damage |
| PtGA‐S | Patient Global Assessment of disease Severity |
| PUVA | psoralen plus ultraviolet A |
| RCT | randomised controlled trial |
| RR | risk ratio |
| RSS | Rodnan skin score |
| SMD | standardised mean differences |
| SSc | systemic sclerosis |
| SSR | skin score rate |
| UV | ultraviolet |
| UVA | ultraviolet A |
| UVB | ultraviolet B |
| VAS | visual analogue scale |
| ΔTh% | percentage thermal change from baseline |
Description of the condition
Morphea (morphoea) is a chronic inflammatory and fibrosing (thickening of tissue) disorder usually limited to the skin and underlying tissues: subcutaneous tissues, underlying bone, muscles, synovia and — on extremely rare occasions — the central nervous system (when the lesion is present on the face and head) (Badea 2009; Hawk 2001; Kroft 2009b; Rook 2010; Valanciene 2010; Zwischenberger 2011). It is an immune‐mediated disease related to autoimmune phenomena in which excess synthesis and deposition of collagen in the skin and connective tissues results in hardened cutaneous areas (Badea 2009; Hawk 2001; Hunzelmann 1998; Vasquez 2012).
Morphea is sometimes referred to as localised scleroderma — confusingly, as the term scleroderma may link the diagnosis to systemic sclerosis (SSc). Both diseases are characterised by skin hardening; however, it is important to distinguish morphea from SSc. In SSc, excessive deposition of collagen occurs not only in the skin but also in internal organs, such as the lungs, heart, and gastrointestinal tract, leading to high morbidity and mortality (Barnes 2012; Beyer 2012; Harding 1998; Pope 1998a; Pope 1998b; Tingey 1998). SSc may also affect the peripheral circulation and the extremities (Vasquez 2012). The linear and generalised forms of morphea are linked to significant morbidity but do not affect mortality, whilst the cardiopulmonary involvement of SSc leads to high disease‐specific mortality. Thus the term morphea is preferred for the adult population, but the term localised scleroderma is used particularly for the paediatric population to emphasise the morbidity linked to linear scleroderma, which is most common in children (Fett 2013).
Morphea is a diverse condition that presents different clinical features according to the subtype and stage of evolution of the disease (Fett 2013; Vasquez 2012). The initial morphea lesion appears as one or several inflamed or slightly erythematous and oedematous patches or plaques, usually on the trunk, that become fibrotic and sclerotic with an ivory‐coloured centre (Hawk 2001; Valanciene 2010). The edge of the lesion becomes reddish, indurated, or violaceous when the disease is in an active stage (Valanciene 2010; Vasquez 2012).
In the course of time atrophic skin changes appear, with pigmentation disorders (hypo‐ or hyperpigmentation), shiny skin, indentations, numbness, visible blood vessels, fat loss, loss of hair, loss of sweat glands, and in some cases, disabling joint contractures and restriction of movement of one or more limbs (Arkachaisri 2010; Saxton‐Daniels 2010; Valanciene 2010).
It is important to consider the signs of activity of morphea, such as lesions with marked or moderate erythema or violaceous colour change, new lesions, or expanding lesions, because skin changes in the active stage of the disease have better chances of improvement, whilst inactive sclerotic or atrophic lesions often have poor response to treatments (Fett 2013; Li 2012; Vasquez 2012). Other indicators of disease activity include: lesion warmth; mild erythema; marked or moderate induration of the lesion’s border; worsening hair loss in the scalp, eyebrow or eyelashes; elevated creatine kinase; and lesion histopathological findings (Knobler 2017; Li 2012).
Morphea can be present in several different forms that vary from each other in terms of age, possible causes, propensity to underlying sclerosis and hence treatment aims and need for systemic therapy. The classification systems proposed until now use different parameters and characteristics to distinguish clinical presentations, as the boundaries between the morphea phenotypes are not always clear and the presence of more than one subtype is common (Careta 2015; Fett 2011a; Knobler 2017; Kreuter 2015; Li 2012; Marsol 2013). When morphea develops during childhood or adolescence, it is called juvenile morphea. However, although it is characterised by high morbidity (as its most common type is linear scleroderma), juvenile morphea is not a clinical subtype, because it presents the same manifestations as in adults (Fett 2013).
The Padua Consensus Classification, published in 2004 by the Paediatric Rheumatology European Society, describes five disease types based on clinical and histopathological aspects (Asano 2018; Laxer 2006).
-
Circumscribed morphea (with superficial and deep variants): one to few patches of well‐circumscribed, circular to oblong lesions scattered on the trunk or limbs, that are usually restricted to the dermis and sometimes to the upper fat layer of the skin (superficial panniculus).
-
Linear scleroderma (with trunk/limb variant and head variant): linear streak of fibrosis that can involve the underlying tissues (bones, muscles, synovia, and central nervous system), inducing disability and joint contracture. The lesions on the limbs may affect growth in children, and the lesions on the face can cause deformity, facial asymmetry and dentition deformity.
-
Generalised morphea: a severe type of morphea characterized by the presence of four or more indurated lesions involving more than two body areas of the seven anatomic sites (head‐neck, each extremity, anterior trunk, and posterior trunk).
-
Pansclerotic morphea: a type of severe and progressive generalised morphea, in which the lesions may infiltrate the skin of the whole body and involve the underlying tissues, causing joint contracture, deformity, ulceration and calcification.
-
Mixed morphea: presence of two or more disease types, including circumscribed morphea, linear scleroderma, generalised morphea and pansclerotic morphea.
Figure 1 and Figure 2 illustrate some cases of circumscribed morphea, linear scleroderma, and generalised morphea.

A ‐ Confluent sclero‐atrophic lesions, with hypochromic, achromic and brownish areas on the thighs, generalised morphea; B ‐ sclero‐atrophic oval lesion with dyschromic areas and halo erythematosus in its right and inferior portion, active circumscribed morphea; C ‐ brown macula with discretely erythematous areas and irregular borders, circumscribed morphea in involution. Copyright © 2019 Monica RA Vasconcellos: reproduced with permission.
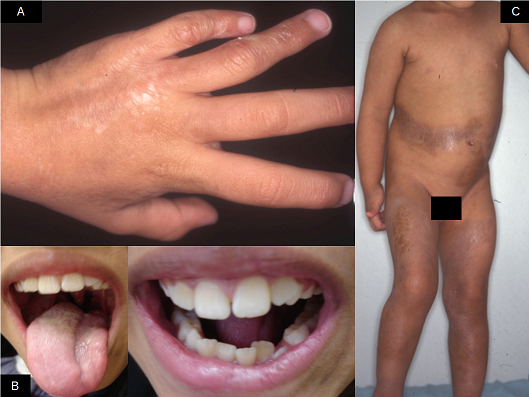
Linear scleroderma. A ‐ Sclero‐atrophic lesion involving the back of the hand and fingers, with deviation in the fourth and fifth chirodactyls; B – Streak of atrophy in the tongue (left) and dental implant defect (right); C – segmental sclero‐atrophic lesions in the trunk and limbs interspersed by hyper pigmented maculae. Copyright © 2019 Monica RA Vasconcellos: reproduced with permission.
A definitive diagnosis of morphea is based on the appearance and texture of the skin, with skin biopsies used to support the clinical hypothesis and rule out other disorders (Hawk 2001). The histopathological examination does not distinguish morphea from SSc. Generalised morphea could plausibly be confused with SSc, and the differentiation is based on careful direct examination of the patient, on serologic examinations and capillaroscopic changes, typical of SSc (Vasquez 2012).
Epidemiological data
Epidemiological studies have suggested the incidence of morphea is 0.4 to 2.7 per 100,000 people per year (Arkachaisri 2010; Fett 2011a). This data is from a population in the United States between 1960 and 1993 (Peterson 1997). As survival was not adversely affected by the development of the disease, Peterson 1997 observed that the prevalence of morphea increased with the age of the population under consideration, affecting 50 people per 100,000 at 18 years of age, rising to 220 people per 100,000 at 80 years of age (Mayes 1998; Valanciene 2010). Morphea affects adults and children equally, with the average age of adult onset being 40 years, and the average age of onset in children varying between two and 14 years (Fett 2011a; Valanciene 2010). The disease is more prevalent in women (the ratio of morphea in females to males is 2.6:1) (Fett 2011a; Hawk 2001). The most common clinical presentation in adults is circumscribed morphea (43.9%), whilst linear scleroderma is the most common subtype in children (41.8%) (Leitenberger 2009; Saxton‐Daniels 2010; Vasquez 2012). The mixed type of morphea affects around 15% of individuals, with juvenile morphea and pansclerotic morphea also predominantly affecting children (Asano 2018).
Causes
Despite numerous studies trying to elucidate the mechanisms of morphea, its causes are still unknown (Chen 2002; Hunzelmann 1998; Valanciene 2010). Morphea is probably caused by genetic, autoimmune, and environmental factors, such as trauma, radiation, hormones, medications, and infections (Chen 2002; Hawk 2001; Hunzelmann 1998; Valanciene 2010; Vasquez 2012).
Prognosis
Data on the long‐term clinical course of morphea is limited (Knobler 2017). Medical monitoring should start as early as possible, with a preventive approach. However, the decision to start or indicate a specific treatment can be problematic due to the difficulty in determining if the lesions are clinically active and progressing, or if the disease is stable and whether the damage will respond (Marsol 2013).
The disease severity and prognosis vary according to its subtype: circumscribed morphea generally has a more benign course when compared with linear scleroderma and generalised morphea. Circumscribed morphea usually results in atrophy and loss of collagen and adnexal structure rather than scarring due to scar tissue or excess collagen. Linear scleroderma can cause significant disfigurement and, in case of involvement of the underlying bone and growth plates, aesthetic and functional disability, muscular spasms, changes in the length of the arms and legs, reduced joint movement, and psychological disabilities (Fett 2013; Hawk 2001; Johnson 2012; Saxton‐Daniels 2010; Zwischenberger 2011).
Juvenile linear scleroderma often presents a more severe clinical course compared with adult linear scleroderma, and the considerable atrophy of the skin, fat tissue, fascia and muscle is linked to substantial functional, physical, and mental disability. Skin lesions on the limbs can induce disability and joint contracture, preventing symmetrical growth; and lesions on the head can lead to deformity, facial asymmetry and dentition deformity (Asano 2018). Thus, effective systemic therapy in the active stage of juvenile linear scleroderma is recommend as early as possible to prevent persistent damage (Knobler 2017).
Superficial linear scleroderma without involvement of underlying tissues is usually treated with local therapies or phototherapy, and generalised morphea tends to be initially treated with phototherapy (Fett 2013). However, systemic treatments may be required, and individuals with linear scleroderma and generalised morphea receive more aggressive treatment and have higher chances of adverse events when compared to those receiving treatment for superficial circumscribed morphea (Bielsa Marsol 2013; Vasquez 2012). The treatment of superficial circumscribed morphea usually includes topical therapy or local phototherapy, and circumscribed deep morphea may require local phototherapy or systemic immunosuppression (Fett 2013).
Although morphea usually has a self‐limited evolution, with frequent spontaneous regressions within 3 to 5 years, recurrence rates are high, even after many years of inactive disease, particularly in children with linear scleroderma or mixed morphea, which require a careful long‐term follow‐up (Asano 2018; Careta 2015; Mertens 2015). Disease activity remits, but permanent sequelae (consequent anatomical or functional abnormalities) may occur due to prolonged disease activity.
Description of the intervention
Because of its rarity (incidence of 0.4 to 2.7 people per 100,000 per year), there are few randomised controlled trials of therapeutic agents (Hawk 2001; Kroft 2009b; Valanciene 2010; Zulian 2011); and to date different medications for treating the various forms of morphea have been used. However, evidence of the effectiveness and safety of these medications is still unclear, and it is unknown which drug is best suited for each subtype of morphea (Bielsa Marsol 2013; Zulian 2011; Zwischenberger 2011).
The literature describes the following main treatments for the disease, which can be used alone or in combination.
-
Phototherapy (treatment with nature‐identical ultraviolet radiation sources that can be combined with certain medications called psoralens, which make people more sensitive to the effects of light): ultraviolet (UV) A‐1, broad‐band UVA, narrowband UVB, psoralen with UVA (PUVA) bath, PUVA cream, and extracorporeal photochemotherapy, which are used in adults and children. The phototherapy decreases the synthesis of collagen (Hawk 2001; Kroft 2009b; Valanciene 2010; Zwischenberger 2011). The side effects of these treatments are hyperpigmentation, pruritus, burning, recurrences of herpes simplex, photoaging, and increased risk of skin cancers (Zandi 2012).
-
Vitamin D derivatives: oral calcitriol, topical calcipotriene, and calcipotriol ointments, which are used in both adults and children. They inhibit the proliferation of fibroblasts (responsible for collagen production) and also have anti‐inflammatory effects (Hawk 2001; Kroft 2009b; Valanciene 2010). The side effects of these treatments include local irritation, contact allergy, and elevated serum calcium (hypercalcaemia) (Rook 2010).
-
Immunosuppressors (reduce DNA synthesis and cell division) and immunomodulators (act on the immune response): methotrexate, tacrolimus, antimalarials (chloroquine and hydroxychloroquine), interferon gamma, interferon alpha, mycophenolate mofetil, ciclosporin, cyclophosphamide, imiquimod, colchicine, Salazopyrine, and D‐penicillamine. These agents are used in both adults and children. The side effects of these treatments include teratogenicity (foetal malformation); ulcerative stomatitis; mucositis; nausea; vomiting; diarrhoea; anorexia; gonadal suppression; liver, kidney, and nerve damage; hypersensitivity reactions (allergies); hair loss; skin pigmentation changes; photosensitivity; bone marrow damage; leukopaenia (reduction in the number of leukocytes); and thrombocytopaenia (reduction in the number of platelets) (Hawk 2001; Hunzelmann 1998; Kroft 2009b; Rook 2010).
-
Oral and topical steroids, which are used in adults and children, act to reduce the inflammation of active lesions. The side effects of these treatments include cutaneous thinning, acne, facial hair growth, striae distensae, weight gain, glaucoma, osteoporosis, growth suppression in children, opportunistic infections, hypertension, diabetes, and Cushing's syndrome (Hawk 2001; Kroft 2009b; Rook 2010; Valanciene 2010).
-
Physical therapy, heat treatment and massage, to prevent joint disability and contracture and maintain movement (Hunzelmann 1998).
Other less commonly used therapies that have been described include anti‐infective agents (penicillin, aminobenzoate potassium), vitamin A derivatives (etretinate, acitretin), vitamin E, anticoagulant agents (heparin and heparinoids), lidocaine, anticonvulsants (phenytoin), bosentan, surgical interventions, photodynamic therapy, laser, and autologous fat implants (Fett 2011b; Hawk 2001; Kroft 2009b; Valanciene 2010; Vilela 2010; Zwischenberger 2011).
How the intervention might work
There is no causal treatment for morphea, but several therapeutic options are available, particularly for the active, inflammatory stage of disease (Knobler 2017). The aims of these interventions are to stop disease activity, prevent the appearance of new lesions, and improve any existing lesions. Most interventions reduce the inflammatory process or modulate the production of collagen (Hunzelmann 1998; Valanciene 2010; Vasquez 2012). It usually takes between eight and 12 weeks to achieve reduction of skin sclerosis after initiation of therapy (Knobler 2017).
Phototherapy decreases collagen synthesis; topical steroids and tacrolimus have anti‐inflammatory and immunomodulatory effects; topical vitamin D derivatives inhibit the proliferation of fibroblasts (cells that produce collagen fibres); and methotrexate has immunosuppressive effects — all of which result in the suppression of disease progression. Oral calcitriol is an anti‐inflammatory agent and fibroblast modulator. Interferon gamma and alpha normalise abnormal fibroblast production. When there is established damage, surgery is performed followed by physical and occupational therapy to promote any subsequent improvement (Hunzelmann 1998; Valanciene 2010).
The aims of treatment may be very different according to the subtype, extent and severity of morphea. It is also essential to evaluate the disease activity, as the aim for lesions at an early inflammatory stage is to inhibit disease activity; and at a late fibrotic stage the objective is to treat functional disorders and cosmetic issues (Asano 2018; Knobler 2017). Active morphea can be treated with topical or systemic immunosuppressives, whereas the damage stage is not treatable with immunosuppression (Fett 2013). Options for treating functional disorders, such as joint flexion contracture and restriction of motion, and cosmetic problems caused by inactive skin lesions, include physiotherapy and surgical interventions (these should not be considered in the active, inflammatory stage of morphea) (Asano 2018; Knobler 2017).
Topical therapy and phototherapy are not indicated for lesions involving the underlying tissue, as these interventions act on the deep dermis; thus morphea subtypes affecting deeper structures (e.g. fat tissue, fascia, muscle, or bone) require systemic therapy (Knobler 2017). However, when systemic therapy is indicated the extent of adverse events and the therapeutic effect must be taken into account (Asano 2018).
Linear scleroderma tends to be treated aggressively to prevent underlying dermal, muscle and bone atrophy whereas circumscribed morphea is often treated topically for global improvement. Superficial circumscribed morphea, restricted to the skin, tends to be treated topically if a single site or few sites are present, or with UV phototherapy in case of several sites; whereas systemic therapy is indicated for deep circumscribed morphea, linear scleroderma and generalised morphea (Fett 2013). In lesions crossing the joints or with the potential to disfigure, methotrexate is the first choice of treatment (Knobler 2017). In the treatment of juvenile circumscribed morphea, topical therapies can be used or even no intervention to avoid medicalisation, whereas in juvenile linear scleroderma and generalised morphea the treatment should start as early as possible to prevent underlying tissue damage.
There is no validation and consensual tool to assess the severity of morphea (Asano 2018). Clinical tools validated and widely used in SSc are inappropriate for the measurement of morphea skin involvement, and clinical scores specifically designed for morphea are relatively new because of the difficulties of defining clinical improvement (Knobler 2017). The use of non‐validated outcome measures to assess disease improvement limits the evaluation of the effectiveness of treatments (Fett 2013). The Localised Scleroderma Cutaneous Assessment Tool (LoSCAT) could become a standard tool for morphea as it measures both activity and damage (Knobler 2017). The LoSCAT is a combination of: the modified Localized Scleroderma Skin Severity Index (mLoSSI), the first validated skin score for morphea which evaluates erythema, skin thickness, new lesions and lesional extension in 18 anatomic regions; the Localized Scleroderma Skin Damage Index (LoSDI), a score later developed to assess skin damage in the same anatomic regions; and the Physician’s Global Assessment (PGA) (Arkachaisri 2010). There are other available tools to assess disease activity in morphea, such as ultrasound scans, cutometer, durometer, thermography, and contrast MRI; however, these usually account for secondary outcome measures (Asano 2018; Knobler 2017). Tools to assess quality of life include the Dermatology Life Quality Index (DLQI) and the Hospital Anxiety and Depression Scale (Knobler 2017).
Why it is important to do this review
Morphea is extremely varied clinically, with heterogenous subtypes. The alterations to the skin caused by morphea have different degrees of impact on a person's quality of life and can lead to irreversible physical and psychological damage (Arkachaisri 2010; Bielsa Marsol 2013; Kroft 2009b). Superficial circumscribed morphea has the potential to cause itching, pain and aesthetic concerns, whilst linear scleroderma can cause, particularly in children in their growth stage, muscle spasms, disabilities, disfigurement and limb length discrepancies (Arkachaisri 2010; Hawk 2001; Valanciene 2010; Zwischenberger 2011). Pain, fatigue, stigmatisation, the negative impact of the disease on daily life, and less social acceptance and support make those with morphea more susceptible to psychological problems, such as anxiety and depression (Kroft 2009b).
Despite numerous proposed treatments for morphea, each disease subtype presents with a different response to treatment, and there is no consensus on which therapies, dosages and treatment periods are widely tolerated, have fewer side effects, and offer the greatest benefit to people with morphea (Asano 2018; Knobler 2017; Zwischenberger 2011).
The plans for this review were published as a protocol 'Interventions for morphea' (Ravelli 2014).
Objectives
To assess the effects of treatments for people with any form of morphea.
Methods
Criteria for considering studies for this review
Types of studies
All randomised controlled trials (RCTs) assessing treatments for morphea (isolated or combined). We included within‐participant trials (e.g. left‐side, right‐side comparisons) in the review, but only the first part of cross‐over trials to avoid carry‐over and period effects.
Types of participants
Anyone who has been clinically diagnosed with any form of morphea (e.g. limited, generalised, linear, deep, or mixed morphea) by a medical practitioner.
In case of studies with only a subset of relevant participants (e.g. treatment groups including participants with different diseases), we analysed only data from eligible participants (individuals with morphea). If these data were not available in the published study, we contacted the first author of the study to obtain it.
Types of interventions
Any topical, intralesional, or systemic medications including radiation therapy, photodynamic therapy, laser therapy, surgery, and physical therapy. Interventions could be isolated or combined. Controls could be placebo, no intervention, any other treatment, or different doses or duration of a treatment.
Types of outcome measures
Primary outcomes
-
Global improvement of disease activity or damage, assessed by a medical practitioner or by participants.
-
Adverse effects of the interventions, including local and systemic reactions.
Secondary outcomes
-
Improvement of disease activity defined as including skin softening, reduction in lesion size, reduction in skin thickness, fading signs of inflammation, or halting the progression of the disease.
-
Improvement of disease damage defined as including improvement in pigmentation (hypo‐ or hyperchromia), and improved range of motion, restriction of movement, disabilities, or any functional impairment of motor activity.
Timing of outcomes
We determined which treatments for morphea demonstrated the best outcomes up to six months and also from six to 12 months.
Assessment tools
We analysed the outcomes independently of the assessment tools, which include, among others, the following: LoSSI, mLoSSI, LoSDI, Physician Global Assessment of Damage (PGA‐D), Patient Global Assessment of Disease Severity (PtGA‐S), DLQI, Children's Dermatology Life Quality Index (CDLQI), LoSCAT, Rodnan skin score (RSS), modified Rodnan skin score (mRSS), Modified Skin Score (MSS), Impact of Chronic Skin Disease on Daily Life (ISDL), visual analog scale (VAS), Cutometer®, durometer, thermography, and ultrasound (see Table 1).
Search methods for identification of studies
We aimed to identify all relevant RCTs regardless of language or publication status (published, unpublished, in press, or in progress).
Electronic searches
The Cochrane Skin Information Specialist searched the following databases up to 17 July 2018 using strategies based on the draft strategy for MEDLINE in our published protocol (Ravelli 2014).
-
Cochrane Skin Group Specialised Register using the search strategy in Appendix 1.
-
Cochrane Central Register of Controlled Trials (CENTRAL; 2018, Issue 6) in the Cochrane Library using the strategy in Appendix 2.
-
MEDLINE via Ovid (from 1946) using the strategy in Appendix 3.
-
Embase via Ovid (from 1974) using the strategy in Appendix 4.
-
LILACS (Latin American and Caribbean Health Science Information database, from 1982), using the strategy in Appendix 5.
Trials registers
We (JVA and BNGS) searched the following trial registers up to 17 July 2018 using the strategies in Appendix 6.
-
ISRCTN registry (www.isrctn.com).
-
ClinicalTrials.gov (www.clinicaltrials.gov).
-
the Australian New Zealand Clinical Trials Registry (www.anzctr.org.au).
-
the World Health Organization International Clinical Trials Registry Platform (apps.who.int/trialsearch).
-
the EU Clinical Trials Register (www.clinicaltrialsregister.eu).
Searching other resources
References from included studies
We (JVA and BNGS) checked the bibliographies of included studies for further references to relevant trials.
Adverse Effects
We did not perform a separate search for adverse effects of interventions used for the treatment of morphea. We considered adverse effects and side effects described in included studies only.
Data collection and analysis
We include four 'Summary of findings' tables in this review, summarising the primary and secondary outcomes for the most clinically important comparisons.
-
Oral methotrexate and oral prednisone compared to placebo and oral prednisone for juvenile morphea.
-
Medium‐dose UVA‐1 phototherapy (50 J/cm²) compared to low‐dose UVA‐1 phototherapy (20 J/cm²) for morphea
-
Narrowband UVB phototherapy compared to medium‐dose UVA‐1 phototherapy (50 J/cm²) for morphea
-
Narrowband UVB compared to low‐dose UVA‐1 phototherapy (20 J/cm²) for morphea
Selection of studies
Initially, we assessed only the titles and abstracts of selected articles. After this first assessment, we obtained in full‐text form those studies that appeared to match the inclusion criteria. Two authors (JVA and BNGS) independently selected studies for inclusion in this review; they consulted a third author (VMFT) to settle any disagreements.
Data extraction and management
Two authors (JVA and BNGS) used a data collection form to independently extract data from the included studies. They piloted the data collection form initially on two included studies. The form contained the following essential items: population and intervention characteristics, methods, outcomes, and results. These were used to populate a 'Characteristics of included studies' table. In case of disagreements, they consulted a third author (VFMT). Then two authors (JVA and VTC) entered data into Review Manager 5 (Review Manager 2014).
We obtained translations of studies written in languages other than English, Portuguese, Spanish and French.
Assessment of risk of bias in included studies
Two authors (JVA and BNGS) examined and assessed the risk of bias independently, using a domain‐based evaluation. They evaluated the method of randomisation, allocation concealment, blinding of participants and personnel, blinding of outcome assessment, incomplete outcome data, selective reporting and other potential sources of bias. Each domain could be considered at high, low or unclear risk of bias. The authors resolved disagreements regarding risk of bias with a third author (VFMT), and used the assessment of 'Risk of bias' criteria available in the Cochrane Handbook for Systematic Reviews of Interventions (Higgins 2011).
Measures of treatment effect
For dichotomous outcomes, we expressed the results as risk ratios (RR) with 95% confidence intervals (CI) and as number needed to treat for an additional beneficial outcome (NNTB) figures, where appropriate, with 95% CI and the baseline risk to which it applies. For continuous outcomes, we expressed the results as difference in means (MD) with 95% CI, and would have expressed the results as standardised mean differences (SMD) with 95% CI for the use of diverging assessment tools.
Unit of analysis issues
We based the unit of analysis on the individual participant, the morphea lesion or body region.
We analysed studies that randomised different parts of the body for different interventions similarly to cross‐over trials: we accounted the multiple interventions at different sites (intra‐individual studies) as if they were multiple interventions at different times (cross‐over studies), and compared the measurements of each pair‐wise comparison as if they were a parallel group. We included the mean and standard deviation values of the paired analyses in Review Manager 5 (Review Manager 2014), using the generic inverse variance method. If these data were not available and if studies did not report a paired t‐test, we contacted the authors for individual participant data.
In case of cross‐over trials, we would have analysed only data from the first period, to avoid carry‐over and period effects, considering the clinical evolution of the disease.
We analysed studies with multiple intervention groups through all possible pair‐wise comparisons between the intervention groups. In cases where we required the meta‐analysis to include more than two groups from one study, we would combine groups to create a single pair‐wise comparison in order to overcome a unit‐of‐analysis error of participants of the same study being included twice in the same meta‐analysis.
Dealing with missing data
For missing data, we contacted the first author of the primary study to obtain all the necessary information. We listed the information requested of the study authors in Table 2.
| Study ID | Date contacted | Information requested | Date of reply |
| 26 April 2016, 4 July 2016 | The register of the trial, ethics committee approval and funding source; If it was a single‐centre or double‐centre study; The methods used to generate the random sequence and to conceal it; If the outcome assessor was blinded from knowledge of which intervention a participant received; If authors could provide separate data for children and adults; What was the type of morphea and the sex of the four participants who discontinued the treatment. | 26 April 2016, 5 July 2016 | |
| 26 April 2016, 4 July 2016 | If the study was conducted both at the Dermatologic Centre Ladislado de la Pascua and at the department of Immunology and Rheumatology of the National Institute of Medical Sciences and Nutrition Salvador Zubirán; If the trial was registered and received funding; If there were significant baseline differences between the intervention groups; The method used to conceal the random sequence; If authors could provide the baseline mRSS for the intervention groups separately; If authors could provide the numerical data for adverse events. | 26 April 2016, 7 July 2016 | |
| 26 April 2016, 3 October 2016 | The register of the trial, ethics committee approval, funding source and declaration of interests; The method used to conceal the random sequence; If the outcome assessor of skin score was blinded from knowledge of which intervention a participant received; What was the duration of the follow‐up after treatment; If authors could provide VAS data with standard deviation. | 4 October 2016 | |
| 10 June 2017, 22 July 2018, 26 July 2018, 28 July 2018 | If this study was completed, and if authors have published the results or could provide data; If the trial received funding; The method used to conceal the random sequence; If outcome assessors were blinded from knowledge of which intervention a participant received; If the LoSCAT, PGA‐A and the PGA‐D included only participants with morphea; If there were baseline differences between treatment sites; If any participant left the study before completion; If authors could provide standard deviation values or raw data from the treatment sites. | 11 June 2017, 23 July 2018 27 July 2018 | |
| 26 April 2016, 3 October 2016 | The register of the trial, ethics committee approval, funding source and declaration of interests; The methods used to generate the random sequence and to conceal it; If outcome assessors were blinded from knowledge of which intervention a participant received; If authors included the four participants who experienced side effects in the analysis after treatment; If authors could provide data of the planimetry and skin thickness assessments with standard deviation. | 28 April 2016 | |
| 4 July 2016 | If this study was completed, and if authors have published the results or could provide data. | 7 July 2016 |
Assessment of heterogeneity
We would have assumed statistical heterogeneity to be present when the I² statistic was greater than 50% according to the criteria below. We intended to explore potential sources of discrepancy when substantial heterogeneity was apparent. However, we could not pool data in a meta‐analysis. A rough guide to interpretation is as follows.
-
0% to 40% = might not be important;
-
30% to 60% = may represent moderate heterogeneity*;
-
50% to 90% = may represent substantial heterogeneity*; and
-
75% to 100% = considerable heterogeneity*.
*The importance of the observed value of the I² statistic depends on (i) the magnitude and direction of effects and (ii) the strength of evidence for heterogeneity (e.g. P value from the Chi² test or a confidence interval for the I² statistic).
Assessment of reporting biases
We had planned to assess reporting biases through funnel plots only if we had 10 or more studies in a meta‐analysis.
Data synthesis
We followed the advice given in section 9.1.2 of the Cochrane Handbook for Systematic Reviews of Interventions (Higgins 2011), and analysed our data in Review Manager 5 (Review Manager 2014), using the random‐effects model. We would have used a fixed‐effect analysis if heterogeneity between studies was not detected.
We followed the GRADE Handbook to assess the certainty of the body of evidence (risk of bias, inconsistency, indirectness, imprecision, and publication bias) for each outcome in our 'Summary of findings' tables (as high, moderate, low or very low certainty). We used GRADEpro GDT to create the 'Summary of findings' tables.
Subgroup analysis and investigation of heterogeneity
We had planned to undertake an interaction test across the following subgroups, in case of substantial heterogeneity on our primary outcomes.
-
Children versus adults.
-
Subtype and severity of morphea.
-
Lesions less than six months old versus lesions more than six months old.
-
Plaque morphea versus other forms of morphea.
However, we could not perform any meta‐analysis.
Sensitivity analysis
We had planned to perform sensitivity analyses to examine if studies with high risk of bias were under‐ or overestimating the effects of the interventions for our primary outcomes, but we could only analyse studies individually.
Results
Description of studies
We present information about each study in the Characteristics of included studies tables, Characteristics of excluded studies tables, and Characteristics of ongoing studies table.
Results of the search
Our electronic searches identified 339 records. We removed duplicates and assessed 278 records for eligibility. After screening titles and abstracts, we excluded 254 records and selected 24 articles and trial records to read in full text. We included in this review 14 RCTs that met our eligibility criteria (Azimi 2013; Batchelor 2008; El‐Mofty 2004; Furuzawa‐Carballeda 2012; Hulshof 2000; Hunzelmann 1997; Kreuter 2006; Kroft 2009a; Noakes 2018; Sator 2009; Shalaby 2016; Tang 2006; Yan 2013; Zulian 2011). We excluded seven studies (Bodemer 1999; Didenko 1978; Dortu 1974; Dytoc 2014; Hu 1996; Smirnov 1998; Wang 2008), plus the trial register of the excluded study Wang 2008, which was not an RCT. We list the reasons for exclusions in the Characteristics of excluded studies table. We also identified two trial records that met our eligibility criteria but are not yet published (NCT00812188; NCT01799174); we listed these trial records as awaiting classification and contacted the authors for further information. No ongoing studies were identified. For a further description of our screening process, see the study flow diagram Figure 3.

Study flow diagram.
We requested translations of two excluded studies, one written in Russian and the other in Chinese (Didenko 1978 and Hu 1996 respectively); and translations of three included studies, one written in Chinese, one in German and one in Persian (Yan 2013, Tang 2006 and Azimi 2013, respectively).
Included studies
This review includes 14 RCTs, with a total of 429 participants. We present further details in the Characteristics of included studies tables.
Design
Most included studies had two trial arms (Azimi 2013; Batchelor 2008; Hulshof 2000; Hunzelmann 1997; Kroft 2009a; Noakes 2018; Shalaby 2016; Tang 2006; Yan 2013; Zulian 2011), and four studies had three trial arms (El‐Mofty 2004; Furuzawa‐Carballeda 2012; Kreuter 2006; Sator 2009). Five studies had within‐individual design (Batchelor 2008; Kroft 2009a; Noakes 2018; Sator 2009; Shalaby 2016). Three RCTs were pilot studies (Batchelor 2008; Kroft 2009a; Tang 2006). The included studies compared an active intervention to placebo (Hulshof 2000; Hunzelmann 1997; Kroft 2009a; Zulian 2011), to another active intervention (Azimi 2013; Furuzawa‐Carballeda 2012; Noakes 2018; Shalaby 2016; Tang 2006; Yan 2013), to two other active interventions (El‐Mofty 2004; Kreuter 2006), to no treatment (Batchelor 2008), or to both an active intervention and no treatment (Sator 2009). One study included a third group of healthy untreated individuals as control in immunohistochemistry assessments (Furuzawa‐Carballeda 2012), but we excluded these participants from our review.
Three studies investigated participants with a diagnosis of morphea and also participants with SSc (El‐Mofty 2004; Hulshof 2000; Noakes 2018); we included in the review only data from participants with morphea. Whilst El‐Mofty 2004 and Noakes 2018 reported separate data for all outcomes, Hulshof 2000 reported separate efficacy data but accounted adverse events data for participants with morphea and SSc together.
The duration of the included studies ranged from seven weeks to 15 months from baseline (El‐Mofty 2004 and Hulshof 2000 respectively). The other studies lasted 10 weeks (Shalaby 2016), 12 weeks (Azimi 2013; Batchelor 2008; Kroft 2009a; Noakes 2018), 20 weeks (Kreuter 2006), 24 weeks (Hunzelmann 1997; Tang 2006; Yan 2013), nine months (Furuzawa‐Carballeda 2012), 12 months (Zulian 2011), and 12 months plus 10 weeks (Sator 2009).
Setting
Two included studies were set in Africa (El‐Mofty 2004; Shalaby 2016), two were conducted in Asia (Azimi 2013; Yan 2013), eight in Europe (Batchelor 2008; Hulshof 2000; Hunzelmann 1997; Kreuter 2006; Kroft 2009a; Sator 2009; Tang 2006; Zulian 2011), one in North America (Furuzawa‐Carballeda 2012), and one in Oceania (Noakes 2018).
Three studies were multicentre RCTs (Furuzawa‐Carballeda 2012; Hunzelmann 1997; Zulian 2011).
The settings of the included studies were a dermatologic centre and a national laboratory centre (Furuzawa‐Carballeda 2012), paediatric rheumatology and dermatology centres (Zulian 2011), and university hospitals or medical centres (El‐Mofty 2004; Hulshof 2000; Kreuter 2006; Kroft 2009a; Noakes 2018; Shalaby 2016). Six studies did not describe their setting (Azimi 2013; Batchelor 2008; Hunzelmann 1997; Sator 2009; Tang 2006; Yan 2013).
The date of publication of included studies ranged from 1997 to 2018.
Participants
All included studies investigated individuals with a clinical diagnosis of morphea, and five studies performed histological confirmation (Azimi 2013; Furuzawa‐Carballeda 2012; Kreuter 2006; Tang 2006; Yan 2013). Six studies selected participants with a diagnosis of active morphea, defined as presenting with inflammation, increased size and/or new lesions (Azimi 2013; Hunzelmann 1997; Kreuter 2006; Kroft 2009a; Sator 2009; Zulian 2011). Four studies included participants with at least two morphea lesions (Batchelor 2008; Kroft 2009a; Noakes 2018; Shalaby 2016), and one study included participants with at least three morphea lesions (Sator 2009). Six studies excluded participants with Borrelia burgdorferi infection (Furuzawa‐Carballeda 2012; Hulshof 2000; Hunzelmann 1997; Kreuter 2006; Kroft 2009a; Tang 2006). The sample size of the included studies ranged from three to 70 individuals (Noakes 2018 and Zulian 2011, respectively), and the mean sample size was 31 individuals.
This review includes 429 participants: 294 females, 113 males, and 22 unclear, because one study did not report this information (Batchelor 2008) and four studies only reported the sex of the participants who completed the study (Azimi 2013; El‐Mofty 2004; Sator 2009; Shalaby 2016).
The age of the included participants ranged from 3 to 76 years, but Batchelor 2008 did not report the participants' age, and Hunzelmann 1997 only reported the median age of the groups. Six studies investigated adults aged 18 years or older (Batchelor 2008; Furuzawa‐Carballeda 2012; Kroft 2009a; Noakes 2018; Tang 2006; Yan 2013), one study selected juvenile participants aged 17 years or younger (Zulian 2011), one study did not describe this information (Hunzelmann 1997), and six studies investigated both juvenile and adult participants (Azimi 2013; El‐Mofty 2004; Hulshof 2000; Kreuter 2006; Sator 2009; Shalaby 2016). The study with children included 70 participants (Zulian 2011), but the number of juvenile participants in this review is unclear because the studies with children and adults did not present separate data for each age group.
The participants included in this review had circumscribed morphea (n = 197), linear scleroderma (n = 77; 6 with head variant), generalised morphea (n = 46), and mixed morphea (n = 9). Twenty participants had circumscribed or generalised morphea (Hulshof 2000 did not report the number of participants with each morphea type), and 80 participants had unclear morphea type (El‐Mofty 2004 and Shalaby 2016 only reported the morphea type of the participants who completed the study; Azimi 2013 and Yan 2013 did not report this information). Four studies included participants with circumscribed morphea (Batchelor 2008; Hunzelmann 1997; Kroft 2009a; Sator 2009). Eight studies included participants with more than one type of morphea and reported data for all types combined, thus it was not possible to analyse the subtypes separately (El‐Mofty 2004; Furuzawa‐Carballeda 2012; Hulshof 2000; Kreuter 2006; Noakes 2018; Shalaby 2016; Tang 2006; Zulian 2011).
Ten studies reported the length of the disease evolution, which was up to 10 years in six studies (El‐Mofty 2004; Hulshof 2000; Kroft 2009a; Sator 2009; Shalaby 2016; Tang 2006), and more than 10 years in three studies (Furuzawa‐Carballeda 2012; Kreuter 2006; Yan 2013). In the study with juvenile participants, the mean participants' length of disease was 2.3 years (Zulian 2011).
Five studies reported the treatment participants had previously received (Kreuter 2006; Kroft 2009a; Sator 2009; Tang 2006; Zulian 2011), which included UVB and PUVA phototherapy, topical calcipotriol, topical steroids, topical and oral corticosteroids, systemic steroids, methotrexate, cyclophosphamide, azathioprine, cyclosporin A, chloroquine, penicillamine, and systemic antibiotics. One study only reported that 71% of the participants had previously tried other therapies (Shalaby 2016).
Interventions
The studies included in this review covered heterogenous therapies for morphea. Seven studies investigated topical medications (Batchelor 2008; El‐Mofty 2004; Kreuter 2006; Kroft 2009a; Noakes 2018; Sator 2009; Shalaby 2016), two evaluated intralesional medications (Furuzawa‐Carballeda 2012; Hunzelmann 1997), and five investigated systemic medications (Azimi 2013; Hulshof 2000; Tang 2006; Yan 2013; Zulian 2011). We list details of the interventions in the Characteristics of included studies tables.
1. Topical medications
Five studies investigated phototherapy (Batchelor 2008; El‐Mofty 2004; Kreuter 2006; Sator 2009; Shalaby 2016), but performed different interventions. Thus, we could not pool data from these studies in a meta‐analysis. Batchelor 2008 selected two morphea lesions in each participant, and compared photodynamic therapy (PDT) using 5‐aminolaevulinic acid (ALA), once a week, for six weeks, to no treatment. El‐Mofty 2004 investigated different low doses of UVA phototherapy (5 J/cm², 10 J/cm² and 20 J/cm²), three sessions a week, totalling 20 sessions. Kreuter 2006 assessed treatment with low‐dose UVA‐1 (20 J/cm²), medium‐dose UVA‐1 (50 J/cm²), and narrowband UVB phototherapy, five times a week, during eight weeks. Sator 2009 compared medium‐dose UVA‐1 (70 J/cm²) whole body exposure (including a selected target plaque) with low‐dose UVA‐1 (20 J/cm²) on a second target plaque, four times a week for five weeks and two times a week for another five weeks, and no treatment on a third plaque (unirradiated control). Shalaby 2016 compared fractional carbon dioxide (CO₂) laser therapy, three sessions separated by 1‐month intervals, with low‐dose UVA‐1 (30 J/cm²) phototherapy, three sessions a week for 10 weeks.
One study selected two morphea lesions in each participant, and compared treatment with tacrolimus 0.1% ointment to emollient petrolatum, both applied twice a day, during 12 weeks (Kroft 2009a).
One study selected pairs of treatment sites in each participant, and compared treatment with tranilast plus topical betamethasone valerate 0.1% versus topical betamethasone valerate 0.1%, both applied twice a day, during three months (Noakes 2018). However, participants continued with their routine therapy, which included no adjuvant therapy, methotrexate 20 mg weekly plus hydroxychloroquine 400 mg daily, and methotrexate 10 mg weekly.
2. Intralesional medications
One study compared treatment with polymerised type I collagen (weekly intralesional injections of 0.2 to 1.0 mL polymerised type I collagen/1.66 to 8.3 mg collagen) to methylprednisolone (monthly subcutaneous injections of 0.1 mL ‒ maximum dose of 20 mg or 5.0 mL/month) plus placebo (weekly subcutaneous injections of 0.1 mL placebo), for three months (Furuzawa‐Carballeda 2012).
One study investigated treatment with intralesional injections of interferon gamma (IFN‐γ; 100 µg) and placebo (0.9% sodium chloride) on five consecutive days in the first two weeks and once a week for four more weeks (Hunzelmann 1997).
3. Systemic medications
Two studies investigated treatment with methotrexate (MTX), but performed different interventions (Azimi 2013; Zulian 2011). Thus, we could not pool data from these studies in a meta‐analysis. Azimi 2013 compared hydroxychloroquine (HCQ; 200 mg twice a day) plus topical corticosteroid (authors did not mention the type nor dosage) with methotrexate (15 mg once a week, on Fridays), plus folic acid (1 mg daily, except for Fridays) and topical corticosteroid, for three months. Zulian 2011 investigated treatment with oral MTX (15 mg/m², maximum 20 mg, once a week) compared to placebo, once a week, for 12 months or until disease flare. Both groups also received folic acid supplementation (2.5 mg, 48 hours after each treatment dose), and oral prednisone (1 mg/kg a day, maximum of 50 mg in the morning, during three months, plus one month with gradually decreased dose until discontinuation).
Two studies investigated Traditional Chinese Medicine therapies, but performed different interventions (Tang 2006; Yan 2013). Thus, we could not pool data from these studies in a meta‐analysis. Tang 2006 evaluated treatment with Traditional Chinese Medicine herbs (a 200 ml tea, twice a day), application of a herbal oil to the affected areas for five minutes a day, plus vitamin B6 (three tablets of 20 mg each), for 12 weeks. The ingredients of the tea and oil are specified in the Characteristics of included studies. The control group received phenoxymethylpenicillin 1.2 mg (three times a day) for six weeks, and applied DAC base cream (a standard moisturising base cream from the Deutsche Arzneimittel‐Codex (DAC, German Pharmaceutical Codex)) in the affected areas for five minutes a day, for 12 weeks. Yan 2013 assessed treatment with surrounding needles at the affected areas and the Hegu, Zusanli, Yanglingquan and Waiguan areas (for 30 minutes, every other day), application of a hot herbal compress to the affected areas (for 30 minutes, twice a day), and moxibustion at the affected areas and the Hegu and Zusanli areas (for 30 minutes a day), for six months, plus Centella triterpenes (four tablets of 6 mg, three times a day) and one vitamin E tablet (0.1 g, three times a day). The control group applied a heparin sodium cream to the affected areas, twice a day, for six months, plus Centella triterpenes (four tablets of 6 mg, three times a day) and one vitamin E tablet (0.1 g, three times a day).
One study compared treatment with oral calcitriol (0.75 μg/day before sleeping, for six months, and 1.25 μg/day for three more months) to placebo (before sleeping, for nine months; Hulshof 2000).
Outcomes
The studies included in this review used heterogeneous assessment tools. Ten studies reported outcomes up to six months (Azimi 2013; Batchelor 2008; El‐Mofty 2004; Hunzelmann 1997; Kreuter 2006; Kroft 2009a; Noakes 2018; Shalaby 2016; Tang 2006; Yan 2013), and four studies reported outcomes from six to 12 months (Furuzawa‐Carballeda 2012; Hulshof 2000; Sator 2009; Zulian 2011) from baseline.
Primary outcomes
Only four studies evaluated the global improvement of disease activity or damage assessed by a medical practitioner or by participants (Azimi 2013; Kreuter 2006; Yan 2013; Zulian 2011). Two studies evaluated the clinical response through the modified skin score (MSS), a score (from 0 to 42) developed for SSc, assessing skin thickness and pliability (from 0, normal skin, to 3, unable to pinch or move skin) plus involved area (from 0, no involvement, to 3 more than 67% involvement) in seven body regions (Zachariae 1994): Azimi 2013 after the 3‐month treatment; and Kreuter 2006 after the eight‐week treatment and at the 3‐month follow‐up after treatment. Yan 2013 assessed the clinical response after the 6‐month treatment based on Traditional Chinese Medicine criteria, considering skin hardening, pigmentation, dysfunction and hair loss (not effective: less than 30% improvement; effective: 30% to 70%; remarkably effective: 70% to 95%; clinical recovery: more than 95% improvement). Zulian 2011 calculated the rate of response to treatment at the end of the 12‐month treatment based on participants who met all three response criteria (skin score rate equal to or less than 1, indicating decreased lesion extension; at least a 10% decrease in the percentage thermal change from baseline, indicating decreased lesion inflammation; and absence of new lesions). Zulian 2011 also evaluated the physician's global assessment of disease severity and the parents' global assessment of the participant’s overall well‐being through the Visual Analogue Scale (VAS; 100 mm).
All included studies addressed adverse effects of the interventions (Azimi 2013; Batchelor 2008; El‐Mofty 2004; Furuzawa‐Carballeda 2012; Hulshof 2000; Hunzelmann 1997; Kreuter 2006; Kroft 2009a; Noakes 2018; Sator 2009; Shalaby 2016; Tang 2006; Yan 2013; Zulian 2011).
Secondary outcomes
All included studies evaluated the improvement of disease activity, using heterogeneous assessment tools. Six studies evaluated skin softening (Azimi 2013; Batchelor 2008; El‐Mofty 2004; Kreuter 2006; Kroft 2009a; Yan 2013), four studies assessed reduction in lesion size (Hunzelmann 1997; Kroft 2009a; Tang 2006; Zulian 2011), eight studies assessed reduction in skin thickness (Batchelor 2008; Furuzawa‐Carballeda 2012; Hulshof 2000; Hunzelmann 1997; Kreuter 2006; Sator 2009; Shalaby 2016; Tang 2006), three studies investigated fading signs of inflammation (Azimi 2013; Kreuter 2006; Zulian 2011), and three studies investigated the progression of the disease (Furuzawa‐Carballeda 2012; Hunzelmann 1997; Zulian 2011).
-
Two studies assessed the participants’ estimate of skin tightness in the morphea lesions through the VAS (from 0 to 10, maximum): Azimi 2013 after the 3‐month treatment, and Kreuter 2006 after the eight‐week treatment. Kreuter 2006 also evaluated skin density with a digital 20‐MHz ultrasound scanner after the eight‐week treatment. Two studies evaluated skin hardness through a durometer score: Batchelor 2008 (score from 0 to 25) at the 12‐week follow‐up, and Kroft 2009a (score from 0 to 1000, maximum) after 12‐week treatment. El‐Mofty 2004 graded by palpation of the morphea lesions the clinical response based on skin softening at the end of the seven‐week treatment (very good response: marked skin softening, almost normal skin texture; good response: moderate softening; fair response: mild softening; and poor response: no change in skin texture). Yan 2013 assessed skin sclerosis after the 6‐month treatment based on Steen criteria, a score used to evaluate SSc (from 0 to 90, maximum: sclerosis of 30 body regions rated from 0, none, to 3, severe; Steen 1982).
-
Three studies measured the size of the lesions manually: Hunzelmann 1997 at the 24‐week follow‐up, Kroft 2009a after the 12‐week treatment, and Tang 2006 after the 12‐week treatment and at the 12‐week follow‐up after treatment. Zulian 2011 measured the morphea lesions through a computerised skin scoring system, and calculated a skin score rate (SSR) based on the ratio between lesion and body surface area at baseline and after the 12‐month treatment (SSR equal to or less than 1 indicates decreased lesion extension; SSR greater than 1, increase).
-
Four studies evaluated skin thickness through a clinical score: Batchelor 2008 at the 12‐week follow‐up (score from 0, normal skin, to 3, unable to pinch or move skin ‒ hidebound), Furuzawa‐Carballeda 2012 after the 3‐month treatment and at the 6‐month follow‐up after treatment (score from 0, normal, to 4, extreme thickening; adapted from the modified Rodnan Skin Score (mRSS), used to assess SSc; Clements 1995), Hulshof 2000 after the 9‐month treatment and at the 6‐month follow‐up after treatment (a semi‐quantitative measure from 0 to 66, maximum thickening, developed for SSc, assessing skin thickness of 22 body regions from 0, normal, to 3, hidebound skin; Kahaleh 1985), and Hunzelmann 1997 at the 24‐week follow‐up (score from 0, normal, to 3, severe thickening or hidebound skin). One study evaluated skin thickness via ultrasound biomicroscopy with very high frequency (50 MHz) at the 10‐week follow‐up (Shalaby 2016), and three studies assessed skin thickness via high‐frequency ultrasound (20 MHz): Kreuter 2006 after the eight‐week treatment; Sator 2009 at the 3‐month, 6‐month, and 12‐month follow‐up after treatment; and Tang 2006 after the 12‐week treatment and at the 12‐week follow‐up after treatment).
-
Two studies assessed the participants' estimate of pruritus on the morphea lesions through the VAS (from 0 to 10, maximum): Azimi 2013 after the 3‐month treatment, and Kreuter 2006 after the 8‐week treatment. Zulian 2011 evaluated the degree of inflammation through infrared thermography, and calculated the percentage thermal change from baseline after the 12‐month treatment (ΔTh%; negative value indicates improvement and positive value, worsening).
-
Three studies assessed the occurrence of new morphea lesions: Furuzawa‐Carballeda 2012 after the 3‐month treatment and at the 6‐month follow‐up after treatment, Hunzelmann 1997 after the six‐week treatment and at the 18‐week follow‐up after treatment, and Zulian 2011 during the 12‐month follow‐up.
Four intra‐individual studies adapted scores of global evaluation of improvement of disease activity and damage to assess individual lesions (Kroft 2009a; Noakes 2018; Sator 2009; Shalaby 2016). Thus, we analysed this data as an indicator of disease activity. Kroft 2009a adapted the DIET score (dyspigmentation, induration, erythema, telangiectasia; Dytoc 2005) to assess the 12‐week treatment (from 0 to 15, maximum; dyspigmentation, induration, erythema, telangiectasia and atrophy of the lesions scored from 0, none, to 3, severe); Sator 2009 used a score (from 0 to 7) assessing atrophy (0, absent, or 1, present) and intensity of erythema and induration (each from 0, absent, to 3, maximum), at the 3‐month, 6‐month, and 12‐month follow‐up after treatment; Noakes 2018 used the LoSCAT (Arkachaisri 2010), which is the combination of the mLoSSI (it rates new or enlarged lesions within one month from 0 = none to 3 = new/enlarged; erythema from 0 = none to 3 = dark red/violaceous; and skin thickness from 0 = none to 3 = marked) and the LoSDI (it rates dermal atrophy from 0 = none to 3 = obvious ‘cliff drop’; subcutaneous atrophy from 0 = none to 3 = marked; and dyspigmentation from 0 = none to 3 = marked). However, the LoSCAT assesses these measures for 18 body sites, and Noakes 2018 used this tool to compare individual sites. Noakes 2018 also used the Physician Global Assessment of Activity (PGA‐A; from 0 = inactive, to 100 = markedly active), included in the LoSCAT, to evaluate individual lesions. Shalaby 2016 adapted the LoSCAT to assess the treatments (from 0 to 12; thickness, dermal atrophy, dyschromia, and erythema scored each from 0 to 3, maximum). Shalaby 2016 graded the improvement (decrease) on LoSCAT at the 10‐week follow‐up as: poor = no improvement; fair = less than 40% decrease from baseline; good = between 40% and 59% decrease from baseline; very good = 60% or more decrease from baseline. Shalaby 2016 also evaluated the participants’ satisfaction with both treatments (intra‐individual control) at the 10‐week follow‐up (regarding overall improvement, feasibility, and side effects) through a standardised satisfaction score (from 0 to 3, satisfied, best possible cosmetic result; Leheta 2013).
Two studies evaluated the improvement of disease damage through functional impairment of motor activity (Yan 2013; Zulian 2011). Yan 2013 assessed, after the 6‐month treatment, scores of joint function based on Kahan criteria (from 0 to 66, maximum impact; developed for SSc, assessing disease impact in 11 daily activities from 0, no difficulty, to 3, unable to perform; Guillevin 1983; Kahan 1989), and joint pain based on Traditional Chinese Medicine syndromes criteria (unclear total score). Zulian 2011 used the validated translated version of the Childhood Health Assessment Questionnaire (C‐HAQ) disability index, which presents a 3‐point scale (from 0, no difficulty, to 3, unable to perform) for 30 items evaluating eight areas of daily functioning (total score from 0 to 90; Ruperto 2001).
One study used the Physician Global Assessment of Damage (PGA‐D; from 0 = no damage, to 100 = marked damage), which is included in the LoSCAT, to evaluate individual lesions (Noakes 2018).
In case of missing data, we contacted the first author of the primary study to obtain all the necessary information. Some authors responded to our e‐mail contact (El‐Mofty 2004; Furuzawa‐Carballeda 2012; Kreuter 2006; Tang 2006), but not all could provide us with the missing data.
Funding sources
Two included studies received funding from universities (Azimi 2013; Shalaby 2016), four studies had government or association scholarships (Hunzelmann 1997; Tang 2006; Zulian 2011; Yan 2013), one study received medication from the pharmaceutical industry (Hulshof 2000), six studies had no funding (El‐Mofty 2004; Furuzawa‐Carballeda 2012; Kreuter 2006; Kroft 2009a; Noakes 2018; Sator 2009), and one study did not report this information (Batchelor 2008).
Excluded studies
After reading 24 articles and trial records in full text, we excluded five that were not RCTs: Bodemer 1999 investigated calcitriol for treating morphea in seven young participants; Didenko 1978 reported experiences with ultrasonics and lidase phonophoresis for treating various forms of scleroderma; Dortu 1974 reported experiences with the anti‐inflammatory agent Elarzone‐Dausse in disorders affecting the venous system; Hu 1996 investigated prostaglandin E1 and propylene glycol alginate sodium for treating urticarial vasculitis, which appears in the progression of SSc; and the abstract Smirnov 1998 reported a non‐randomised trial assessing Climen (combined estrogenic and gestagenic drug) for treating localised scleroderma in 17 postmenopausal women aged from 45 to 56, and 20 women in the control group.
We also excluded two trials that were not randomised, but we could only conclude that after reading the full‐text: Dytoc 2014 investigated imiquimod 5% cream for treating plaque morphea in 25 participants, and applied vehicle to a control plaque (intra‐individual control); and Wang 2008 assessed UVA‐1 phototherapy for treating four participants with morphea, 10 participants with scleroderma and four participants with sclerodermatous graft‐vs‐host disease, and also the pigmentation response of UVA‐1 phototherapy in eight healthy participants. We also identified a trial record of a randomised cross‐over study assessing the effectiveness of UVA1 phototherapy in the treatment of skin conditions with altered dermal matrix, including morphea (NCT00476801). However, we contacted the principal investigator and this was the trial register of the excluded study Wang 2008, which was not an RCT.
We list further details in the Characteristics of excluded studies tables.
Studies awaiting classification
We found two relevant trials records of studies evaluating the treatment of morphea (NCT00812188; NCT01799174). The studies have not been published yet and we include them as ‘studies awaiting classification’. NCT00812188 is an open‐label randomised trial of adults with plaque morphea comparing high‐dose UVA‐1 (120 J/cm²) three times a week for 12 weeks to one morphea plaque and fluocinonide 0.05% cream to another morphea plaque twice daily during the same period; or medium‐dose UVA‐1 (60 J/cm²) three times a week for 12 weeks to one morphea plaque and fluocinonide 0.05% cream to another morphea plaque twice daily during the same period. Authors described a 5‐year follow‐up but did not indicate any outcome measures. NCT01799174 is a double‐blind randomised trial of adults and children with active morphea (all types) comparing medium‐dose (70 J/cm²) phototherapy three times a week during 10 weeks versus "sham" UVA1 (0 J/cm²) phototherapy three times a week during 10 weeks. Authors described a 3‐year follow‐up and selected, as primary outcome measure, the Localized Scleroderma Severity Index (LoSSI), and as secondary measures, the physician's global assessment of disease activity (PGA‐A).
We list further details in the Characteristics of studies awaiting classification tables.
Risk of bias in included studies
We independently assessed the risk of bias in each included study. We represented each 'Risk of bias' item as percentages across all included studies in Figure 4, and each 'Risk of bias' item for each included study in Figure 5. We listed further details of the judgment of risk of bias in the Characteristics of included studies tables.

Risk of bias graph: review authors' judgements about each 'Risk of bias' item represented as percentages across all included studies.

Risk of bias summary: review authors' judgements about each 'Risk of bias' item for each included study.
Allocation
Ten studies used adequate methods to generate the random sequence, producing comparable groups, thus we rated the majority of studies at low risk of bias for this domain (Figure 4; Figure 5). The methods included: randomisation lists (Azimi 2013; Hulshof 2000; Noakes 2018; Sator 2009; Zulian 2011), random number generation and block randomisation (Furuzawa‐Carballeda 2012), random number table (Yan 2013), shuffling envelopes (El‐Mofty 2004), and asking the participants to throw dice or pick a sealed envelope (Kreuter 2006 and Shalaby 2016, respectively). One of these studies informed us the randomisation method in a personal communication (El‐Mofty 2004). The other four studies did not describe the randomisation method in sufficient detail to assess whether the allocation produced comparable groups, thus presenting unclear risk of bias (Batchelor 2008; Hunzelmann 1997; Kroft 2009a; Tang 2006).
Nine studies provided insufficient information to judge if allocation was concealed (Azimi 2013; Batchelor 2008; Hulshof 2000; Hunzelmann 1997; Kroft 2009a; Sator 2009; Tang 2006; Yan 2013; Zulian 2011), thus we considered the majority of studies at unclear risk of bias for this domain (Figure 4; Figure 5). We rated the other five studies at low risk of bias: three studies used sealed envelopes (El‐Mofty 2004; Furuzawa‐Carballeda 2012; Shalaby 2016), one study used dice to assign participants (Kreuter 2006), and one intra‐individual study provided the list to only one investigator (Noakes 2018). Three of these studies informed us of the allocation concealment method in a personal communication (El‐Mofty 2004; Furuzawa‐Carballeda 2012; Noakes 2018).
Blinding
Eight studies reported no blinding of participants and personnel to the knowledge of which intervention a participant received, thus we considered the majority of studies at high risk of performance bias (Figure 4; Figure 5). Two studies had an untreated lesion as control (Batchelor 2008; Sator 2009), two studies performed different phototherapy interventions (El‐Mofty 2004; Kreuter 2006), and three studies performed heterogenous interventions (Shalaby 2016; Tang 2006; Yan 2013). One study did have identical capsules; however, the intervention group took one capsule once a week whilst the control group took a capsule twice a day, thus, presenting high risk of bias (Azimi 2013). We rated five studies who reported blinding of participants and personnel at low risk of performance bias: four studies used placebo (Furuzawa‐Carballeda 2012; Hulshof 2000; Kroft 2009a; Zulian 2011), and one study had the intervention drugs prepared as identical ointments (Noakes 2018). We considered one study, which reported a double‐blind method but provided insufficient information to judge if participants and personnel were blinded, at unclear risk of performance bias (Hunzelmann 1997).
We rated five studies which reported unblinded outcome assessment at high risk of detection bias (Batchelor 2008; El‐Mofty 2004; Kreuter 2006; Sator 2009; Tang 2006). One study attempted to blind outcome assessors, but could not maintain it because of the pigmentation induced by the PDT treatment (Batchelor 2008). We considered five studies which reported blinded outcome assessment at low risk of detection bias (Azimi 2013; Furuzawa‐Carballeda 2012; Hulshof 2000; Shalaby 2016; Zulian 2011). We rated the other three studies, which provided insufficient information to judge if the outcome assessors were effectively blinded from knowledge of which intervention a participant received, at unclear risk of detection bias (Hunzelmann 1997; Kroft 2009a; Yan 2013). Three studies informed us about blinding of outcome assessors in a personal communication (El‐Mofty 2004; Noakes 2018; Tang 2006).
Incomplete outcome data
We rated eight studies at low risk of attrition bias (Figure 4; Figure 5). Two studies had a null dropout rate (Kroft 2009a; Noakes 2018), three studies performed intention‐to‐treat (ITT) analysis (Furuzawa‐Carballeda 2012; Hulshof 2000; Zulian 2011), and three studies did not perform ITT analysis but the drop‐out rates probably do not represent serious threats to validity of the results (El‐Mofty 2004; Kreuter 2006; Yan 2013).
We considered the other six included studies at high risk of attrition bias (Figure 4; Figure 5). Five studies did not perform ITT analysis, analysing only participants who completed the treatment (Azimi 2013; Batchelor 2008; Sator 2009; Shalaby 2016; Tang 2006); and one study provided insufficient information to judge if the analysis included the participants who withdrew from the study (Hunzelmann 1997).
Selective reporting
We rated three studies which reported all outcomes pre‐specified in the protocol at low risk of reporting bias (Azimi 2013; Noakes 2018; Shalaby 2016). We considered six studies at high risk of reporting bias: Batchelor 2008 reported durometer readings data only for treated lesions; Kreuter 2006, Sator 2009 and Tang 2006 reported no standard deviation values; Zulian 2011 reported no numerical data for the C‐HAQ assessment; and Hunzelmann 1997 reported neither numerical data for outcomes nor information regarding the number of participants randomised and the number of participants in each group. We rated the other five studies at unclear risk of reporting bias (Figure 4; Figure 5), because authors did not register a protocol (El‐Mofty 2004; Furuzawa‐Carballeda 2012; Hulshof 2000; Kroft 2009a; Yan 2013).
Three studies provided us outcome data in a personal communication: Furuzawa‐Carballeda 2012 (adverse events data), Kreuter 2006 (length of the follow‐up after treatment), and Noakes 2018 (standard deviation values).
Other potential sources of bias
We considered the majority of studies at unclear risk of other potential sources of bias (Figure 4; Figure 5) because they either used global tools of assessment developed and validated for SSc (Azimi 2013; Hulshof 2000; Kreuter 2006), non‐validated global tools of assessment (El‐Mofty 2004; Yan 2013), or adapted clinical scores to assess individual lesions (Batchelor 2008; Furuzawa‐Carballeda 2012; Hunzelmann 1997; Kroft 2009a; Noakes 2018; Sator 2009; Shalaby 2016; Tang 2006). One study used a global tool of assessment which is not validated but considers the disease activity and also the disease progression in children at a growing stage; hence, it was considered at low risk of bias (Zulian 2011).
All studies reported no significant differences in baseline measurements (Azimi 2013; Batchelor 2008; El‐Mofty 2004; Furuzawa‐Carballeda 2012; Hulshof 2000; Hunzelmann 1997; Kreuter 2006; Kroft 2009a; Noakes 2018; Sator 2009; Shalaby 2016; Tang 2006; Yan 2013; Zulian 2011). Two studies provided us this data in a personal communication (Furuzawa‐Carballeda 2012; Noakes 2018).
Effects of interventions
See: Summary of findings for the main comparison Oral methotrexate and oral prednisone compared to placebo and oral prednisone for juvenile morphea; Summary of findings 2 Medium‐dose UVA‐1 phototherapy (50 J/cm²) compared to low‐dose UVA‐1 phototherapy (20 J/cm²) for morphea; Summary of findings 3 Narrowband UVB phototherapy compared to medium‐dose UVA‐1 phototherapy (50 J/cm²) for morphea; Summary of findings 4 Narrowband UVB phototherapy compared to low‐dose UVA‐1 phototherapy (20 J/cm²) for morphea
We assessed the outcomes prespecified in our protocol to determine which treatments for morphea lead to the best outcomes up to six months and from six to 12 months. We followed the GRADE criteria to assess the certainty of the body of evidence for each outcome.
This review includes 20 pair‐wise comparisons. The comparisons of the studies were heterogenous, and we could not pool data in a meta‐analysis.
We summarise the outcomes for the most important comparisons in the summary of findings Table for the main comparison, summary of findings Table 2, summary of findings Table 3, and summary of findings Table 4
1. Medium‐dose UVA‐1 (50 J/cm²) versus low‐dose UVA‐1 (20 J/cm²) phototherapy
See summary of findings Table 2.
Participants: children and adults with active morphea (circumscribed morphea, linear scleroderma (with trunk/limb variant and head variant), generalised morphea, or mixed morphea).
Primary outcome 1: Global improvement of disease activity or damage assessed by a medical practitioner or by participants
The modified skin score (MSS; from 0 to 42) evaluates skin thickness and pliability (from 0, normal skin, to 3, unable to pinch or move skin) plus involved area (from 0, no involvement, to 3 = more than 67% involvement) in seven body regions. A decrease in the MSS indicates global improvement of disease activity. The medium‐dose UVA‐1 (50 J/cm²) phototherapy group had a higher MSS score than the low‐dose UVA‐1 (20 J/cm²) group after the eight‐week treatment (MD 1.60, 95% CI −1.70 to 4.90; 44 participants; low‐certainty evidence; Analysis 1.1), and at the 3‐month follow‐up after treatment (MD 2.50, 95% CI −1.90 to 6.90; 44 participants; low‐certainty evidence; Analysis 1.2) (Kreuter 2006). However, the confidence intervals include the null effect and appreciable benefit.
Primary outcome 2: Adverse effects of the interventions, including local and systemic reactions
All 44 participants treated with UVA‐1 had mild tanning after the eight‐week treatment (RR 1.00, 95% CI 0.91 to 1.10; low‐certainty evidence; Analysis 1.3) (Kreuter 2006).
Secondary outcome 1: Improvement of disease activity
Only 36 of the 44 participants completed the 20 MHz ultrasound examinations, for which lower values indicate improvement of disease activity (Kreuter 2006). The skin density of the morphea lesions after the eight‐week treatment was lower in the medium‐dose UVA‐1 phototherapy (50 J/cm²) group than in the low‐dose UVA‐1 (20 J/cm²) group (MD −16.43 µm, 95% CI −34.87 to 2.01; low‐certainty evidence; Analysis 1.4). However, the corium thickness of the morphea lesions after the eight‐week treatment was higher in the medium‐dose UVA‐1 (50 J/cm²) group (MD 196.29 µm, 95% CI −162.28 to 554.86; very low certainty evidence; Analysis 1.5). Nevertheless, we are uncertain of these results due to the wide confidence intervals, which include the null effect and appreciable benefit and harm.
Authors reported that both groups had a significant improvement in the VAS of the participants’ estimate of skin tightness on the morphea lesions (from 0 to 10, maximum) after the eight‐week treatment, decreasing from 6.1 to 4.3 (P < 0.05) in the medium‐dose UVA‐1 phototherapy group; and from 4.4 to 2.7 (P = 0.05) in the low‐dose UVA‐1 phototherapy group. Only the medium‐dose UVA‐1 phototherapy group had a significant improvement in the VAS of the participants’ estimate of pruritus, decreasing from 4.0 to 2.4 (P < 0.05) in the medium‐dose UVA‐1 phototherapy group; and from 2.8 to 2.1 (P = 0.15) in the low‐dose UVA‐1 phototherapy group. However, authors reported mean values without standard deviations (Kreuter 2006).
Secondary outcome 2: Improvement of disease damage
Not measured.
2. Narrowband UVB versus MD UVA‐1 (50 J/cm²) phototherapy
See summary of findings Table 3.
Participants: children and adults with active morphea (circumscribed morphea, linear scleroderma (with trunk/limb variant and head variant), generalised morphea, or mixed morphea).
Primary outcome 1: Global improvement of disease activity or damage assessed by a medical practitioner or by participants
The narrowband UVB phototherapy group had a lower MSS score (where high values represent a worse outcome) than the medium‐dose UVA‐1 (50 J/cm²) group after the eight‐week treatment (MD −1.70, 95% CI −5.27 to 1.87; 35 participants; low‐certainty evidence; Analysis 2.1), and at the 3‐month follow‐up after treatment (MD −2.10, 95% CI −6.73 to 2.53; 35 participants; low‐certainty evidence; Analysis 2.2) (Kreuter 2006). However, the confidence intervals include the null effect and appreciable harm.
Primary outcome 2: Adverse effects of the interventions, including local and systemic reactions
All 17 participants treated with medium‐dose UVA‐1 (50 J/cm²) phototherapy had mild tanning after the eight‐week treatment, whilst no participant from the narrowband UVB group (18 participants) had this adverse event (RR 0.03, 95% CI 0.00 to 0.42; low‐certainty evidence; Analysis 2.3) (Kreuter 2006). Three participants treated with narrowband UVB phototherapy had transient erythema whilst no participant from the medium‐dose UVA‐1 group had this adverse event (RR 6.63, 95% CI 0.37 to 119.59; low‐certainty evidence; Analysis 2.4). However, we are uncertain of this result due to the wide confidence intervals, which includes the null effect and appreciable benefit.
Secondary outcome 1: Improvement of disease activity
Only 28 of the 35 participants completed the 20 MHz ultrasound examinations, for which lower values indicate improvement of disease activity (Kreuter 2006). The skin density of the morphea lesions after the eight‐week treatment was higher in the narrowband UVB phototherapy group than in the medium‐dose UVA‐1 (50 J/cm²) group (MD 17.78 µm, 95% CI −6.08 to 41.64; low‐certainty evidence; Analysis 2.5). However, the corium thickness of the morphea lesions after the eight‐week treatment was lower in the narrowband UVB group (MD −78.35 µm, 95% CI −528.59 to 371.89; very low certainty evidence; Analysis 2.6). Nevertheless, we are uncertain of these results due to the wide confidence intervals, which include the null effect and appreciable benefit and harm.
Authors reported that both groups had a significant improvement in the VAS of the participants’ estimate of skin tightness on the morphea lesions (from 0 to 10, maximum) after the eight‐week treatment, decreasing: from 3.3 to 2.8 (P < 0.05) in the narrowband UVB group; and 6.1 to 4.3 (P < 0.05) in the medium‐dose UVA‐1 phototherapy group. Only the medium‐dose UVA‐1 phototherapy group had a significant improvement in the VAS of the participants’ estimate of pruritus, decreasing from 4.0 to 2.4 (P < 0.05) in the medium‐dose UVA‐1 phototherapy group; and from 2.3 to 1.8 (P = 0.16) in the narrowband UVB group. However, authors reported mean values without standard deviations (Kreuter 2006).
Secondary outcome 2: Improvement of disease damage
Not measured.
3. Narrowband UVB versus LD UVA‐1 phototherapy (20 J/cm²)
See summary of findings Table 4.
Participants: children and adults with active morphea (circumscribed morphea, linear scleroderma (with trunk/limb variant and head variant), generalised morphea, or mixed morphea).
Primary outcome 1: Global improvement of disease activity or damage assessed by a medical practitioner or by participants
The narrowband UVB phototherapy group had a lower MSS score (where high values represent a worse outcome) than the low‐dose UVA‐1 (20 J/cm²) group after the eight‐week treatment (MD −0.10, 95% CI −2.49 to 2.29; 45 participants; low‐certainty evidence; Analysis 3.1) ( Kreuter 2006). However, the narrowband UVB phototherapy group had a higher MSS score at the 3‐month follow‐up after treatment (MD 0.40, 95% CI −2.17 to 2.97; low‐certainty evidence; Analysis 3.2). Nevertheless, the confidence intervals include the null effect and appreciable benefit and harm.
Primary outcome 2: Adverse effects of the interventions, including local and systemic reactions
All 27 participants treated with low‐dose UVA‐1 had mild tanning after the eight‐week treatment, whilst no participant from the narrowband UVB group (18 participants) had this adverse event (RR 0.03, 95% CI 0.00 to 0.41; low‐certainty evidence; Analysis 3.3) (Kreuter 2006). Three participants treated with narrowband UVB phototherapy had transient erythema whilst no participant from the low‐dose UVA‐1 group had this adverse event (RR 10.32, 95% CI 0.56 to 188.49; low‐certainty evidence; Analysis 3.4). However, we are uncertain of this result due to the wide confidence interval, which includes the null effect.
Secondary outcome 1: Improvement of disease activity
Only 32 of the 45 participants completed the 20 MHz ultrasound examinations, for which lower values indicate improvement of disease activity (Kreuter 2006). The skin density of the morphea lesions after the eight‐week treatment was higher in the narrowband UVB phototherapy group than in the low‐dose UVA‐1 (20 J/cm²) (MD 1.35 µm, 95% CI −19.39 to 22.09; very low certainty evidence; Analysis 3.5). The corium thickness of the morphea lesions after the eight‐week treatment was also higher in the narrowband UVB phototherapy group (MD 117.94 µm, 95% CI −311.20 to 547.08; very low certainty evidence; Analysis 3.6). However, we are uncertain of these results due to the wide confidence intervals, which include the null effect and appreciable benefit and harm.
Authors reported that both groups had a significant improvement in the VAS of the participants’ estimate of skin tightness on the morphea lesions (from 0 to 10, maximum) after the eight‐week treatment, decreasing from 3.3 to 2.8 (P < 0.05) in the narrowband UVB group; and 4.4 to 2.7 (P = 0.05) in the medium‐dose UVA‐1 phototherapy group. Authors reported no changes in the VAS of the participants’ estimate of pruritus, decreasing: from 2.3 to 1.8 (P = 0.16) in the narrowband UVB group; and from 2.8 to 2.1 (P = 0.15) in the low‐dose UVA‐1 phototherapy group. However, authors reported mean values without standard deviation (Kreuter 2006).
Secondary outcome 2: Improvement of disease damage
Not measured.
4. Medium‐dose (70 J/cm²) UVA‐1 phototherapy versus no treatment
Participants: children and adults with active circumscribed morphea.
Primary outcome 1: Global improvement of disease activity or damage assessed by a medical practitioner or by participants
Not measured.
Primary outcome 2: Adverse effects of the interventions, including local and systemic reactions
In the intra‐individual study comparing medium‐dose (70 J/cm²) UVA‐1 versus no treatment, all 14 participants had tanning, except on the plaque shielded from irradiation (RR 29.00, 95% CI 1.90 to 443.28; very low certainty evidence; Analysis 4.1) (Sator 2009). Two participants reported painless UVA‐1 erythema (RR 4.41, 95% CI 0.23 to 84.79; very low certainty evidence; Analysis 4.2); and two other participants reported pruritus during the first week of treatment (RR 4.41, 95% CI 0.23 to 84.79; very low certainty evidence; Analysis 4.3).
Secondary outcome 1: Improvement of disease activity
Sator 2009 reported a significantly greater reduction of skin thickness (measured through 20 MHz ultrasound, where high values represent a worse outcome) of lesions treated with medium‐dose (70 J/cm²) UVA‐1 than untreated lesions after treatment and at the 3‐month, 6‐month and 12‐month follow‐up after treatment. However, authors reported median values without standard deviations and did not use the paired t‐test to compare groups. The lesions treated with medium‐dose (70 J/cm²) UVA‐1 reported a median skin thickness of 2.32 mm (1.92 to 2.55) at baseline, which reduced: −0.27 mm (−0.5 to −0.2) immediately after UVA‐1; −0.50 mm (−0.6 to −0.3) three months after UVA‐1; −0.53 mm (−0.7 to −0.4) six months after UVA‐1; and −0.64 mm (−0.8 to −0.5) one year after UVA‐1. The untreated lesions had a median skin thickness of 1.82 mm (1.49 to 2.38) at baseline, which reduced: −0.09 mm (−0.2 to −0.1) immediately after UVA‐1; −0.19 mm (−0.2 to −0.1) three months after UVA‐1; −0.21 mm (−0.3 to −0.1) six months after UVA‐1; and −0.225 mm (−0.7 to −0.1) one year after UVA‐1.
Sator 2009 reported that the lesions irradiated with medium‐dose (70 J/cm²) UVA‐1 phototherapy had a decreased median skin score (from 0 to 7: atrophy rated as 0 = absent or 1 = present, and intensity of erythema and induration, each from 0 to 3, maximum) during the study period compared to the untreated lesions. However, authors reported median values without standard deviation and did not use the paired t‐test to compare groups. The lesions treated with medium‐dose (70 J/cm²) UVA‐1 phototherapy had a median skin score of 4.1 at baseline; 2.1 immediately after UVA‐1; 1.9 three months after UVA‐1; 1.6 six months after UVA‐1; and 1.1 one year after UVA‐1. The untreated lesions had a median skin score of 3.4 at baseline; 3.2 immediately after UVA‐1; 3.1 three months after UVA‐1; 2.9 six months after UVA‐1; and 2.8 one year after UVA‐1.
Secondary outcome 2: Improvement of disease damage
Not measured.
5. Medium‐dose (70 J/cm²) UVA‐1 versus low‐dose (20 J/cm²) UVA‐1 phototherapy
Participants: children and adults with active circumscribed morphea.
Primary outcome 1: Global improvement of disease activity or damage assessed by a medical practitioner or by participants
Not measured.
Primary outcome 2: Adverse effects of the interventions, including local and systemic reactions
In the intra‐individual study comparing medium‐dose (70 J/cm²) UVA‐1 versus low‐dose (20 J/cm²) UVA‐1 phototherapy, all 14 participants had tanning (Sator 2009). Two participants reported painless UVA‐1 erythema and two other participants reported pruritus during the first week of treatment. However, authors did not present separate adverse events data for lesions treated with medium‐dose (70 J/cm²) and low‐dose (20 J/cm²) UVA‐1 phototherapy.
Secondary outcome 1: Improvement of disease activity
Sator 2009 reported a significantly greater reduction of skin thickness (measured through 20 MHz ultrasound, where high values represent a worse outcome) of lesions treated with medium‐dose (70 J/cm²) UVA‐1 than lesions treated with low‐dose (20 J/cm²) UVA‐1 at the 3‐month, 6‐month and 12‐month follow‐up after treatment. However, authors reported median values without standard deviation and did not use the paired t‐test to compare groups. The lesions treated with medium‐dose (70 J/cm²) UVA‐1 had a median skin thickness of 2.32 mm (1.92 to 2.55) at baseline, which reduced: −0.27 mm (−0.5 to −0.2) immediately after UVA‐1; −0.50 mm (−0.6 to −0.3) three months after UVA‐1; −0.53 mm (−0.7 to −0.4) six months after UVA‐1; and −0.64 mm (−0.8 to −0.5) one year after UVA‐1. The lesions treated with low‐dose (20 J/cm²) UVA‐1 had a median skin thickness of 1.71 mm (1.44 to 2.14) at baseline, which reduced: −0.195 mm (−0.2 to −0.1) immediately after UVA‐1; −0.28 mm (−0.4 to −0.2) three months after UVA‐1; −0.30 mm (−0.4 to −0.2) six months after UVA‐1; and −0.385 mm (−0.5 to −0.2) one year after UVA‐1.
Sator 2009 reported that both lesions irradiated with medium‐dose (70 J/cm²) and low‐dose (20 J/cm²) UVA‐1 phototherapy had a decreased median skin score (where high values represent a worse outcome) during the study period, and found no significant differences between the two dose regimens. However, authors reported median values without standard deviation and did not use the paired t‐test to compare groups. The lesions treated with medium‐dose (70 J/cm²) UVA‐1 phototherapy had a median skin score of: 4.1 at baseline; 2.1 immediately after UVA‐1; 1.9 three months after UVA‐1; 1.6 six months after UVA‐1; and 1.1 one year after UVA‐1. The lesions treated with low‐dose (20 J/cm²) UVA‐1 phototherapy had a median skin score of: 3.4 at baseline; 1.8 immediately after UVA‐1; 1.4 three months after UVA‐1; 1.2 six months after UVA‐1; and 1.0 one year after UVA‐1.
Secondary outcome 2: Improvement of disease damage
Not measured.
6. Low‐dose (20 J/cm²) UVA‐1 phototherapy versus no treatment
Participants: children and adults with active circumscribed morphea.
Primary outcome 1: Global improvement of disease activity or damage assessed by a medical practitioner or by participants
Not measured.
Primary outcome 2: Adverse effects of the interventions, including local and systemic reactions
Authors from the intra‐individual study comparing low‐dose (20 J/cm²) UVA‐1 versus no treatment in a plaque shielded from irradiation (14 participants) did not present separate adverse events data for lesions treated with medium‐dose (70 J/cm²) and low‐dose (20 J/cm²) UVA‐1 phototherapy (Sator 2009). Thus, we accounted the same adverse data when comparing the two active intervention groups with the control. All participants had tanning (RR 29.00, 95% CI 1.90 to 443.28; very low certainty evidence; Analysis 4.1). Two participants reported painless UVA‐1 erythema (RR 4.41, 95% CI 0.23 to 84.79; very low certainty evidence; Analysis 4.2); and two other participants reported pruritus during the first week of treatment (RR 4.41, 95% CI 0.23 to 84.79; very low certainty evidence; Analysis 4.3).
Secondary outcome 1: Improvement of disease activity
Sator 2009 reported a significantly bigger reduction of skin thickness (measured through 20 MHz ultrasound, where high values represent a worse outcome) of lesions treated with low‐dose (20 J/cm²) UVA‐1 than untreated lesions at the 6‐month follow‐up after treatment. However, authors reported median values without standard deviation and did not use the paired t‐test to compare groups. The lesions treated with low‐dose (20 J/cm²) UVA‐1 had a median skin thickness of 1.71 mm (1.44 to 2.14) at baseline, which reduced: −0.195 mm (−0.2 to −0.1) immediately after UVA‐1; −0.28 mm (−0.4 to −0.2) three months after UVA‐1; −0.30 mm (−0.4 to −0.2) six months after UVA‐1; and −0.385 mm (−0.5 to −0.2) one year after UVA‐1. The untreated lesions had a median skin thickness of 1.82 mm (1.49 to 2.38) at baseline, which reduced: −0.09 mm (−0.2 to −0.1) immediately after UVA‐1; −0.19 mm (−0.2 to −0.1) three months after UVA‐1; −0.21 mm (−0.3 to −0.1) six months after UVA‐1; and −0.225 mm (−0.7 to −0.1) one year after UVA‐1.
Sator 2009 reported that the lesions irradiated with medium‐dose (70 J/cm²) UVA‐1 phototherapy had a decreased median skin score (where high values represent a worse outcome) during the study period compared to the untreated lesions. However, authors reported median values without standard deviation and did not use the paired t‐test to compare groups. The lesions treated with low‐dose (20 J/cm²) UVA‐1 phototherapy had a median skin score of: 3.4 at baseline; 1.8 immediately after UVA‐1; 1.4 three months after UVA‐1; 1.2 six months after UVA‐1; and 1.0 one year after UVA‐1. The untreated lesions had a median skin score of: 3.4 at baseline; 3.2 immediately after UVA‐1; 3.1 three months after UVA‐1; 2.9 six months after UVA‐1; and 2.8 one year after UVA‐1.
Secondary outcome 2: Improvement of disease damage
Not measured.
7. 20 J/cm² versus 10 J/cm² UVA phototherapy
Participants: children and adults with circumscribed morphea, linear scleroderma or generalised morphea.
Primary outcome 1: Global improvement of disease activity or damage assessed by a medical practitioner or by participants
Not measured.
Primary outcome 2: Adverse effects of the interventions, including local and systemic reactions
All 47 participants treated with low‐dose (20 J/cm² or 10 J/cm²) UVA phototherapy had generalised tanning (RR 1.00, 95% CI 0.92 to 1.09; low‐certainty evidence; Analysis 5.1) (El‐Mofty 2004).
In addition, three participants from each group reported temporary pruritus (RR 0.81, 95% CI 0.18 to 3.60; low‐certainty evidence; Analysis 5.2), and one of 26 participants in the 20 J/cm² group had increased erythema and exacerbated pain (RR 2.44, 95% CI 0.10 to 57.08; very low certainty evidence; Analysis 5.3). However, the wide confidence intervals include the null effect and appreciable benefit.
Secondary outcome 1: Improvement of disease activity
The number of participants with very good and good clinical response (marked and moderate skin softening) after the seven‐week treatment was higher in the 20 J/cm² UVA phototherapy group than in the 10 J/cm² UVA group (RR 1.21, 95% CI 0.69 to 2.11; very low certainty evidence; Analysis 5.4) (El‐Mofty 2004). However, the wide confidence interval includes the null effect and appreciable harm.
Secondary outcome 2: Improvement of disease damage
Not measured.
8. 20 J/cm² versus 5 J/cm² UVA phototherapy
Participants: children and adults with circumscribed morphea, linear scleroderma or generalised morphea.
Primary outcome 1: Global improvement of disease activity or damage assessed by a medical practitioner or by participants
Not measured.
Primary outcome 2: Adverse effects of the interventions, including local and systemic reactions
All 42 participants treated with low‐dose (20 J/cm² or 5 J/cm²) UVA phototherapy had generalised tanning (RR 1.00, 95% CI 0.91 to 1.10; low‐certainty evidence; Analysis 6.1) (El‐Mofty 2004).
In addition, three participants from each group reported temporary pruritus (RR 0.62, 95% CI 0.14 to 2.69; low‐certainty evidence; Analysis 6.2); and one of 26 participants in the 20 J/cm² group had increased erythema and exacerbated pain (RR 1.89, 95% CI 0.08 to 43.75; very low certainty evidence; Analysis 6.3). However, the wide confidence intervals include the null effect and benefit.
Secondary outcome 1: Improvement of disease activity
The number of participants with very good and good clinical response (marked and moderate skin softening) after the seven‐week treatment was higher in the 20 J/cm² UVA phototherapy group than in the 5 J/cm² UVA group (RR 1.54, 95% CI 0.75 to 3.14; low‐certainty evidence; Analysis 6.4) (El‐Mofty 2004). However, the confidence interval includes the null effect and appreciable harm.
Secondary outcome 2: Improvement of disease damage
Not measured.
9. 10 J/cm² versus 5 J/cm² UVA phototherapy
Participants: children and adults with circumscribed morphea, linear scleroderma or generalised morphea.
Primary outcome 1: Global improvement of disease activity or damage assessed by a medical practitioner or by participants
Not measured.
Primary outcome 2: Adverse effects of the interventions, including local and systemic reactions
All 37 participants treated with low‐dose (10 J/cm² or 5 J/cm²) UVA phototherapy had generalised tanning (RR 1.00, 95% CI 0.90 to 1.11; low‐certainty evidence; Analysis 7.1) (El‐Mofty 2004). In addition, three participants from each group reported temporary pruritus (RR 0.76, 95% CI 0.18 to 3.29; low‐certainty evidence; Analysis 7.2).
Secondary outcome 1: Improvement of disease activity
The number of participants with very good and good clinical response (marked and moderate skin softening) after the seven‐week treatment was higher in the 10 J/cm² UVA phototherapy group than in the 5 J/cm² UVA group (RR 1.27, 95% CI 0.58 to 2.76; very low certainty evidence; Analysis 7.3) (El‐Mofty 2004). However, the confidence interval includes the null effect and appreciable harm.
Secondary outcome 2: Improvement of disease damage
Not measured.
10. Photodynamic therapy using ALA versus no treatment
Participants: individuals with circumscribed morphea.
Primary outcome 1: Global improvement of disease activity or damage assessed by a medical practitioner or by participants
Not measured.
Primary outcome 2: Adverse effects of the interventions, including local and systemic reactions
In the intra‐individual study comparing photodynamic therapy using ALA versus no treatment (Batchelor 2008), all participants had pigmentation in the lesions treated with photodynamic therapy and no pigmentation in the untreated lesions after the six‐week treatment (RR 13.00, 95% CI 0.89 to 189.38; very low certainty evidence; Analysis 8.1). Other adverse events reported during and after phototherapy included a burning sensation during the phototherapy treatment (RR 9.00, 95% CI 0.59 to 137.65; 4 participants; very low certainty evidence; Analysis 8.2), dryness in the treated lesion (RR 3.00, 95% CI 0.15 to 61.73; 1 participant; very low certainty evidence; Analysis 8.3), erythema in the treated lesion (RR 5.00, 95% CI 0.29 to 86.43; 2 participants; very low certainty evidence; Analysis 8.4), and pruritus in the treated lesion (RR 3.00, 95% CI 0.15 to 61.73; 1 participant; very low certainty evidence; Analysis 8.5). However, we are uncertain of these results due to the wide confidence intervals, which include the null effect.
Secondary outcome 1: Improvement of disease activity
Authors reported durometer score values only for treated lesions, excluding data from the control lesions (Batchelor 2008).
Regarding the skin score for thickness (where high values represent a worse outcome), 4 out of 6 treated lesions had improvement (reduction) at the 12‐week follow‐up, but also 4 out of 6 control lesions had improvement (RR 1.00, 95% CI 0.45 to 2.23; very low certainty evidence; Analysis 8.6) (Batchelor 2008).
Secondary outcome 2: Improvement of disease damage
Not measured.
11. Fractional CO₂ laser therapy versus low‐dose UVA‐1 phototherapy (30 J/cm²)
Participants: children and adults with circumscribed morphea or linear scleroderma (with trunk/limb variant and head variant).
Primary outcome 1: Global improvement of disease activity or damage assessed by a medical practitioner or by participants
Not measured.
Primary outcome 2: Adverse effects of the interventions, including local and systemic reactions
All participants reported mild to moderate pain during fractional CO₂ laser therapy (RR 35.00, 95% CI 2.27 to 538.86; low‐certainty evidence; Analysis 9.1), 10 participants reported marked pain (RR 21.00, 95% CI 1.33 to 332.06; low‐certainty evidence; Analysis 9.2), and eight participants reported pruritus in the first 24 hours after treatment (RR 17.00, 95% CI 1.06 to 273.00; low‐certainty evidence; Analysis 9.3) whilst no participant experienced these adverse events with low‐dose UVA‐1 (30 J/cm²) phototherapy (Shalaby 2016).
One lesion treated with fractional CO₂ laser had hyperpigmentation versus four lesions treated with LD UVA‐1 (RR 0.25, 95% CI 0.03 to 2.01; low‐certainty evidence; Analysis 9.4). One lesion treated with fractional CO₂ laser had persistent erythema (RR 3.00, 95% CI 0.13 to 68.84; very low certainty evidence; Analysis 9.5). However, the confidence intervals include the null effect and appreciable benefit and harm.
Secondary outcome 1: Improvement of disease activity
In the intra‐individual study Shalaby 2016, only nine of the 17 participants completed the 50 MHz ultrasound biomicroscopy. The skin thickness assessed through ultrasound biomicroscopy (where high values represent a worse outcome) at the 10‐week follow‐up was lower in the lesions treated with fractional CO₂ laser therapy than the lesions treated with low‐dose UVA‐1 (30 J/cm²) phototherapy (MD −0.15 mm, 95% CI −0.33 to 0.03; low‐certainty evidence; Analysis 9.6). However, the confidence interval includes the null effect and appreciable harm.
The clinical score (adapted LoSCAT: from 0 to 12; thickness, dermal atrophy, dyschromia, and erythema scored each from 0 to 3, maximum) at the 10‐week follow‐up was also lower in the lesions treated with fractional CO₂ laser therapy than the lesions treated with low‐dose UVA‐1 (30 J/cm²) phototherapy (MD −1.59, 95% CI −2.82 to −0.36; low certainty evidence; Analysis 9.7).
The participants' satisfaction score (from 0 to 3, satisfied, best possible cosmetic result) at the 10‐week follow‐up was higher with fractional CO₂ laser therapy than with low‐dose UVA‐1 (30 J/cm²) phototherapy (MD 1.12, 95% CI 0.80 to 1.44; low‐certainty evidence; Analysis 9.8).
The number of lesions that had good or very good improvement in the clinical score (between 40% and 59% decrease or more than 60% decrease from baseline) at the 10‐week follow‐up was higher in the lesions treated with fractional CO₂ laser therapy (16/17) than the lesions treated with low‐dose UVA‐1 (30 J/cm²) phototherapy (6/17), indicating more improvement of disease activity with fractional CO₂ laser therapy (RR 2.67, 95% CI 1.39 to 5.13; low‐certainty evidence; Analysis 9.9).
Secondary outcome 2: Improvement of disease damage
Not measured.
12. Oral calcitriol (0.75 μg increased to 1.25 μg/day) versus placebo
Participants: adults and children with circumscribed or generalised morphea.
Primary outcome 1: Global improvement of disease activity or damage assessed by a medical practitioner or by participants
Not measured.
Primary outcome 2: Adverse effects of the interventions, including local and systemic reactions
In the study comparing the 9‐month treatment with oral calcitriol versus placebo (Hulshof 2000), authors reported adverse events for participants with morphea and SSc together (20 participants with morphea and 7 withSSc included in the study): of the 13 participants treated with calcitriol, three had transient hypercalciuria, whilst no participant treated with placebo had this event (RR 7.50, 95% CI 0.42 to 132.58; very low certainty evidence; Analysis 14.1).
Secondary outcome 1: Improvement of disease activity
The skin score for thickness of the morphea lesions (from 0 to 66, maximum, rating 22 body regions from 0, normal to 3, hidebound skin) was higher in the oral calcitriol group than in the placebo group after the 9‐month treatment (MD 1.10, 95% CI −2.98 to 5.18; very low certainty evidence; Analysis 14.2) and at the 15‐month follow‐up (MD 3.70, 95% CI −1.49 to 8.89; very low certainty evidence; Analysis 14.3), indicating more disease activity in the oral calcitriol group (Hulshof 2000). However, the wide confidence intervals include the null effect and appreciable benefit.
Secondary outcome 2: Improvement of disease damage
Not measured.
13. Oral methotrexate (15 mg/m², maximum 20 mg a week) plus oral prednisone versus placebo plus oral prednisone
See summary of findings Table for the main comparison
Participants: children with active morphea (linear scleroderma, generalised morphea, or mixed morphea).
Primary outcome 1: Global improvement of disease activity or damage assessed by a medical practitioner or by participants
The juvenile study Zulian 2011 considered the presence of all three response criteria for a significant clinical response: skin score rate equal or less than 1, indicating decreased lesion extension; at least a 10% decrease in the percentage thermal change from baseline, indicating decreased lesion inflammation; and absence of new lesions. The participants treated with oral MTX plus oral prednisone had a higher significant clinical response (31/46) than the participants in the placebo plus oral prednisone group (7/24) after the treatment (RR 2.31, 95% CI 1.20 to 4.45, NNTB 3; low‐certainty evidence; Analysis 11.1).
Authors reported no differences between groups in the VAS of both the physician's global assessment of disease severity and the parents' global assessment of the participants' overall well‐being, but reported no numerical data for these outcomes (Zulian 2011).
Primary outcome 2: Adverse effects of the interventions, including local and systemic reactions
The number of participants with at least one adverse event was higher in the oral MTX plus oral prednisone group (26/46) than in the placebo plus oral prednisone group (11/24) during the 12‐month treatment (RR 1.23, 95% CI 0.75 to 2.04; low‐certainty evidence; Analysis 11.2) (Zulian 2011). However, the confidence interval includes the null effect and appreciable benefit.
Adverse events related to MTX treatment included alopecia (two participants), nausea (eight participants), headache (five participants), fatigue (two participants), and hepatotoxicity (three participants), whilst adverse events related to corticosteroid treatment included weight gain (more than 5% of body weight) and striae rubrae.
Secondary outcome 1: Improvement of disease activity
The participants treated with oral MTX plus oral prednisone had a lower skin score rate (SSR) than the control group (placebo plus oral prednisone) after the 12‐month treatment, indicating a greater reduction of lesion size in the MTX group (MD −0.31, 95% CI −0.35 to −0.27; low certainty evidence; Analysis 11.3) (Zulian 2011). The SSR was based on the ratio between lesion and body surface area at baseline and after the 12‐month treatment (SSR equal or < 1 indicates decreased lesion extension; SSR > 1 indicates an increased extension of the lesion).
The participants treated with oral MTX plus oral prednisone also had a lower percentage thermal change from baseline after the 12‐month treatment compared with the placebo plus oral prednisone group (MD −32.30, 95% CI −37.92 to −26.68; low‐certainty evidence; Analysis 11.4) (Zulian 2011). As a negative percentage thermal change value indicates improvement, and a positive indicates worsening, there was a greater reduction of lesion inflammation in the MTX plus oral prednisone group.
The MTX plus oral prednisone group had a lower number of participants with new morphea lesions after the 12‐month treatment: three out of 46 participants in the treated grouped versus four out of 24 in the control (RR 0.39, 95% CI 0.10 to 1.61, Analysis 11.5; very low certainty evidence; Zulian 2011). However, the confidence interval includes the null effect and appreciable harm.
Secondary outcome 2: Improvement of disease damage
Authors reported no differences between groups in the C‐HAQ disability index after the 12‐month treatment, but reported no numerical data for this outcome (Zulian 2011).
14. Oral hydroxychloroquine (200 mg twice a day) plus topical corticosteroid versus oral methotrexate (15 mg a week) plus topical corticosteroid
Participants: children and adults with active morphea (unclear type).
Primary outcome 1: Global improvement of disease activity or damage assessed by a medical practitioner or by participants
The modified skin score (MSS; from 0 to 42, where 0 = no affected skin, 42 = extreme involvement in all areas) evaluates skin thickness and pliability (from 0, normal skin, to 3, unable to pinch or move skin) plus involved area (from 0, no involvement, to 3 = more than 67% involvement) in seven body regions. The participants treated with HCQ plus topical corticosteroid had a higher MSS score than the participants treated with oral MTX plus topical corticosteroid (25 participants) after the 3‐month treatment (MD 0.50, 95% CI −1.93 to 2.93; low‐certainty evidence; Analysis 12.1) (Azimi 2013). However, the confidence interval includes the null effect and appreciable benefit.
Primary outcome 2: Adverse effects of the interventions, including local and systemic reactions
No participants treated with HCQ reported serious side effects after the 3‐month treatment, whilst three out of 12 participants had liver enzymes rise at least three times in the MTX group (RR 0.13, 95% CI 0.01 to 2.33; very low certainty evidence; Analysis 12.2) (Azimi 2013). However, the wide confidence interval includes the null effect and appreciable harm.
Secondary outcome 1: Improvement of disease activity
The participants treated with HCQ plus topical corticosteroid had a higher VAS of the participants’ estimate of skin tightness (from 0 to 10, maximum) on the morphea lesions than the participants treated with oral MTX plus topical corticosteroid after the 3‐month treatment (MD 0.30, 95% CI −0.49 to 1.09; very low certainty evidence; Analysis 12.3) (Azimi 2013). However, the wide confidence interval includes the null effect and appreciable benefit.
The HCQ plus topical corticosteroid group had a lower score in the VAS of the participants’ estimate of pruritus (from 0 to 10, maximum) on the morphea lesions (indicating less disease activity) after the 3‐month treatment compared to the MTX plus topical corticosteroid group (MD −2.30, 95% CI −3.25 to −1.35; low‐certainty evidence; Analysis 12.4).
Secondary outcome 2: Improvement of disease damage
Not measured.
15. Topical tacrolimus 0.1% versus placebo
Participants: adults with active circumscribed morphea.
Primary outcome 1: Global improvement of disease activity or damage assessed by a medical practitioner or by participants
Not measured.
Primary outcome 2: Adverse effects of the interventions, including local and systemic reactions
In the intra‐individual study comparing topical tacrolimus 0.1% versus placebo (10 participants), one participant reported pruritus on the plaque treated with tacrolimus (RR 3.00, 95% CI 0.14 to 65.90; very low certainty evidence; Analysis 13.1) (Kroft 2009a). However, the wide confidence interval includes the null effect and appreciable benefit. One participant also reported a mild headache.
Secondary outcome 1: Improvement of disease activity
The durometer score (from 0 to 1000, maximum, where high values represent a worse outcome) was higher in the lesions treated with tacrolimus 0.1% than in the lesions treated with placebo after the 12‐week treatment (MD 47.20, 95% CI −44.55 to 138.95; low‐certainty evidence; Analysis 13.2) (Kroft 2009a). However, the wide confidence interval includes the null effect and appreciable benefit.
The lesion size was slightly higher in the lesions treated with tacrolimus 0.1% than in the lesions treated with placebo after the 12‐week treatment (MD 0.50, 95% CI −38.35 to 39.35; very low certainty evidence; Analysis 13.3). However, the wide confidence interval includes the null effect and appreciable benefit.
The number of lesions that had a decrease in the modified DIET score (from 0 to 15, maximum; dyspigmentation, induration, erythema, telangiectasia and atrophy of the lesions scored from 0, none, to 3, severe) was higher with tacrolimus 0.1% (8/10) than with placebo (7/10) after the 12‐week treatment (RR 1.14, 95% CI 0.69 to 1.90; low‐certainty evidence; Analysis 13.4). However, the confidence interval includes the null effect and appreciable benefit.
Although the number of lesions that had a decrease was similar, the modified DIET score was lower in the lesions treated with tacrolimus 0.1% than in the lesions treated with placebo after the 12‐week treatment (MD −1.70, 95% CI −3.11 to −0.29; low‐certainty evidence; Analysis 13.5), indicating more improvement of disease activity with tacrolimus 0.1%.
Secondary outcome 2: Improvement of disease damage
Not measured.
16. Intralesional injections of interferon‐γ (100 µg) versus placebo
Participants: individuals with active circumscribed morphea.
Primary outcome 1: Global improvement of disease activity or damage assessed by a medical practitioner or by participants
Not measured.
Primary outcome 2: Adverse effects of the interventions, including local and systemic reactions
In the study comparing intralesional injections of interferon‐γ versus placebo (24 participants, 24‐week follow‐up; Hunzelmann 1997), three participants treated with IFN‐γ reported arthralgia, fatigue and dizziness, whilst one participant from the placebo group reported headache and temperature elevation. However, authors informed only the total number of participants without the number of participants in each intervention group.
Secondary outcome 1: Improvement of disease activity
Authors reported there were no changes in size of the lesions and skin score for thickness at the 24‐week follow‐up, but reported no numerical data. In addition, there were no differences between groups in the number of participants with new morphea lesions at the 24‐week follow‐up (1 participant in the interferon‐γ group and 7 participants in the control group), but authors did not present the number of participants in each intervention group.
Secondary outcome 2: Improvement of disease damage
Not measured.
17. Polymerised collagen intralesional injection versus methylprednisolone subcutaneous injection plus placebo intralesional injection
Participants: adults with circumscribed morphea or linear scleroderma.
Primary outcome 1: Global improvement of disease activity or damage assessed by a medical practitioner or by participants
Not measured.
Primary outcome 2: Adverse effects of the interventions, including local and systemic reactions
In the study evaluating the 3‐month treatment with polymerised collagen intralesional injection versus methylprednisolone subcutaneous injection plus placebo intralesional injection (9‐month follow‐up; Furuzawa‐Carballeda 2012), all 13 participants treated with polymerised collagen reported short‐duration (less than five minutes) pain at the injection site versus two out of 14 participants treated with methylprednisolone and placebo (RR 5.79, 95% CI 1.86 to 18.02; moderate‐certainty evidence; Analysis 10.1).
Participants treated with polymerised collagen reported no other adverse events, whilst seven out of 14 participants in the methylprednisolone group reported pruritus (RR 0.07, 95% CI 0.00 to 1.14; low‐certainty evidence; Analysis 10.2), and one of 14 developed sclerosis (RR 0.36, 95% CI 0.02 to 8.06; low‐certainty evidence; Analysis 10.3). However, the confidence intervals include the null effect and appreciable harm.
Secondary outcome 1: Improvement of disease activity
Furuzawa‐Carballeda 2012 used an adapted skin score (from 0, normal, to 4, extreme thickening) to assess skin thickness of the morphea lesions, which indicates disease activity. The group treated with polymerised collagen had a higher skin score compared to the methylprednisolone group after the 3‐month treatment (MD 1.30, 95% CI 0.31 to 2.29; moderate‐certainty evidence; Analysis 10.4). The skin score at the 9‐month follow‐up was also higher in the polymerised collagen group (MD 0.50, 95% CI −0.25 to 1.25; low‐certainty evidence; Analysis 10.5); however, the confidence interval includes the null effect and appreciable benefit.
The number of new morphea lesions at the 9‐month follow‐up was higher in the polymerised collagen group then in the methylprednisolone group (MD 0.20, 95% CI −0.16 to 0.56; low‐certainty evidence; Analysis 10.6). However, the confidence interval includes the null effect and appreciable benefit.
Secondary outcome 2: Improvement of disease damage
Not measured.
18. Tranilast plus topical betamethasone valerate 0.1% versus topical betamethasone valerate 0.1%
Participants: adults with circumscribed morphea, linear scleroderma or generalised morphea.
Primary outcome 1: Global improvement of disease activity or damage assessed by a medical practitioner or by participants
Not measured.
Primary outcome 2: Adverse effects of the interventions, including local and systemic reactions
Authors reported no adverse events after the 3‐month treatment (Noakes 2018; three participants).
Secondary outcome 1: Improvement of disease activity
The intra‐individual study Noakes 2018 adapted the LoScat score to compare individual lesions (11 pairs) of the three participants (from 0, minimum, to 18, maximum enlargement, erythema, skin thickness, dermal atrophy, subcutaneous atrophy and dyspigmentation ‒ each rated from 0 to 3). The lesions treated with tranilast plus topical betamethasone valerate 0.1% had a lower clinical score than the lesions treated with only topical betamethasone valerate 0.1% after the 3‐month treatment (MD −1.50, 95% CI −3.88 to 0.88; low‐certainty evidence; Analysis 15.1). However, the wide confidence interval includes the null effect and appreciable harm.
The lesions treated with tranilast plus topical betamethasone valerate 0.1% also had a lower Physician Global Assessment of Activity (from 0 = inactive, to 100 = markedly active) than the lesions treated with only topical betamethasone valerate 0.1% after the 3‐month treatment (MD −7.50, 95% CI −23.73 to 8.73; low‐certainty evidence; Analysis 15.2). However, the wide confidence interval includes the null effect and appreciable harm.
Noakes 2018 noted no disease progression in the lesions treated with tranilast plus topical betamethasone valerate 0.1% (0/8), whilst two of eight lesions treated with topical betamethasone valerate 0.1% had disease progression (RR 0.24, 95% CI 0.01 to 4.47; low‐certainty evidence; Analysis 15.3). However, the wide confidence interval includes the null effect and appreciable harm.
It is important to consider that the participants continued with their routine therapy, which included systemic medications.
Secondary outcome 2: Improvement of disease damage
The lesions treated with tranilast plus topical betamethasone valerate 0.1% also had a lower Physician Global Assessment of Damage (from 0 = no damage, to 100 = markedly damaged) than the lesions treated with only topical betamethasone valerate 0.1% after the 3‐month treatment (MD −6.00, 95% CI −24.90 to 12.90; low‐certainty evidence; Analysis 15.4). However, the wide confidence interval includes the null effect and appreciable harm.
19. Traditional Chinese Medicine herbal tea plus herbal oil and vitamin B6 versus phenoxymethylpenicillin plus DAC base cream
Participants: adults with circumscribed morphea or linear scleroderma.
Primary outcome 1: Global improvement of disease activity or damage assessed by a medical practitioner or by participants
Not measured.
Primary outcome 2: Adverse effects of the interventions, including local and systemic reactions
In the study comparing Traditional Chinese Medicine herbal tea plus herbal oil and vitamin B6 versus phenoxymethylpenicillin plus DAC base cream (Tang 2006), two out of 12 participants in the control group prematurely terminated the study due to adverse events (exanthema and Quincke edema), and two of 12 participants in the Traditional Chinese Medicine group had contact dermatitis (RR 1.00, 95% CI 0.17 to 5.98; very low certainty evidence; Analysis 16.1). However, the wide confidence interval includes the null effect and appreciable benefit.
Secondary outcome 1: Improvement of disease activity
Authors reported a significantly greater reduction of lesion size in the Traditional Chinese Medicine group compared to the control after the 12‐week treatment (70.9 cm² versus 126.1 cm²; P < 0.0001) and at the 24‐week follow‐up (52.5 cm² versus 126.2 cm²; P < 0.0001), but reported mean values without standard deviation (Tang 2006).
Authors also reported a significantly greater reduction of skin thickness (measured through 20 MHz ultrasound) in the Traditional Chinese Medicine group compared to the control after the 12‐week treatment (1.417 mm versus 1.785 mm; P < 0.0001) and at the 24‐week follow‐up (1.277 mm versus 1.862 mm; P < 0.0001), but reported mean values without standard deviation (Tang 2006).
Secondary outcome 2: Improvement of disease damage
Not measured.
20. Acupuncture, hot herbal compress and moxibustion plus Centella triterpenes and vitamin E versus heparin sodium cream plus Centella triterpenes and vitamin E
Participants: adults with morphea (unclear type).
Primary outcome 1: Global improvement of disease activity or damage assessed by a medical practitioner or by participants
In the study evaluating the 6‐month treatment with acupuncture, hot herbal compress and moxibustion plus Centella triterpenes tablets and vitamin E versus heparin sodium cream plus Centella triterpenes tablets and vitamin E (Yan 2013), 19 out of 22 participants treated with Traditional Chinese Medicine had a significant clinical response versus 10 out of 19 participants in the control group (RR 1.64, 95% CI 1.04 to 2.59, NNTB 3; low‐certainty evidence; Analysis 17.1). Authors based the clinical response on Traditional Chinese Medicine criteria and considered more than 30% improvement as a significant clinical response.
Primary outcome 2: Adverse effects of the interventions, including local and systemic reactions
One participant reported pain during acupuncture versus zero events in the control group (RR 2.61, 95% CI 0.11 to 60.51; very low certainty evidence; Analysis 17.2) (Yan 2013). However, the wide confidence interval includes the null effect and appreciable benefit.
Secondary outcome 1: Improvement of disease activity
The group treated with Traditional Chinese Medicine had a lower skin sclerosis score compared with the control group (MD −10.34, 95% CI −16.83 to −3.85; low‐certainty evidence; Analysis 17.3). Authors based the skin score on Steen criteria (from 0 to 90, maximum), which rates sclerosis of 30 body regions from 0, none, to 3, severe.
Secondary outcome 2: Improvement of disease damage
The group treated with Traditional Chinese Medicine also had a lower joint function score compared with the control group (MD −1.65, 95% CI −2.95 to −0.35; low‐certainty evidence; Analysis 17.4), and a lower joint pain score (MD −6.63, 95% CI −11.20 to −2.06; low certainty evidence; Analysis 17.5), indicating less disease impact in daily activities. Authors based the joint function score on Kahan criteria (from 0 to 66, maximum impact; assessing disease impact in 11 daily activities from 0, no difficulty, to 3, unable to perform) and the joint pain score on Traditional Chinese Medicine syndromes criteria (unclear total score).
Discussion
Summary of main results
Morphea is an immune‐mediated disease with multiple subtypes that have different clinical presentations, aetiology, prognosis and treatment. We aimed to assess the effectiveness and safety of treatments for morphea, and we found 14 RCTs.
Various interventions have been used to treat morphea, and the response to treatment is variable according to the subtype, extent, severity, and activity of the condition. The study participants had various subtypes of morphea, which limited our conclusions; and less than half of the studies included participants with a diagnosis of active morphea. Furthermore, only four studies evaluated our primary outcome ‘Global improvement of disease activity or damage assessed by a medical practitioner or by participants’, and few used validated outcome measurement tools for morphea.
All included studies addressed adverse effects of the interventions and evaluated the improvement of disease activity, although they used heterogeneous assessment tools. Only three studies assessed our secondary outcome ‘Improvement of disease damage’. The quality of the evidence in this review was mainly low, indicating potential uncertainty in the results.
Based on one study (70 participants), we found that the treatment of active morphea (linear scleroderma, generalised morphea, or mixed subtype: linear and circumscribed) in children and teenagers with oral MTX (given once per week for 12 months or until time of flare) plus oral prednisone (given once per day for three months plus one month with gradually decreased dose until discontinuation) may result in better global improvement of disease activity or damage when compared with placebo plus oral prednisone. Both groups also received a folic acid supplement. There may be little or no difference in the likelihood of experiencing at least one adverse event with oral MTX or placebo. Adverse events related to methotrexate included alopecia, nausea, headache, fatigue, and hepatotoxicity; whilst adverse events related to the corticosteroid (which was given in both groups) included weight gain (more than 5% of body weight) and striae rubrae. These results are based on low‐certainty evidence (summary of findings Table for the main comparison). As both groups received oral prednisone as an adjuvant therapy, it is unclear whether the initial corticosteroid treatment should be given in combination to MTX or if the treatment with MTX alone could have the same effectiveness.
Based on one three‐armed study in which 62 participants (children and adults) had active morphea (circumscribed morphea, linear scleroderma (with trunk/limb variant and head variant), generalised morphea, or mixed morphea, we found that the global improvement of disease activity or damage after treatment may be similar between low‐dose UVA‐1 (20 J/cm²), medium‐dose UVA‐1 (50 J/cm²), and narrowband UVB phototherapy given five times a week, for eight weeks. Treatment with UVA‐1 phototherapy may cause mild tanning compared to narrowband UVB phototherapy, but there may be no difference in mild tanning when comparing medium‐ and low‐dose UVA‐1 phototherapy. Transient erythema was reported in three participants with narrowband UVB and none of the participants in either the low‐ or medium‐dose UVA‐1 groups. These results are based on low‐certainty evidence (summary of findings Table 2; summary of findings Table 3; summary of findings Table 4).
Overall completeness and applicability of evidence
Our included studies were not sufficient to address all of the objectives of the review: to assess the effects of treatments for people with any form of morphea. Their relevance was limited by the diversity of both the morphea subtypes and included participants; the lack of distinction regarding the stage of the condition (active or inactive); and heterogeneous and non‐validated tools of assessment.
Participants
Six studies included both children and adults, but did not report separate data for each age group; thus the number of children included in this review is unclear. Most studies investigated more than one type of morphea, but reported data for all subtypes combined. Some trials did not report the participants' type of morphea at all. Therefore, it was not possible to analyse the treatment response differences between subtypes and between children and adults, and so we are not able to generalise this result for all age groups and morphea types.
The different forms of morphea included in this review can be very different from each other in terms of age, possible causes, propensity to underlying sclerosis and hence treatment aims and need for systemic therapy. Most participants had circumscribed morphea (n = 197), followed by linear scleroderma (n = 77; 6 with head variant), generalised morphea (n = 46), and mixed morphea (n = 9). However, the exact number of participants with each type of morphea is also unclear, as two studies did not report this information, and one study included participants with circumscribed and generalised morphea, without disclosing the number of participants for each type.
Furthermore, most studies did not consider the active inflammatory stage versus inactive sclerotic or atrophic phase of morphea, which is a key concept directly related to response to treatment (treatments in the active stage of the disease have better chances of improvement). Less than half of the included studies investigated participants with a diagnosis of active morphea. Most studies which reported the length of the disease evolution investigated participants with up to 10 years of morphea diagnosis.
Interventions
An aspect to consider is the necessity or not of initial corticosteroid therapy combination (e.g. oral MTX plus oral prednisone). Although both groups used the same corticosteroid dosage, the group treated with MTX had a greater improvement, but we cannot exclude a synergic effect between these medications in the improvement of morphea lesions. It is unclear whether the initial corticosteroid therapy may induce a faster treatment response compared with MTX alone or not. Given the prevalence of morphea in children and the adverse effects of systemic corticosteroid therapy during the growth phase, it is important to explore steroid sparing agents. Topical corticosteroid therapy is also linked to adverse effects such as atrophy.
The treatment of active morphea (unclear type) with HCQ plus topical corticosteroid may occasionally be indicated for severe cases with contraindications to MTX or failure to standard therapy. We also cannot exclude the effect of the topical corticosteroid combined with HCQ or MTX, especially considering that the follow‐up period of this study was short (three months).
Outcomes
Only four studies evaluated our primary outcome ‘Global improvement of disease activity or damage assessed by a medical practitioner or by participants’, although all included studies addressed adverse effects of the interventions. Only three studies assessed our secondary outcome ‘Improvement of disease damage’, but all included studies evaluated the improvement of disease activity. However, most studies used non‐validated, as well as heterogeneous, tools of assessment, which hindered the evaluation of the effectiveness of treatments.
It is, furthermore, important to note that the assessment tool in most studies was inappropriate, such as scores developed and validated for SSc or scores adapted to assess individual lesions. Clinical tools developed and validated for SSc are inappropriate to assess skin involvement in morphea, which is a different disease with distinct clinical characteristics. It is essential to use a specific validated tool for morphea to assess outcome measure. Selecting lesions rather than globally assessing individuals and comparing two interventions in the same individual (intra‐individual control) also limited the evaluation of the effectiveness of treatments.
Most outcome measures of the included studies were considered as indicators of disease activity (secondary outcome), as the assessments were made mostly on individual lesions. Most studies used adapted clinical scores to assess skin lesions individually rather than globally evaluate the participants. Only two studies included the LoSCAT in the outcome measures; however, they had intra‐individual design and adapted the tool to assess individual lesions.
In addition, the follow‐up duration was generally short (less than six months) for a chronic disease with high recurrence rates. A long‐term assessment is required; however, the ideal period depends on the subtype of morphea, type of therapy and the expected result.
Quality of the evidence
We found several methodological problems in the included studies. These included a small number of randomised participants (inadequate statistical power), short‐term follow up, lack of validated tools, and some studies did not have a placebo control group. In addition, some studies adapted available tools of global evaluation to assess individual lesions, but the global assessment of the disease is more clinically relevant.
We downgraded all outcomes in the GRADE assessment by one level due to study limitations (risk of bias). Reasons included unclear risk of selection bias (allocation concealment), and high risk of performance bias (blinding of participants and personnel), detection bias (blinding of outcome assessment), attrition bias (incomplete outcome data) and reporting bias (selective reporting). Allocation should be concealed and the concealment method should be reported. Studies ideally include a placebo or a sham intervention control group to effectively blind participants, personnel and outcome assessors, and avoid performance and detection bias. However, the nature of some interventions, such as phototherapy for example, may compromise blinding because of the tanning associated with the treatment. Studies should also analyse data from all randomised participants, regardless of study completion (ITT analysis). We also downgraded all outcomes by at least one level due to imprecision. All studies had a small number of participants, and most results had small numbers of events and wide confidence intervals, including both null effect and appreciable benefit and harm. Overall, we judged the evidence to be of low certainty, except for one judgement which we considered to be very low quality (summary of findings Table 4).
Potential biases in the review process
Our inclusion of intra‐individual studies could be questioned, as interventions applied in a specific lesion (injected medications or phototherapy, for example) could have systemic effects and reverberate in other lesions, altering the final result. However, considering that morphea is a rare diverse condition treated with different medications, and there are few randomised controlled trials of therapeutic agents, it was necessary to assess all available evidence (from RCTs) on the treatment of morphea.
Regarding the implementation of protocol methods we decided to add cross‐over trials, as their analysis is similar to within‐participants trials, which were already included in the criteria for considering studies for the review. We included only the first part of the cross‐over trials to avoid any carry‐over effects from insufficient washout periods. However, we do not consider this departure from protocol a potential source of bias, and there were no cross‐over studies in our search results. Furthermore, we did not make any decisions about the analysis after seeing the data, as we had anticipated that the unit of analysis could be the individual participant, the morphea lesion, or body region.
Limitations of the search process include the lack of access of grey literature sources, and the incomplete correspondence with study investigators. We could not obtain all relevant data because some authors reported data inadequately. In an effort to address reporting bias, we contacted the first author of the primary study to obtain missing data. Although some authors responded to our e‐mail contact not all could provide us with the missing data.
Agreements and disagreements with other studies or reviews
There are some narrative reviews of interventions for morphea reporting different types of studies (Careta 2015; Fett 2012; Tratenberg 2017), and one systematic review of interventions for morphea (Zwischenberger 2011); however, these reviews include, besides RCTs, prospective uncontrolled trials, retrospective studies, and case series. Contrary to these reviews, we included only RCTs, because other types of studies, such as uncontrolled and retrospective trials, for example, would be inappropriate to evaluate the effectiveness of interventions.
We followed a rigorous methodology, performing assessment of risk of bias and certainty of evidence. Our search methods retrieved more studies than the other systematic review, as we included more databases and trial registers, and used a wider search strategy: we found 339 records and included 14 RCTs that met our eligibility criteria, compared to 66 reports found by Zwischenberger 2011, of which 47 fulfilled their criteria for inclusion (5 RCTs).
In concordance with our findings, Careta 2015, Fett 2012, Tratenberg 2017 and Zwischenberger 2011 found that methotrexate in combination with a short course of oral prednisone may be an effective therapy for treating active juvenile morphea (linear, generalised or mixed). Careta 2015 reported that the treatment of severe types of morphea with corticosteroids and MTX was similar compared to the treatment with MTX alone, but this conclusion was based on the results of non‐randomised and uncontrolled studies. Our findings regarding the lack of studies investigating the effectiveness of the treatment with MTX combined with steroids versus MTX alone are in accordance with the results of Fett 2012 and Zwischenberger 2011.
Our results concerning efficacy and safety of phototherapy correspond closely with Careta 2015, Fett 2012, Tratenberg 2017 and Zwischenberger 2011. Although phototherapy may be effective for treatment of widespread and progressive superficial forms of morphea, these reviews agree that there is no evidence of more effectiveness with one type of phototherapy over another, and that more studies are necessary to establish optimum dose and regimen.
With regard to the outcome measures, our findings are in accordance with Zwischenberger 2011: outcome measures across studies are often inconsistent and not fully validated, and there is little data on the improvement of disease damage. In concordance with our results, Zwischenberger 2011 noted that few studies differentiated active and inactive stages of the disease, and few trials reported response to treatment according to population (juvenile and adult) and morphea subtypes.

A ‐ Confluent sclero‐atrophic lesions, with hypochromic, achromic and brownish areas on the thighs, generalised morphea; B ‐ sclero‐atrophic oval lesion with dyschromic areas and halo erythematosus in its right and inferior portion, active circumscribed morphea; C ‐ brown macula with discretely erythematous areas and irregular borders, circumscribed morphea in involution. Copyright © 2019 Monica RA Vasconcellos: reproduced with permission.

Linear scleroderma. A ‐ Sclero‐atrophic lesion involving the back of the hand and fingers, with deviation in the fourth and fifth chirodactyls; B – Streak of atrophy in the tongue (left) and dental implant defect (right); C – segmental sclero‐atrophic lesions in the trunk and limbs interspersed by hyper pigmented maculae. Copyright © 2019 Monica RA Vasconcellos: reproduced with permission.

Study flow diagram.
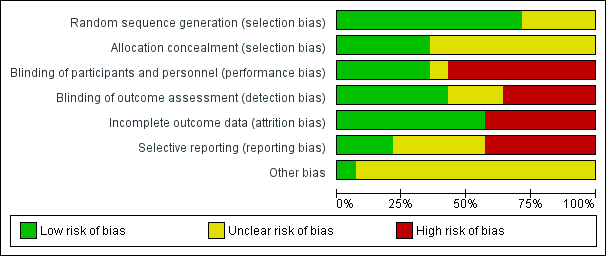
Risk of bias graph: review authors' judgements about each 'Risk of bias' item represented as percentages across all included studies.

Risk of bias summary: review authors' judgements about each 'Risk of bias' item for each included study.

Comparison 1 Medium‐dose UVA‐1 (50 J/cm²) x Low‐dose UVA‐1 (20 J/cm²) phototherapy, Outcome 1 Modified Skin Score (MSS) at the end of the eight‐week treatment.

Comparison 1 Medium‐dose UVA‐1 (50 J/cm²) x Low‐dose UVA‐1 (20 J/cm²) phototherapy, Outcome 2 Modified Skin Score (MSS) at last follow‐up visit (week 20).

Comparison 1 Medium‐dose UVA‐1 (50 J/cm²) x Low‐dose UVA‐1 (20 J/cm²) phototherapy, Outcome 3 Number of participants with mild tanning.
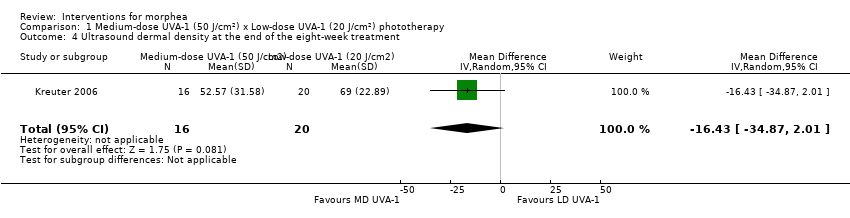
Comparison 1 Medium‐dose UVA‐1 (50 J/cm²) x Low‐dose UVA‐1 (20 J/cm²) phototherapy, Outcome 4 Ultrasound dermal density at the end of the eight‐week treatment.
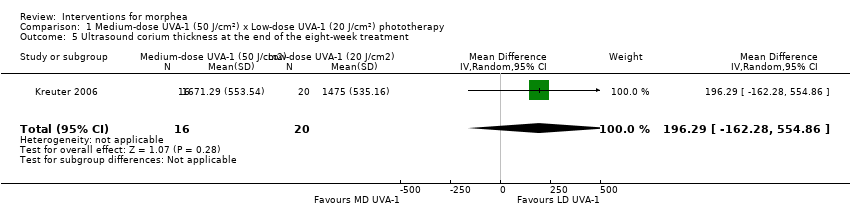
Comparison 1 Medium‐dose UVA‐1 (50 J/cm²) x Low‐dose UVA‐1 (20 J/cm²) phototherapy, Outcome 5 Ultrasound corium thickness at the end of the eight‐week treatment.

Comparison 2 Narrowband UVB x Medium‐dose UVA‐1 (50 J/cm²) phototherapy, Outcome 1 Modified Skin Score (MSS) at the end of the eight‐week treatment.
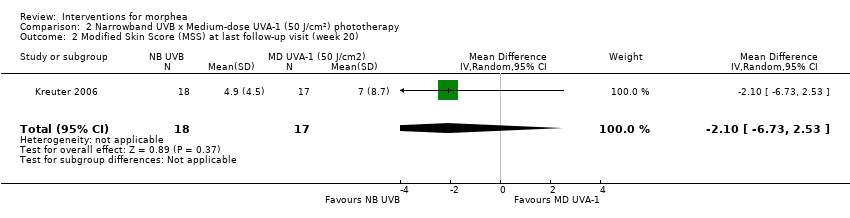
Comparison 2 Narrowband UVB x Medium‐dose UVA‐1 (50 J/cm²) phototherapy, Outcome 2 Modified Skin Score (MSS) at last follow‐up visit (week 20).
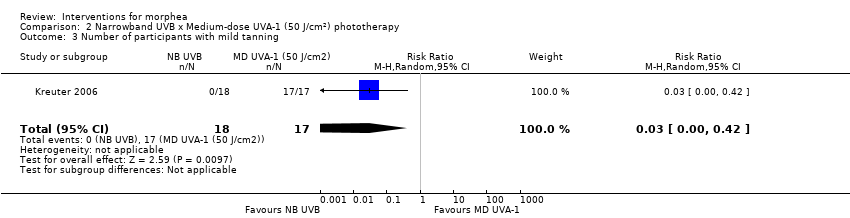
Comparison 2 Narrowband UVB x Medium‐dose UVA‐1 (50 J/cm²) phototherapy, Outcome 3 Number of participants with mild tanning.

Comparison 2 Narrowband UVB x Medium‐dose UVA‐1 (50 J/cm²) phototherapy, Outcome 4 Number of participants with transient erythema.

Comparison 2 Narrowband UVB x Medium‐dose UVA‐1 (50 J/cm²) phototherapy, Outcome 5 Ultrasound dermal density at the end of the eight‐week treatment.

Comparison 2 Narrowband UVB x Medium‐dose UVA‐1 (50 J/cm²) phototherapy, Outcome 6 Ultrasound corium thickness at the end of the eight‐week treatment.
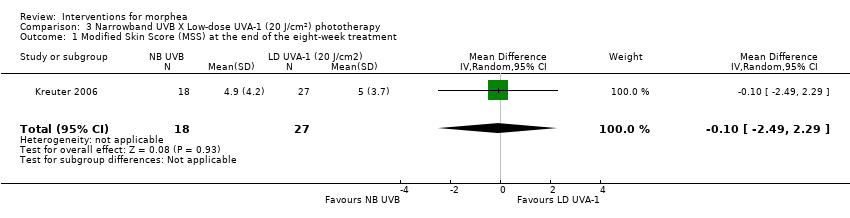
Comparison 3 Narrowband UVB X Low‐dose UVA‐1 (20 J/cm²) phototherapy, Outcome 1 Modified Skin Score (MSS) at the end of the eight‐week treatment.

Comparison 3 Narrowband UVB X Low‐dose UVA‐1 (20 J/cm²) phototherapy, Outcome 2 Modified Skin Score (MSS) at last follow‐up visit (week 20).

Comparison 3 Narrowband UVB X Low‐dose UVA‐1 (20 J/cm²) phototherapy, Outcome 3 Number of participants with mild tanning.

Comparison 3 Narrowband UVB X Low‐dose UVA‐1 (20 J/cm²) phototherapy, Outcome 4 Number of participants with transient erythema.

Comparison 3 Narrowband UVB X Low‐dose UVA‐1 (20 J/cm²) phototherapy, Outcome 5 Ultrasound dermal density at the end of the eight‐week treatment.

Comparison 3 Narrowband UVB X Low‐dose UVA‐1 (20 J/cm²) phototherapy, Outcome 6 Ultrasound corium thickness at the end of the eight‐week treatment.

Comparison 4 Medium‐dose (70 J/cm²) or Low‐dose (20 J/cm²) UVA‐1 phototherapy x No treatment, Outcome 1 Number of plaques with moderate to significant tanning.
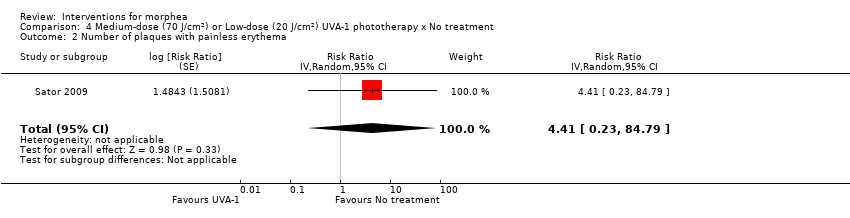
Comparison 4 Medium‐dose (70 J/cm²) or Low‐dose (20 J/cm²) UVA‐1 phototherapy x No treatment, Outcome 2 Number of plaques with painless erythema.

Comparison 4 Medium‐dose (70 J/cm²) or Low‐dose (20 J/cm²) UVA‐1 phototherapy x No treatment, Outcome 3 Number of plaques with pruritus.

Comparison 5 20 J/cm2 UVA x 10 J/cm² UVA phototherapy, Outcome 1 Number of participants with generalised tanning.

Comparison 5 20 J/cm2 UVA x 10 J/cm² UVA phototherapy, Outcome 2 Number of participants with temporary pruritus.
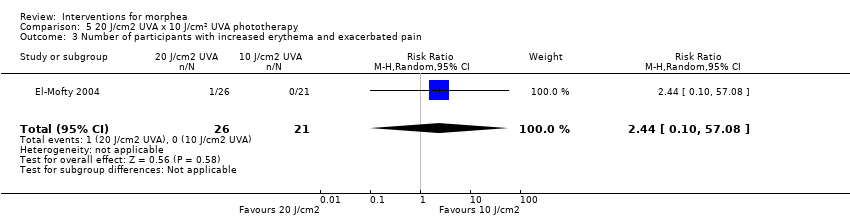
Comparison 5 20 J/cm2 UVA x 10 J/cm² UVA phototherapy, Outcome 3 Number of participants with increased erythema and exacerbated pain.

Comparison 5 20 J/cm2 UVA x 10 J/cm² UVA phototherapy, Outcome 4 Number of participants with skin softening at the end of the seven‐week treatment.
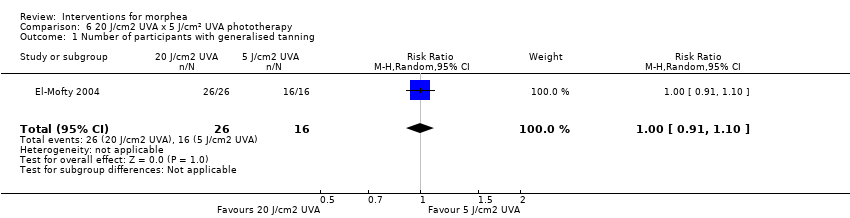
Comparison 6 20 J/cm2 UVA x 5 J/cm² UVA phototherapy, Outcome 1 Number of participants with generalised tanning.

Comparison 6 20 J/cm2 UVA x 5 J/cm² UVA phototherapy, Outcome 2 Number of participants with temporary pruritus.

Comparison 6 20 J/cm2 UVA x 5 J/cm² UVA phototherapy, Outcome 3 Number of participants with increased erythema and exacerbated pain.
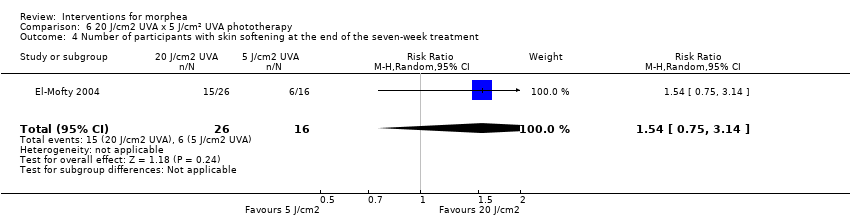
Comparison 6 20 J/cm2 UVA x 5 J/cm² UVA phototherapy, Outcome 4 Number of participants with skin softening at the end of the seven‐week treatment.

Comparison 7 10 J/cm2 UVA x 5 J/cm² UVA phototherapy, Outcome 1 Number of participants with generalised tanning.

Comparison 7 10 J/cm2 UVA x 5 J/cm² UVA phototherapy, Outcome 2 Number of participants with temporary pruritus.
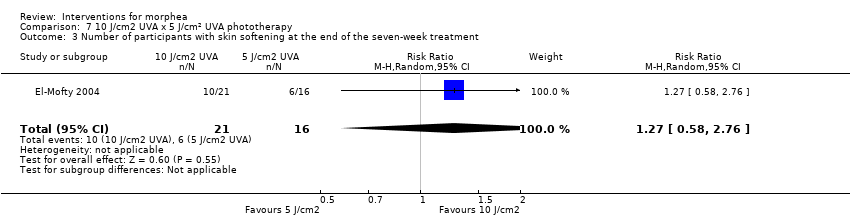
Comparison 7 10 J/cm2 UVA x 5 J/cm² UVA phototherapy, Outcome 3 Number of participants with skin softening at the end of the seven‐week treatment.

Comparison 8 Photodynamic therapy × No Treatment, Outcome 1 Number of plaques with pigmentation.
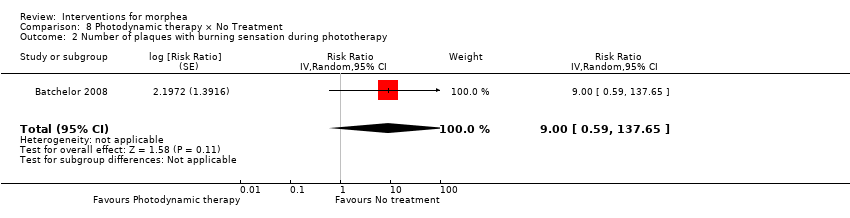
Comparison 8 Photodynamic therapy × No Treatment, Outcome 2 Number of plaques with burning sensation during phototherapy.

Comparison 8 Photodynamic therapy × No Treatment, Outcome 3 Number of plaques with dryness.

Comparison 8 Photodynamic therapy × No Treatment, Outcome 4 Number of plaques with erythema.

Comparison 8 Photodynamic therapy × No Treatment, Outcome 5 Number of plaques with pruritus.
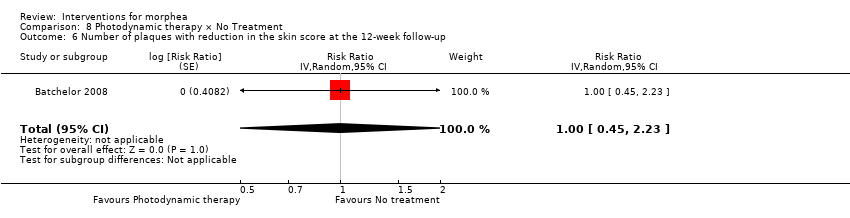
Comparison 8 Photodynamic therapy × No Treatment, Outcome 6 Number of plaques with reduction in the skin score at the 12‐week follow‐up.

Comparison 9 Fractional carbon dioxide laser × Low‐dose UVA‐1 (30 J/cm²) phototherapy, Outcome 1 Number of lesions with mild to moderate pain during therapy.

Comparison 9 Fractional carbon dioxide laser × Low‐dose UVA‐1 (30 J/cm²) phototherapy, Outcome 2 Number of lesions with marked pain during therapy.
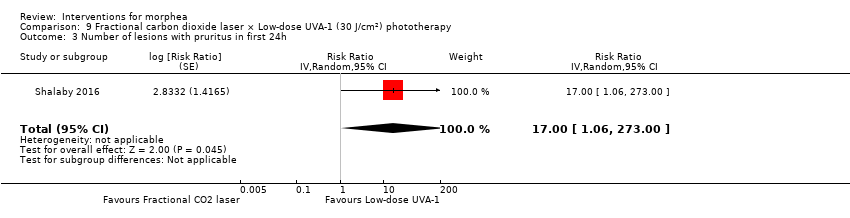
Comparison 9 Fractional carbon dioxide laser × Low‐dose UVA‐1 (30 J/cm²) phototherapy, Outcome 3 Number of lesions with pruritus in first 24h.
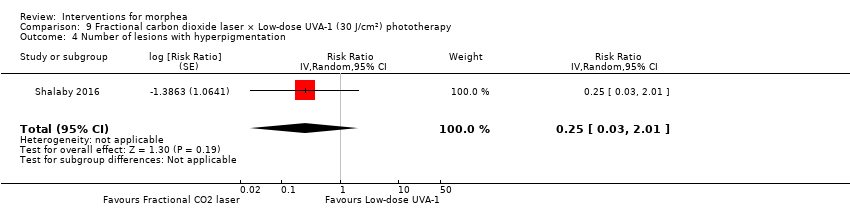
Comparison 9 Fractional carbon dioxide laser × Low‐dose UVA‐1 (30 J/cm²) phototherapy, Outcome 4 Number of lesions with hyperpigmentation.
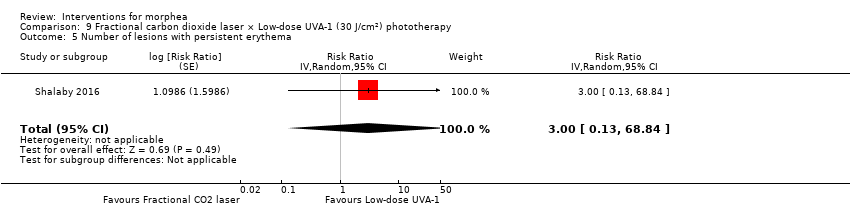
Comparison 9 Fractional carbon dioxide laser × Low‐dose UVA‐1 (30 J/cm²) phototherapy, Outcome 5 Number of lesions with persistent erythema.
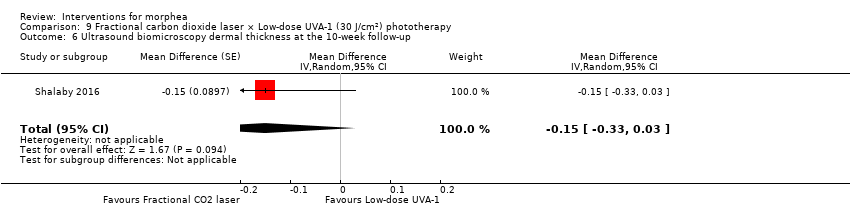
Comparison 9 Fractional carbon dioxide laser × Low‐dose UVA‐1 (30 J/cm²) phototherapy, Outcome 6 Ultrasound biomicroscopy dermal thickness at the 10‐week follow‐up.

Comparison 9 Fractional carbon dioxide laser × Low‐dose UVA‐1 (30 J/cm²) phototherapy, Outcome 7 Clinical score at the 10‐week follow‐up.
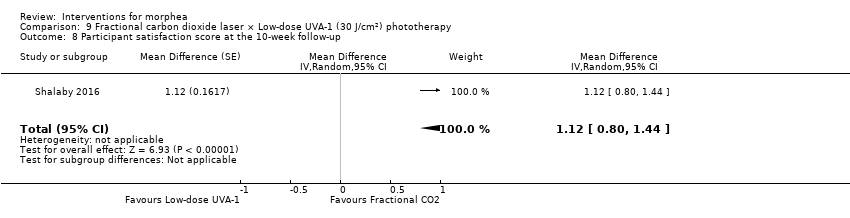
Comparison 9 Fractional carbon dioxide laser × Low‐dose UVA‐1 (30 J/cm²) phototherapy, Outcome 8 Participant satisfaction score at the 10‐week follow‐up.

Comparison 9 Fractional carbon dioxide laser × Low‐dose UVA‐1 (30 J/cm²) phototherapy, Outcome 9 Number of lesions with good or very good improvement in the clinical score at the 10‐week follow‐up.
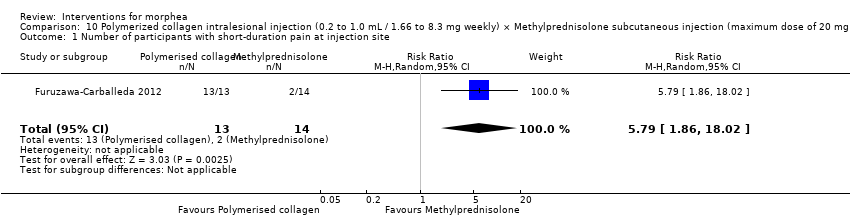
Comparison 10 Polymerized collagen intralesional injection (0.2 to 1.0 mL / 1.66 to 8.3 mg weekly) × Methylprednisolone subcutaneous injection (maximum dose of 20 mg or 5.0 mL monthly) plus placebo intralesional injection, Outcome 1 Number of participants with short‐duration pain at injection site.
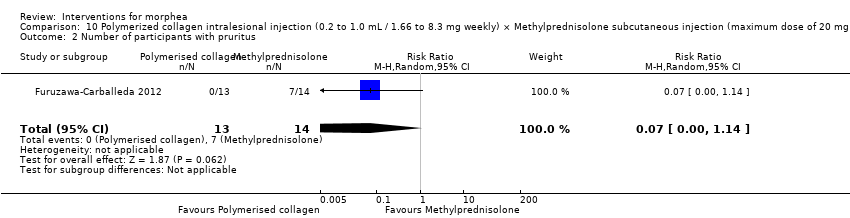
Comparison 10 Polymerized collagen intralesional injection (0.2 to 1.0 mL / 1.66 to 8.3 mg weekly) × Methylprednisolone subcutaneous injection (maximum dose of 20 mg or 5.0 mL monthly) plus placebo intralesional injection, Outcome 2 Number of participants with pruritus.

Comparison 10 Polymerized collagen intralesional injection (0.2 to 1.0 mL / 1.66 to 8.3 mg weekly) × Methylprednisolone subcutaneous injection (maximum dose of 20 mg or 5.0 mL monthly) plus placebo intralesional injection, Outcome 3 Number of participants with sclerosis.

Comparison 10 Polymerized collagen intralesional injection (0.2 to 1.0 mL / 1.66 to 8.3 mg weekly) × Methylprednisolone subcutaneous injection (maximum dose of 20 mg or 5.0 mL monthly) plus placebo intralesional injection, Outcome 4 Skin score at the end of the three‐month treatment.
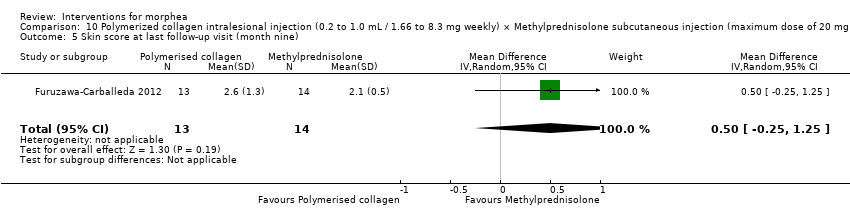
Comparison 10 Polymerized collagen intralesional injection (0.2 to 1.0 mL / 1.66 to 8.3 mg weekly) × Methylprednisolone subcutaneous injection (maximum dose of 20 mg or 5.0 mL monthly) plus placebo intralesional injection, Outcome 5 Skin score at last follow‐up visit (month nine).

Comparison 10 Polymerized collagen intralesional injection (0.2 to 1.0 mL / 1.66 to 8.3 mg weekly) × Methylprednisolone subcutaneous injection (maximum dose of 20 mg or 5.0 mL monthly) plus placebo intralesional injection, Outcome 6 Number of morphea lesions at the end of the three‐month treatment.

Comparison 11 Oral methotrexate (15 mg/m², maximum 20 mg a week) plus oral prednisone × Placebo plus oral prednisone, Outcome 1 Clinical response at the end of the 12‐month treatment.
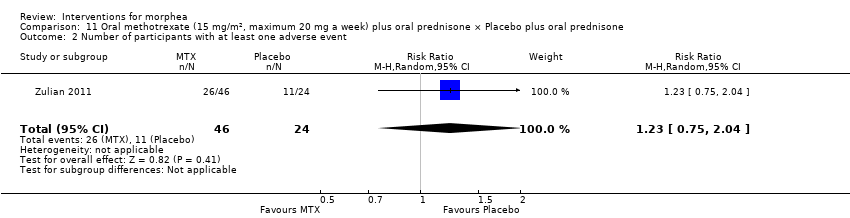
Comparison 11 Oral methotrexate (15 mg/m², maximum 20 mg a week) plus oral prednisone × Placebo plus oral prednisone, Outcome 2 Number of participants with at least one adverse event.

Comparison 11 Oral methotrexate (15 mg/m², maximum 20 mg a week) plus oral prednisone × Placebo plus oral prednisone, Outcome 3 Skin Score Rate (SSR) at the end of the 12‐month treatment.
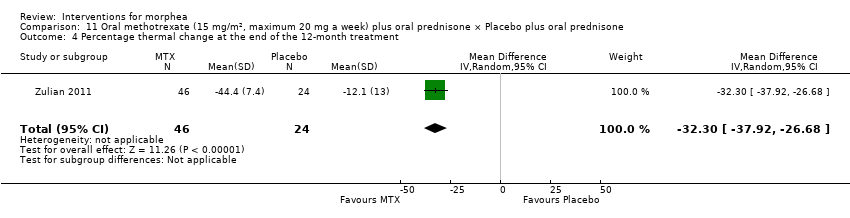
Comparison 11 Oral methotrexate (15 mg/m², maximum 20 mg a week) plus oral prednisone × Placebo plus oral prednisone, Outcome 4 Percentage thermal change at the end of the 12‐month treatment.

Comparison 11 Oral methotrexate (15 mg/m², maximum 20 mg a week) plus oral prednisone × Placebo plus oral prednisone, Outcome 5 Number of participants with new lesions at the end of the 12‐month treatment.
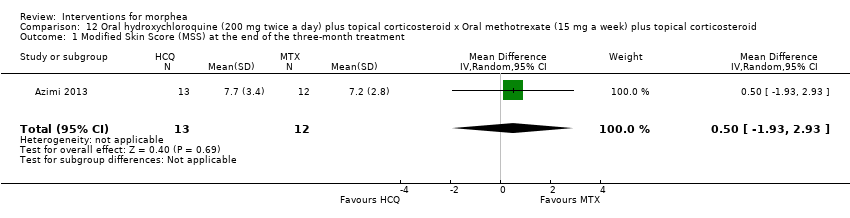
Comparison 12 Oral hydroxychloroquine (200 mg twice a day) plus topical corticosteroid x Oral methotrexate (15 mg a week) plus topical corticosteroid, Outcome 1 Modified Skin Score (MSS) at the end of the three‐month treatment.

Comparison 12 Oral hydroxychloroquine (200 mg twice a day) plus topical corticosteroid x Oral methotrexate (15 mg a week) plus topical corticosteroid, Outcome 2 Number of participants with liver enzymes rise more than three times during the three‐month treatment.

Comparison 12 Oral hydroxychloroquine (200 mg twice a day) plus topical corticosteroid x Oral methotrexate (15 mg a week) plus topical corticosteroid, Outcome 3 VAS for participants' estimate of skin tightness at the end of the three‐month treatment.

Comparison 12 Oral hydroxychloroquine (200 mg twice a day) plus topical corticosteroid x Oral methotrexate (15 mg a week) plus topical corticosteroid, Outcome 4 VAS for participants' estimate of pruritus at the end of the three‐month treatment.
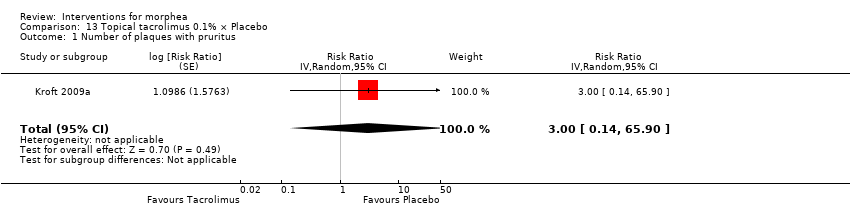
Comparison 13 Topical tacrolimus 0.1% × Placebo, Outcome 1 Number of plaques with pruritus.

Comparison 13 Topical tacrolimus 0.1% × Placebo, Outcome 2 Durometer score at the end of the 12‐week treatment.

Comparison 13 Topical tacrolimus 0.1% × Placebo, Outcome 3 Plaque surface area at the end of the 12‐week treatment.

Comparison 13 Topical tacrolimus 0.1% × Placebo, Outcome 4 Number of plaques with a reduced modified DIET score at the end of the 12‐week treatment.

Comparison 13 Topical tacrolimus 0.1% × Placebo, Outcome 5 Modified DIET score at the end of the 12‐week treatment.
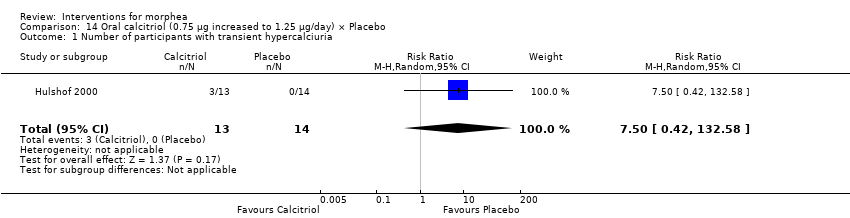
Comparison 14 Oral calcitriol (0.75 μg increased to 1.25 μg/day) × Placebo, Outcome 1 Number of participants with transient hypercalciuria.

Comparison 14 Oral calcitriol (0.75 μg increased to 1.25 μg/day) × Placebo, Outcome 2 Skin score at the end of the 9‐month treatment.
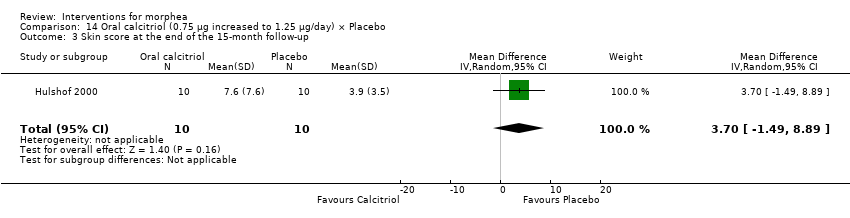
Comparison 14 Oral calcitriol (0.75 μg increased to 1.25 μg/day) × Placebo, Outcome 3 Skin score at the end of the 15‐month follow‐up.

Comparison 15 Tranilast plus topical betamethasone valerate 0.1% versus topical betamethasone valerate 0.1%, Outcome 1 Clinical score at the end of the three‐month treatment.
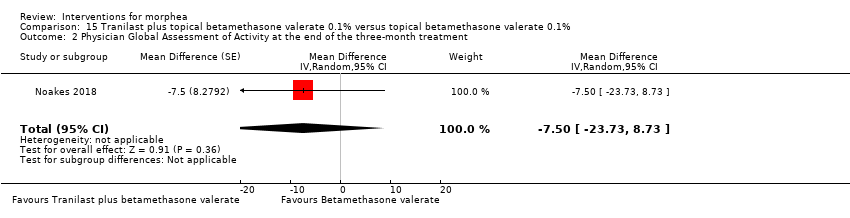
Comparison 15 Tranilast plus topical betamethasone valerate 0.1% versus topical betamethasone valerate 0.1%, Outcome 2 Physician Global Assessment of Activity at the end of the three‐month treatment.

Comparison 15 Tranilast plus topical betamethasone valerate 0.1% versus topical betamethasone valerate 0.1%, Outcome 3 Number of lesions with disease progression at the end of the three‐month treatment.
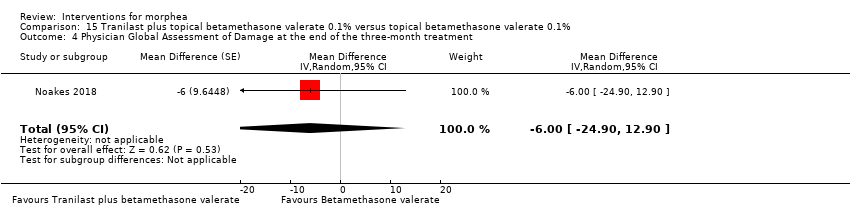
Comparison 15 Tranilast plus topical betamethasone valerate 0.1% versus topical betamethasone valerate 0.1%, Outcome 4 Physician Global Assessment of Damage at the end of the three‐month treatment.

Comparison 16 Traditional Chinese Medicine herbal tea plus herbal oil and vitamin B6 x Phenoxymethylpenicillin plus DAC base cream, Outcome 1 Number of participants with adverse events.
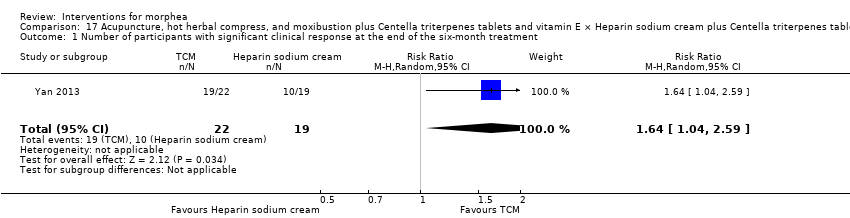
Comparison 17 Acupuncture, hot herbal compress, and moxibustion plus Centella triterpenes tablets and vitamin E × Heparin sodium cream plus Centella triterpenes tablets and vitamin E, Outcome 1 Number of participants with significant clinical response at the end of the six‐month treatment.
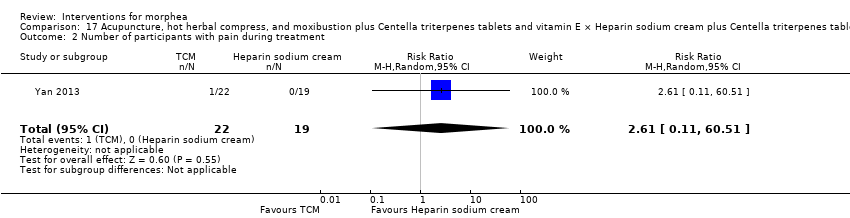
Comparison 17 Acupuncture, hot herbal compress, and moxibustion plus Centella triterpenes tablets and vitamin E × Heparin sodium cream plus Centella triterpenes tablets and vitamin E, Outcome 2 Number of participants with pain during treatment.
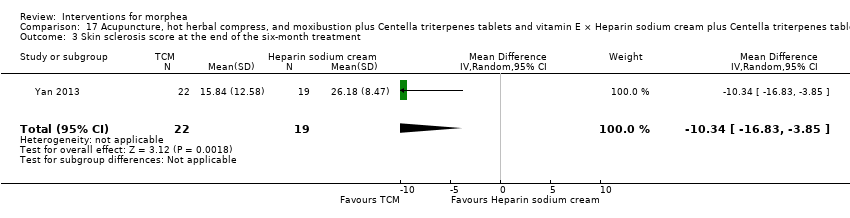
Comparison 17 Acupuncture, hot herbal compress, and moxibustion plus Centella triterpenes tablets and vitamin E × Heparin sodium cream plus Centella triterpenes tablets and vitamin E, Outcome 3 Skin sclerosis score at the end of the six‐month treatment.

Comparison 17 Acupuncture, hot herbal compress, and moxibustion plus Centella triterpenes tablets and vitamin E × Heparin sodium cream plus Centella triterpenes tablets and vitamin E, Outcome 4 Joint function score at the end of the six‐month treatment period.
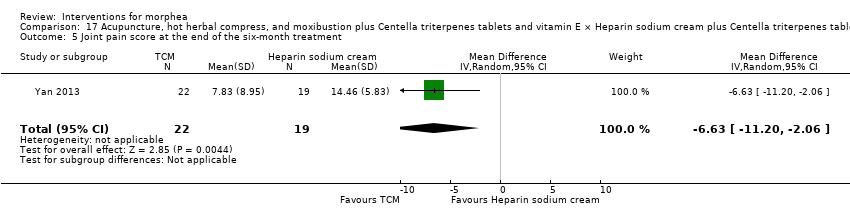
Comparison 17 Acupuncture, hot herbal compress, and moxibustion plus Centella triterpenes tablets and vitamin E × Heparin sodium cream plus Centella triterpenes tablets and vitamin E, Outcome 5 Joint pain score at the end of the six‐month treatment.
| Oral methotrexate and oral prednisone compared to placebo and oral prednisone for juvenile morphea | ||||||
| Patient or population: children and adolescents with active morphea (linear scleroderma, generalised morphea and mixed subtype: linear and circumscribed). | ||||||
| Outcomes | Anticipated absolute effects* (95% CI) | Relative effect | № of participants | Quality of the evidence | Comments | |
| Risk with placebo plus folic acid supplementation and oral prednisone | Risk with oral methotrexate plus folic acid supplementation and oral prednisone | |||||
| Primary outcome: Global improvement of disease activity or damage assessed by a medical practitioner or by participants | Children and adolescents with morphea | RR 2.31 | 70 | ⊕⊕⊝⊝ | ||
| 292 per 1000 | 674 per 1000 | |||||
| Primary outcome: Adverse effects | Children and adolescents with morphea | RR 1.23 | 70 | ⊕⊝⊝⊝ | ||
| 458 per 1000 | 564 per 1000 | |||||
| Secondary outcome: Improvement of disease activity (reduction in lesion size) | The mean SSR was 1.1 | MD 0.31 lower | ‐ | 70 | ⊕⊕⊝⊝ | |
| Secondary outcome: Improvement of disease damage | See comment | ‐ | 70 | ‐ | Authors reported no significant differences between groups in the Childhood Health Assessment Questionnaire (C‐HAQ) disability index, but reported no numerical data. | |
| *The risk in the intervention group (and its 95% CI) is based on the assumed risk in the comparison group and the relative effect of the intervention (and its 95% CI). | ||||||
| GRADE Working Group grades of evidence | ||||||
| aDowngraded by 2 levels to low quality evidence. 1 level due to unclear risk of selection bias (allocation concealment) and high risk of reporting bias (selective reporting). Downgraded by 1 level due to small number of events (less than 300 events). bDowngraded by 2 levels to low quality evidence. 1 level due to unclear risk of selection bias (allocation concealment) and high risk of reporting bias (selective reporting). Downgraded by 1 level due to small number of events (less than 300 events) and wide confidence interval (includes both null effect and appreciable harm). cDowngraded by 2 levels to low quality evidence. 1 level due to unclear risk of selection bias (allocation concealment) and high risk of reporting bias (selective reporting). Downgraded by 1 level due to small number of participants (less than 400 participants). | ||||||
| Medium‐dose UVA‐1 phototherapy (50 J/cm²) compared to low‐dose UVA‐1 phototherapy (20 J/cm²) for morphea | ||||||
| Patient or population: children and adults with active morphea (circumscribed morphea, linear scleroderma (with trunk/limb variant and head variant), generalised morphea, or mixed morphea). | ||||||
| Outcomes | Anticipated absolute effects* (95% CI) | Relative effect | № of participants | Quality of the evidence | Comments | |
| Risk with low‐dose UVA‐1 phototherapy (20 J/cm²) | Risk with Medium‐dose UVA‐1 phototherapy (50 J/cm²) | |||||
| Primary outcome: Global improvement of disease activity or damage assessed by a medical practitioner or by participants | The mean score (MSS) was 5 | MD 1.60 more | ‐ | 44 | ⊕⊝⊝⊝ | |
| Primary outcome: Adverse effects | Individuals with morphea | RR 1.00 | 44 | ⊕⊝⊝⊝ | ||
| 1000 per 1000 | 1000 per 1000 | |||||
| Secondary outcome: Improvement of disease activity (skin softening) | The mean ultrasound score was 69 | MD 16.43 lower | ‐ | 36 | ⊕⊝⊝⊝ | |
| Secondary outcome: Improvement of disease damage ‒ not measured | See comment | ‐ | ‐ | ‐ | There was no measure of this outcome for this comparison. | |
| *The risk in the intervention group (and its 95% CI) is based on the assumed risk in the comparison group and the relative effect of the intervention (and its 95% CI). CI: Confidence interval; RR: Risk ratio; OR: Odds ratio; | ||||||
| GRADE Working Group grades of evidence | ||||||
| aDowngraded by 2 levels to low quality evidence. 1 level due to high risk of performance bias (blinding of participants and personnel), detection bias (blinding of outcome assessment) and reporting bias (selective reporting). Downgraded by 1 level due to small number of participants (less than 400 participants). bDowngraded by 2 levels to low quality evidence. 1 level due to high risk of performance bias (blinding of participants and personnel), detection bias (blinding of outcome assessment) and reporting bias (selective reporting). Downgraded by 1 level due to small number of events (less than 300 events). cDowngraded by 2 levels to low quality evidence. 1 level due to high risk of performance bias (blinding of participants and personnel), detection bias (blinding of outcome assessment) and reporting bias (selective reporting). Downgraded by 1 level due to small number of participants (less than 400 participants) and wide confidence interval (includes both null effect and appreciable benefit). | ||||||
| Narrowband UVB phototherapy compared to medium‐dose UVA‐1 phototherapy (50 J/cm2) for morphea | ||||||
| Patient or population: children and adults with active morphea (circumscribed morphea, linear scleroderma (with trunk/limb variant and head variant), generalised morphea, or mixed morphea). | ||||||
| Outcomes | Anticipated absolute effects* (95% CI) | Relative effect | № of participants | Quality of the evidence | Comments | |
| Risk with medium‐dose UVA‐1 phototherapy (50 J/cm2) | Risk with Narrowband UVB phototherapy | |||||
| Primary outcome: Global improvement of disease activity or damage assessed by a medical practitioner or by participants | The mean score (MSS) was 6.6 | MD 1.70 lower | ‐ | 35 | ⊕⊝⊝⊝ | |
| Primary outcome: Adverse effects | Individuals with morphea | RR 0.03 | 35 | ⊕⊝⊝⊝ | ||
| 1000 per 1000 | 30 per 1000 | |||||
| Secondary outcome: Improvement of disease activity (skin softening) | The mean ultrasound score was 52.57 | MD 17.78 higher | ‐ | 28 | ⊕⊝⊝⊝ | |
| Secondary outcome: Improvement of disease damage ‐ not measured | See comment | ‐ | ‐ | ‐ | There was no measure of this outcome for this comparison. | |
| *The risk in the intervention group (and its 95% CI) is based on the assumed risk in the comparison group and the relative effect of the intervention (and its 95% CI). | ||||||
| GRADE Working Group grades of evidence | ||||||
| aDowngraded by 2 levels to low quality evidence. 1 level due to high risk of performance bias (blinding of participants and personnel), detection bias (blinding of outcome assessment) and reporting bias (selective reporting). Downgraded by 1 level due to small number of participants (less than 400 participants). bDowngraded by 2 levels to low quality evidence. 1 level due to high risk of performance bias (blinding of participants and personnel), detection bias (blinding of outcome assessment) and reporting bias (selective reporting). Downgraded by 1 level due to small number of events (less than 300 events). cDowngraded by 2 levels to low quality evidence. 1 level due to high risk of performance bias (blinding of participants and personnel), detection bias (blinding of outcome assessment) and reporting bias (selective reporting). Downgraded by 1 level due to small number of participants (less than 400 participants) and wide confidence interval (includes both null effect and appreciable benefit). | ||||||
| Narrowband UVB compared to low‐dose UVA‐1 phototherapy (20 J/cm2) for morphea | ||||||
| Patient or population: children and adults with active morphea (circumscribed morphea, linear scleroderma (with trunk/limb variant and head variant), generalised morphea, or mixed morphea). | ||||||
| Outcomes | Anticipated absolute effects* (95% CI) | Relative effect | № of participants | Quality of the evidence | Comments | |
| Risk with low‐dose UVA‐1 phototherapy (20 J/cm2) | Risk with Narrowband UVB | |||||
| Primary outcome: Global improvement of disease activity or damage assessed by a medical practitioner or by participants | The mean score (MSS) was 5 | MD 0.10 lower | ‐ | 45 | ⊕⊝⊝⊝ | |
| Primary outcome: Adverse effects | Individuals with morphea | RR 0.03 | 45 | ⊕⊝⊝⊝ Low b | ||
| 1000 per 1000 | 30 per 1000 | |||||
| Secondary outcome: Improvement of disease activity (skin softening) | The mean ultrasound score was 69 | MD 1.35 higher | ‐ | 32 | ⊕⊝⊝⊝ | |
| Secondary outcome: Improvement of disease damage ‐ not measured | See comment | ‐ | ‐ | ‐ | There was no measure of this outcome for this comparison. | |
| *The risk in the intervention group (and its 95% CI) is based on the assumed risk in the comparison group and the relative effect of the intervention (and its 95% CI). | ||||||
| GRADE Working Group grades of evidence | ||||||
| aDowngraded by 2 levels to low quality evidence. 1 level due to high risk of performance bias (blinding of participants and personnel), detection bias (blinding of outcome assessment) and reporting bias (selective reporting). Downgraded by 1 level due to small number of participants (less than 400 participants). bDowngraded by 2 levels to low quality evidence. 1 level due to high risk of performance bias (blinding of participants and personnel), detection bias (blinding of outcome assessment) and reporting bias (selective reporting). Downgraded by 1 level due to small number of events (less than 300 events). cDowngraded by 3 levels to very low quality evidence. 1 level due to high risk of performance bias (blinding of participants and personnel), detection bias (blinding of outcome assessment) and reporting bias (selective reporting). Downgraded by 2 levels due to small number of participants (less than 400 participants) and wide confidence interval (includes both null effect and appreciable benefit). | ||||||
| Term | Definition |
| ALA | 5‐aminolaevulinic acid |
| BB | broad‐band |
| CDLQI | Children's Dermatology Life Quality Index |
| C‐HAQ | Childhood Health Assessment Questionnaire |
| CI | confidence interval |
| CO₂ | carbon dioxide |
| DIET | dyspigmentation, induration, erythema, telangiectasia |
| DLQI | Dermatology Life Quality Index |
| DNA | deoxyribonucleic acid |
| HCQ | hydroxychloroquine |
| IFN‐γ | interferon gamma |
| ITT | intention‐to‐treat |
| ISDL | Impact of Chronic Skin Disease on Daily Life scale |
| LoSCAT | Localized Scleroderma Cutaneous Assessment Tool |
| LoSDI | Localized Scleroderma Skin Damage Index |
| LoSSI | Localized Scleroderma Skin Severity Index |
| mLoSSI | Modified Localized Scleroderma Skin Severity Index |
| mRSS | Modified Rodnan Skin Score |
| MD | mean difference |
| MHz | megahertz |
| MSS | modified skin score |
| MTX | methotrexate |
| NNT | number needed to treat |
| PDT | photodynamic therapy |
| PGA‐D | Physician Global Assessment of disease Damage |
| PtGA‐S | Patient Global Assessment of disease Severity |
| PUVA | psoralen plus ultraviolet A |
| RCT | randomised controlled trial |
| RR | risk ratio |
| RSS | Rodnan skin score |
| SMD | standardised mean differences |
| SSc | systemic sclerosis |
| SSR | skin score rate |
| UV | ultraviolet |
| UVA | ultraviolet A |
| UVB | ultraviolet B |
| VAS | visual analogue scale |
| ΔTh% | percentage thermal change from baseline |
| Study ID | Date contacted | Information requested | Date of reply |
| 26 April 2016, 4 July 2016 | The register of the trial, ethics committee approval and funding source; If it was a single‐centre or double‐centre study; The methods used to generate the random sequence and to conceal it; If the outcome assessor was blinded from knowledge of which intervention a participant received; If authors could provide separate data for children and adults; What was the type of morphea and the sex of the four participants who discontinued the treatment. | 26 April 2016, 5 July 2016 | |
| 26 April 2016, 4 July 2016 | If the study was conducted both at the Dermatologic Centre Ladislado de la Pascua and at the department of Immunology and Rheumatology of the National Institute of Medical Sciences and Nutrition Salvador Zubirán; If the trial was registered and received funding; If there were significant baseline differences between the intervention groups; The method used to conceal the random sequence; If authors could provide the baseline mRSS for the intervention groups separately; If authors could provide the numerical data for adverse events. | 26 April 2016, 7 July 2016 | |
| 26 April 2016, 3 October 2016 | The register of the trial, ethics committee approval, funding source and declaration of interests; The method used to conceal the random sequence; If the outcome assessor of skin score was blinded from knowledge of which intervention a participant received; What was the duration of the follow‐up after treatment; If authors could provide VAS data with standard deviation. | 4 October 2016 | |
| 10 June 2017, 22 July 2018, 26 July 2018, 28 July 2018 | If this study was completed, and if authors have published the results or could provide data; If the trial received funding; The method used to conceal the random sequence; If outcome assessors were blinded from knowledge of which intervention a participant received; If the LoSCAT, PGA‐A and the PGA‐D included only participants with morphea; If there were baseline differences between treatment sites; If any participant left the study before completion; If authors could provide standard deviation values or raw data from the treatment sites. | 11 June 2017, 23 July 2018 27 July 2018 | |
| 26 April 2016, 3 October 2016 | The register of the trial, ethics committee approval, funding source and declaration of interests; The methods used to generate the random sequence and to conceal it; If outcome assessors were blinded from knowledge of which intervention a participant received; If authors included the four participants who experienced side effects in the analysis after treatment; If authors could provide data of the planimetry and skin thickness assessments with standard deviation. | 28 April 2016 | |
| 4 July 2016 | If this study was completed, and if authors have published the results or could provide data. | 7 July 2016 |
| Outcome or subgroup title | No. of studies | No. of participants | Statistical method | Effect size |
| 1 Modified Skin Score (MSS) at the end of the eight‐week treatment Show forest plot | 1 | 44 | Mean Difference (IV, Random, 95% CI) | 1.60 [‐1.70, 4.90] |
| 2 Modified Skin Score (MSS) at last follow‐up visit (week 20) Show forest plot | 1 | 44 | Mean Difference (IV, Random, 95% CI) | 2.5 [‐1.90, 6.90] |
| 3 Number of participants with mild tanning Show forest plot | 1 | 44 | Risk Ratio (M‐H, Random, 95% CI) | 1.0 [0.91, 1.10] |
| 4 Ultrasound dermal density at the end of the eight‐week treatment Show forest plot | 1 | 36 | Mean Difference (IV, Random, 95% CI) | ‐16.43 [‐34.87, 2.01] |
| 5 Ultrasound corium thickness at the end of the eight‐week treatment Show forest plot | 1 | 36 | Mean Difference (IV, Random, 95% CI) | 196.29 [‐162.28, 554.86] |
| Outcome or subgroup title | No. of studies | No. of participants | Statistical method | Effect size |
| 1 Modified Skin Score (MSS) at the end of the eight‐week treatment Show forest plot | 1 | 35 | Mean Difference (IV, Random, 95% CI) | ‐1.70 [‐5.27, 1.87] |
| 2 Modified Skin Score (MSS) at last follow‐up visit (week 20) Show forest plot | 1 | 35 | Mean Difference (IV, Random, 95% CI) | ‐2.10 [‐6.73, 2.53] |
| 3 Number of participants with mild tanning Show forest plot | 1 | 35 | Risk Ratio (M‐H, Random, 95% CI) | 0.03 [0.00, 0.42] |
| 4 Number of participants with transient erythema Show forest plot | 1 | 35 | Risk Ratio (M‐H, Random, 95% CI) | 6.63 [0.37, 119.59] |
| 5 Ultrasound dermal density at the end of the eight‐week treatment Show forest plot | 1 | 28 | Mean Difference (IV, Random, 95% CI) | 17.78 [‐6.08, 41.64] |
| 6 Ultrasound corium thickness at the end of the eight‐week treatment Show forest plot | 1 | 28 | Mean Difference (IV, Random, 95% CI) | ‐78.35 [‐528.59, 371.89] |
| Outcome or subgroup title | No. of studies | No. of participants | Statistical method | Effect size |
| 1 Modified Skin Score (MSS) at the end of the eight‐week treatment Show forest plot | 1 | 45 | Mean Difference (IV, Random, 95% CI) | ‐0.10 [‐2.49, 2.29] |
| 2 Modified Skin Score (MSS) at last follow‐up visit (week 20) Show forest plot | 1 | 45 | Mean Difference (IV, Random, 95% CI) | 0.40 [‐2.17, 2.97] |
| 3 Number of participants with mild tanning Show forest plot | 1 | 45 | Risk Ratio (M‐H, Random, 95% CI) | 0.03 [0.00, 0.41] |
| 4 Number of participants with transient erythema Show forest plot | 1 | 45 | Risk Ratio (M‐H, Random, 95% CI) | 10.32 [0.56, 188.49] |
| 5 Ultrasound dermal density at the end of the eight‐week treatment Show forest plot | 1 | 32 | Mean Difference (IV, Random, 95% CI) | 1.35 [‐19.39, 22.09] |
| 6 Ultrasound corium thickness at the end of the eight‐week treatment Show forest plot | 1 | 32 | Mean Difference (IV, Random, 95% CI) | 117.94 [‐311.20, 547.08] |
| Outcome or subgroup title | No. of studies | No. of participants | Statistical method | Effect size |
| 1 Number of plaques with moderate to significant tanning Show forest plot | 1 | Risk Ratio (Random, 95% CI) | 29.00 [1.90, 443.28] | |
| 2 Number of plaques with painless erythema Show forest plot | 1 | Risk Ratio (Random, 95% CI) | 4.41 [0.23, 84.79] | |
| 3 Number of plaques with pruritus Show forest plot | 1 | Risk Ratio (Random, 95% CI) | 4.41 [0.23, 84.79] | |
| Outcome or subgroup title | No. of studies | No. of participants | Statistical method | Effect size |
| 1 Number of participants with generalised tanning Show forest plot | 1 | 47 | Risk Ratio (M‐H, Random, 95% CI) | 1.0 [0.92, 1.09] |
| 2 Number of participants with temporary pruritus Show forest plot | 1 | 47 | Risk Ratio (M‐H, Random, 95% CI) | 0.81 [0.18, 3.60] |
| 3 Number of participants with increased erythema and exacerbated pain Show forest plot | 1 | 47 | Risk Ratio (M‐H, Random, 95% CI) | 2.44 [0.10, 57.08] |
| 4 Number of participants with skin softening at the end of the seven‐week treatment Show forest plot | 1 | 47 | Risk Ratio (M‐H, Random, 95% CI) | 1.21 [0.69, 2.11] |
| Outcome or subgroup title | No. of studies | No. of participants | Statistical method | Effect size |
| 1 Number of participants with generalised tanning Show forest plot | 1 | 42 | Risk Ratio (M‐H, Random, 95% CI) | 1.0 [0.91, 1.10] |
| 2 Number of participants with temporary pruritus Show forest plot | 1 | 42 | Risk Ratio (M‐H, Random, 95% CI) | 0.62 [0.14, 2.69] |
| 3 Number of participants with increased erythema and exacerbated pain Show forest plot | 1 | 42 | Risk Ratio (M‐H, Random, 95% CI) | 1.89 [0.08, 43.75] |
| 4 Number of participants with skin softening at the end of the seven‐week treatment Show forest plot | 1 | 42 | Risk Ratio (M‐H, Random, 95% CI) | 1.54 [0.75, 3.14] |
| Outcome or subgroup title | No. of studies | No. of participants | Statistical method | Effect size |
| 1 Number of participants with generalised tanning Show forest plot | 1 | 37 | Risk Ratio (M‐H, Random, 95% CI) | 1.0 [0.90, 1.11] |
| 2 Number of participants with temporary pruritus Show forest plot | 1 | 37 | Risk Ratio (M‐H, Random, 95% CI) | 0.76 [0.18, 3.29] |
| 3 Number of participants with skin softening at the end of the seven‐week treatment Show forest plot | 1 | 37 | Risk Ratio (M‐H, Random, 95% CI) | 1.27 [0.58, 2.76] |
| Outcome or subgroup title | No. of studies | No. of participants | Statistical method | Effect size |
| 1 Number of plaques with pigmentation Show forest plot | 1 | Risk Ratio (Random, 95% CI) | 13.00 [0.89, 189.38] | |
| 2 Number of plaques with burning sensation during phototherapy Show forest plot | 1 | Risk Ratio (Random, 95% CI) | 9.00 [0.59, 137.65] | |
| 3 Number of plaques with dryness Show forest plot | 1 | Risk Ratio (Random, 95% CI) | 3.00 [0.15, 61.73] | |
| 4 Number of plaques with erythema Show forest plot | 1 | Risk Ratio (Random, 95% CI) | 5.00 [0.29, 86.43] | |
| 5 Number of plaques with pruritus Show forest plot | 1 | Risk Ratio (Random, 95% CI) | 3.00 [0.15, 61.73] | |
| 6 Number of plaques with reduction in the skin score at the 12‐week follow‐up Show forest plot | 1 | Risk Ratio (Random, 95% CI) | 1.0 [0.45, 2.23] | |
| Outcome or subgroup title | No. of studies | No. of participants | Statistical method | Effect size |
| 1 Number of lesions with mild to moderate pain during therapy Show forest plot | 1 | Risk Ratio (Random, 95% CI) | 35.00 [2.27, 538.86] | |
| 2 Number of lesions with marked pain during therapy Show forest plot | 1 | Risk Ratio (Random, 95% CI) | 21.00 [1.33, 332.06] | |
| 3 Number of lesions with pruritus in first 24h Show forest plot | 1 | Risk Ratio (Random, 95% CI) | 17.00 [1.06, 273.00] | |
| 4 Number of lesions with hyperpigmentation Show forest plot | 1 | Risk Ratio (Random, 95% CI) | 0.25 [0.03, 2.01] | |
| 5 Number of lesions with persistent erythema Show forest plot | 1 | Risk Ratio (Random, 95% CI) | 3.00 [0.13, 68.84] | |
| 6 Ultrasound biomicroscopy dermal thickness at the 10‐week follow‐up Show forest plot | 1 | Mean Difference (Random, 95% CI) | ‐0.15 [‐0.33, 0.03] | |
| 7 Clinical score at the 10‐week follow‐up Show forest plot | 1 | Mean Difference (Random, 95% CI) | ‐1.59 [‐2.82, ‐0.36] | |
| 8 Participant satisfaction score at the 10‐week follow‐up Show forest plot | 1 | Mean Difference (Random, 95% CI) | 1.12 [0.80, 1.44] | |
| 9 Number of lesions with good or very good improvement in the clinical score at the 10‐week follow‐up Show forest plot | 1 | Risk Ratio (Random, 95% CI) | 2.67 [1.39, 5.13] | |
| Outcome or subgroup title | No. of studies | No. of participants | Statistical method | Effect size |
| 1 Number of participants with short‐duration pain at injection site Show forest plot | 1 | 27 | Risk Ratio (M‐H, Random, 95% CI) | 5.79 [1.86, 18.02] |
| 2 Number of participants with pruritus Show forest plot | 1 | 27 | Risk Ratio (M‐H, Random, 95% CI) | 0.07 [0.00, 1.14] |
| 3 Number of participants with sclerosis Show forest plot | 1 | 27 | Risk Ratio (M‐H, Random, 95% CI) | 0.36 [0.02, 8.06] |
| 4 Skin score at the end of the three‐month treatment Show forest plot | 1 | 27 | Mean Difference (IV, Random, 95% CI) | 1.30 [0.31, 2.29] |
| 5 Skin score at last follow‐up visit (month nine) Show forest plot | 1 | 27 | Mean Difference (IV, Random, 95% CI) | 0.5 [‐0.25, 1.25] |
| 6 Number of morphea lesions at the end of the three‐month treatment Show forest plot | 1 | 27 | Mean Difference (IV, Random, 95% CI) | 0.20 [‐0.16, 0.56] |
| Outcome or subgroup title | No. of studies | No. of participants | Statistical method | Effect size |
| 1 Clinical response at the end of the 12‐month treatment Show forest plot | 1 | 70 | Risk Ratio (M‐H, Random, 95% CI) | 2.31 [1.20, 4.45] |
| 2 Number of participants with at least one adverse event Show forest plot | 1 | 70 | Risk Ratio (M‐H, Random, 95% CI) | 1.23 [0.75, 2.04] |
| 3 Skin Score Rate (SSR) at the end of the 12‐month treatment Show forest plot | 1 | 70 | Mean Difference (IV, Random, 95% CI) | ‐0.31 [‐0.35, ‐0.27] |
| 4 Percentage thermal change at the end of the 12‐month treatment Show forest plot | 1 | 70 | Mean Difference (IV, Random, 95% CI) | ‐32.3 [‐37.92, ‐26.68] |
| 5 Number of participants with new lesions at the end of the 12‐month treatment Show forest plot | 1 | 70 | Risk Ratio (M‐H, Random, 95% CI) | 0.39 [0.10, 1.61] |
| Outcome or subgroup title | No. of studies | No. of participants | Statistical method | Effect size |
| 1 Modified Skin Score (MSS) at the end of the three‐month treatment Show forest plot | 1 | 25 | Mean Difference (IV, Random, 95% CI) | 0.5 [‐1.93, 2.93] |
| 2 Number of participants with liver enzymes rise more than three times during the three‐month treatment Show forest plot | 1 | 25 | Risk Ratio (M‐H, Random, 95% CI) | 0.13 [0.01, 2.33] |
| 3 VAS for participants' estimate of skin tightness at the end of the three‐month treatment Show forest plot | 1 | 25 | Mean Difference (IV, Random, 95% CI) | 0.30 [‐0.49, 1.09] |
| 4 VAS for participants' estimate of pruritus at the end of the three‐month treatment Show forest plot | 1 | 25 | Mean Difference (IV, Random, 95% CI) | ‐2.3 [‐3.25, ‐1.35] |
| Outcome or subgroup title | No. of studies | No. of participants | Statistical method | Effect size |
| 1 Number of plaques with pruritus Show forest plot | 1 | Risk Ratio (Random, 95% CI) | 3.00 [0.14, 65.90] | |
| 2 Durometer score at the end of the 12‐week treatment Show forest plot | 1 | Mean Difference (Random, 95% CI) | 47.2 [‐44.55, 138.95] | |
| 3 Plaque surface area at the end of the 12‐week treatment Show forest plot | 1 | Mean Difference (Random, 95% CI) | 0.5 [‐38.35, 39.35] | |
| 4 Number of plaques with a reduced modified DIET score at the end of the 12‐week treatment Show forest plot | 1 | Risk Ratio (Random, 95% CI) | 1.14 [0.69, 1.90] | |
| 5 Modified DIET score at the end of the 12‐week treatment Show forest plot | 1 | Mean Difference (Random, 95% CI) | ‐1.7 [‐3.11, ‐0.29] | |
| Outcome or subgroup title | No. of studies | No. of participants | Statistical method | Effect size |
| 1 Number of participants with transient hypercalciuria Show forest plot | 1 | 27 | Risk Ratio (M‐H, Random, 95% CI) | 7.50 [0.42, 132.58] |
| 2 Skin score at the end of the 9‐month treatment Show forest plot | 1 | 20 | Mean Difference (IV, Random, 95% CI) | 1.10 [‐2.98, 5.18] |
| 3 Skin score at the end of the 15‐month follow‐up Show forest plot | 1 | 20 | Mean Difference (IV, Random, 95% CI) | 3.70 [‐1.49, 8.89] |
| Outcome or subgroup title | No. of studies | No. of participants | Statistical method | Effect size |
| 1 Clinical score at the end of the three‐month treatment Show forest plot | 1 | Mean Difference (Random, 95% CI) | ‐1.5 [‐3.88, 0.88] | |
| 2 Physician Global Assessment of Activity at the end of the three‐month treatment Show forest plot | 1 | Mean Difference (Random, 95% CI) | ‐7.5 [‐23.73, 8.73] | |
| 3 Number of lesions with disease progression at the end of the three‐month treatment Show forest plot | 1 | Risk Ratio (Random, 95% CI) | 0.24 [0.01, 4.47] | |
| 4 Physician Global Assessment of Damage at the end of the three‐month treatment Show forest plot | 1 | Mean Difference (Random, 95% CI) | ‐6.00 [‐24.90, 12.90] | |
| Outcome or subgroup title | No. of studies | No. of participants | Statistical method | Effect size |
| 1 Number of participants with adverse events Show forest plot | 1 | 24 | Risk Ratio (M‐H, Random, 95% CI) | 1.0 [0.17, 5.98] |
| Outcome or subgroup title | No. of studies | No. of participants | Statistical method | Effect size |
| 1 Number of participants with significant clinical response at the end of the six‐month treatment Show forest plot | 1 | 41 | Risk Ratio (M‐H, Random, 95% CI) | 1.64 [1.04, 2.59] |
| 2 Number of participants with pain during treatment Show forest plot | 1 | 41 | Risk Ratio (M‐H, Random, 95% CI) | 2.61 [0.11, 60.51] |
| 3 Skin sclerosis score at the end of the six‐month treatment Show forest plot | 1 | 41 | Mean Difference (IV, Random, 95% CI) | ‐10.34 [‐16.83, ‐3.85] |
| 4 Joint function score at the end of the six‐month treatment period Show forest plot | 1 | 41 | Mean Difference (IV, Random, 95% CI) | ‐1.65 [‐2.95, ‐0.35] |
| 5 Joint pain score at the end of the six‐month treatment Show forest plot | 1 | 41 | Mean Difference (IV, Random, 95% CI) | ‐6.63 [‐11.20, ‐2.06] |