Diferentes esquemas de dosis para la reducción de la cardiotoxicidad en pacientes con cáncer que reciben quimioterapia con antraciclina
Información
- DOI:
- https://doi.org/10.1002/14651858.CD005008.pub4Copiar DOI

- Base de datos:
-
- Cochrane Database of Systematic Reviews
- Versión publicada:
-
- 03 marzo 2016see what's new
- Tipo:
-
- Intervention
- Etapa:
-
- Review
- Grupo Editorial Cochrane:
-
Grupo Cochrane de Cáncer ginecológico, neurooncología y otros cánceres
- Copyright:
-
- Copyright © 2016 The Cochrane Collaboration. Published by John Wiley & Sons, Ltd.
Cifras del artículo
Altmetric:
Citado por:
Autores
Contributions of authors
Elvira C van Dalen designed the study and wrote the review. She developed the search strategy and undertook the searches in the different electronic databases for the original review. She searched for unpublished and ongoing studies and identified the studies meeting the inclusion criteria. She performed the data extraction and 'Risk of bias' assessment of the included studies. She analysed the data and interpreted the results. She wrote and revised the manuscript.
Helena JH van der Pal identified studies meeting the inclusion criteria. She performed the data extraction and 'Risk of bias' assessment of the included studies. She contributed to the data analysis and the interpretation of the results. She critically reviewed the manuscript.
Leontien CM Kremer designed the study. She contributed to the 'Risk of bias' assessment, data analysis, and the interpretation of the results. She critically reviewed the manuscript.
All review authors approved the final version.
Sources of support
Internal sources
-
No sources of support supplied
External sources
-
Stichting Kinderen Kankervrij (KiKa), Netherlands
Declarations of interest
Elvira C van Dalen: None known.
Helena JH van der Pal: None known.
Leontien CM Kremer: None known.
Acknowledgements
We would like to thank Edith Leclercq, the Trials Search Co‐ordinator of Cochrane Childhood Cancer, for running the search strategy for the updates in the different databases and providing us with the titles and abstracts of the searches. We thank Jorrit van As for the identification of studies in the top‐up search performed in December 2015. We would also like to thank Prof Dr Axel Heidenreich and Prof Dr Steven Lipshultz for providing additional information regarding their studies. Huib Caron was a co‐author of the protocol for this systematic review, the original version, and the first update, and we thank him for his valuable input. Finally, we would like to thank Stichting Kinderen Kankervrij (KiKa), the Netherlands for the financial support that made it possible to perform this update; the editorial base of the Cochrane Childhood Cancer Group is funded by Stichting Kinderen Kankervrij (KiKa). We calculated the hazard ratio and associated statistics for survival analyses using an Excel spreadsheet developed by Matthew Sydes and Jayne Tierney of the Medical Research Council Clinical Trials Unit, London, United Kingdom. We also thank Jo Morrison, Gail Quinn and Clare Jess for their contribution to the editorial process.
This project was supported by the National Institute for Health Research, via Cochrane Infrastructure funding to the Cochrane Gynaecological, Neuro‐oncology and Orphan Cancer Group. The views and opinions expressed therein are those of the authors and do not necessarily reflect those of the Systematic Reviews Programme, NIHR, NHS, or the Department of Health.
Version history
| Published | Title | Stage | Authors | Version |
| 2016 Mar 03 | Different dosage schedules for reducing cardiotoxicity in people with cancer receiving anthracycline chemotherapy | Review | Elvira C Dalen, Helena JH Pal, Leontien CM Kremer | |
| 2009 Oct 07 | Different dosage schedules for reducing cardiotoxicity in cancer patients receiving anthracycline chemotherapy | Review | Elvira C van Dalen, Helena JH van der Pal, Huib N Caron, Leontien CM Kremer | |
| 2009 Jul 08 | Different dosage schedules for reducing cardiotoxicity in cancer patients receiving anthracycline chemotherapy | Review | Elvira C van Dalen, Helena J H van der Pal, Huib N Caron, Leontien CM Kremer | |
| 2004 Jul 19 | Different dosage schedules for reducing cardiotoxicity in cancer patients receiving anthracycline chemotherapy | Protocol | Elvira C van Dalen, Heleen van der Pal, Leontien C.M. Kremer | |
Differences between protocol and review
We stated in the protocol that we would analyse different anthracycline peak doses as high (greater than or equal to 50 mg/m2) versus low (less than 50 mg/m2) doses received in one week. However, if we would have applied this definition to the included studies, pooling would not have been possible. Therefore, keeping in mind that any cut‐off point is arbitrary, we decided to define a low peak dose as less than 60 mg/m2 and a high peak dose as greater than or equal to 60 mg/m2.
For the second update we used the most recent recommendations of Cochrane Childhood Cancer for the assessment of risk of bias in the included studies, which are based on the Cochrane Handbook for Systematic Reviews of Interventions. All publications (including those already included in earlier versions of the review) were scored using the new 'Risk of bias' items.
Keywords
MeSH
Medical Subject Headings (MeSH) Keywords
- Anthracyclines [*administration & dosage, adverse effects];
- Antibiotics, Antineoplastic [*administration & dosage, adverse effects];
- Cardiac Output, Low [chemically induced, prevention & control];
- Heart [*drug effects];
- Heart Diseases [chemically induced];
- Neoplasms [*drug therapy];
- Randomized Controlled Trials as Topic;
Medical Subject Headings Check Words
Adult; Child; Humans;
PICO
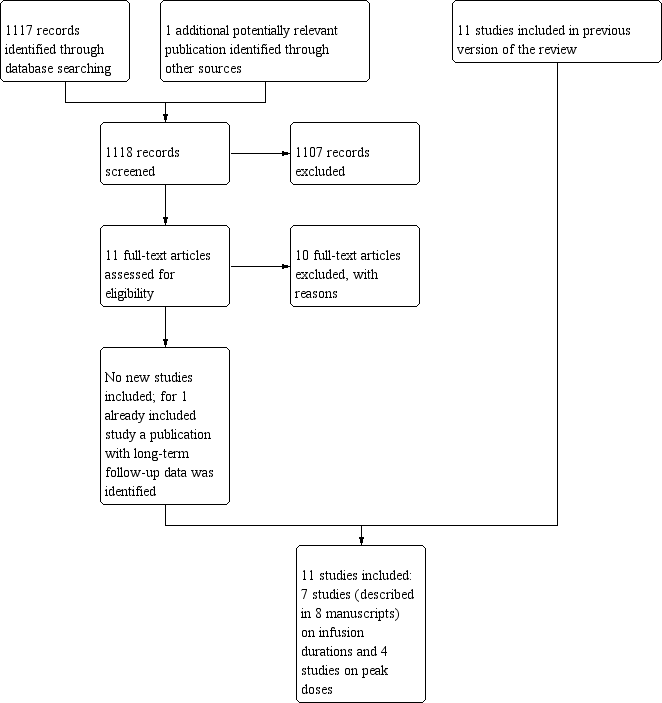
Study flow diagram.

Risk of bias summary: review authors' judgements about each risk of bias item for each included study.

Comparison 1: Infusion duration less than 6 hours versus infusion duration 6 hours or more, Outcome 1: Clinical heart failure

Comparison 1: Infusion duration less than 6 hours versus infusion duration 6 hours or more, Outcome 2: (Sub)clinical heart failure combined

Comparison 1: Infusion duration less than 6 hours versus infusion duration 6 hours or more, Outcome 3: Response rate

Comparison 1: Infusion duration less than 6 hours versus infusion duration 6 hours or more, Outcome 4: Overall survival

Comparison 2: Doxorubicin peak dose less than 60 mg/m2 versus 60 mg/m2 or more, Outcome 1: Clinical heart failure

Comparison 2: Doxorubicin peak dose less than 60 mg/m2 versus 60 mg/m2 or more, Outcome 2: Overall survival

Comparison 2: Doxorubicin peak dose less than 60 mg/m2 versus 60 mg/m2 or more, Outcome 3: Adverse effects other than cardiac damage

Comparison 3: Liposomal doxorubicin (Caelyx) peak dose 25 mg/m2 versus 50 mg/m2, Outcome 1: Response rate (defined as objective palliative tumour response (i.e. decrease in PSA levels of >= 50%))

Comparison 3: Liposomal doxorubicin (Caelyx) peak dose 25 mg/m2 versus 50 mg/m2, Outcome 2: Adverse effects other than cardiac damage

Comparison 4: Epirubicin peak dose 110 mg/m2 versus 83 mg/m2, Outcome 1: Clinical heart failure

Comparison 4: Epirubicin peak dose 110 mg/m2 versus 83 mg/m2, Outcome 2: Adverse effects other than cardiac damage
| Outcome or subgroup title | No. of studies | No. of participants | Statistical method | Effect size |
| 1.1 Clinical heart failure Show forest plot | 5 | 557 | Risk Ratio (M‐H, Random, 95% CI) | 0.27 [0.09, 0.81] |
| 1.2 (Sub)clinical heart failure combined Show forest plot | 4 | Risk Ratio (M‐H, Random, 95% CI) | Subtotals only | |
| 1.2.1 (Sub)clinical heart failure combined (subclinical defined as >=10% decrease in LVEF) | 1 | 82 | Risk Ratio (M‐H, Random, 95% CI) | 0.76 [0.46, 1.26] |
| 1.2.2 (Sub)clinical heart failure combined (subclinical defined as >=15% decrease in LVEF) | 1 | 52 | Risk Ratio (M‐H, Random, 95% CI) | 0.31 [0.03, 2.78] |
| 1.2.3 (Sub)clinical heart failure combined (subclinical defined as a fall in LVEF of > 20%) | 1 | 62 | Risk Ratio (M‐H, Random, 95% CI) | 0.04 [0.00, 0.60] |
| 1.2.4 (Sub)clinical heart failure combined (subclinical defined as a decrease in LVEF) | 1 | 240 | Risk Ratio (M‐H, Random, 95% CI) | 0.36 [0.15, 0.90] |
| 1.3 Response rate Show forest plot | 3 | Risk Ratio (M‐H, Random, 95% CI) | Subtotals only | |
| 1.3.1 Response rate (defined as complete or partial remission) | 2 | 292 | Risk Ratio (M‐H, Random, 95% CI) | 1.20 [0.65, 2.22] |
| 1.3.2 Response rate (defined as good response) | 1 | 178 | Risk Ratio (M‐H, Random, 95% CI) | 1.23 [0.91, 1.66] |
| 1.4 Overall survival Show forest plot | 2 | 322 | Hazard Ratio (IV, Random, 95% CI) | 1.42 [0.61, 3.30] |
| Outcome or subgroup title | No. of studies | No. of participants | Statistical method | Effect size |
| 2.1 Clinical heart failure Show forest plot | 2 | 4146 | Risk Ratio (M‐H, Random, 95% CI) | 0.65 [0.23, 1.88] |
| 2.2 Overall survival Show forest plot | 2 | 4146 | Hazard Ratio (IV, Random, 95% CI) | 1.06 [0.93, 1.22] |
| 2.3 Adverse effects other than cardiac damage Show forest plot | 2 | Risk Ratio (M‐H, Random, 95% CI) | Subtotals only | |
| 2.3.1 Treatment‐related death | 1 | 3114 | Risk Ratio (M‐H, Random, 95% CI) | 0.19 [0.01, 3.99] |
| 2.3.2 Death attributable to chemotherapy | 1 | 1032 | Risk Ratio (M‐H, Random, 95% CI) | 0.34 [0.01, 8.26] |
| 2.3.3 Leukopenia grade 4 | 1 | 3114 | Risk Ratio (M‐H, Random, 95% CI) | 0.58 [0.53, 0.64] |
| 2.3.4 Leukopenia grade 3 or 4 | 1 | 1032 | Risk Ratio (M‐H, Random, 95% CI) | 0.26 [0.21, 0.31] |
| 2.3.5 Granulocytopenia grade 4 | 1 | 3114 | Risk Ratio (M‐H, Random, 95% CI) | 0.67 [0.61, 0.73] |
| 2.3.6 Thrombocytopenia grade 4 | 1 | 3114 | Risk Ratio (M‐H, Random, 95% CI) | 0.45 [0.34, 0.59] |
| 2.3.7 Diarrhoea grade 3 or 4 | 1 | 3114 | Risk Ratio (M‐H, Random, 95% CI) | 0.34 [0.19, 0.60] |
| 2.3.8 Dyspnoea grade 3 or 4 | 1 | 3114 | Risk Ratio (M‐H, Random, 95% CI) | 0.51 [0.28, 0.93] |
| 2.3.9 Infection grade 3 or 4 | 1 | 3114 | Risk Ratio (M‐H, Random, 95% CI) | 0.61 [0.42, 0.86] |
| 2.3.10 Malaise/fatigue/lethargy grade 3 or 4 | 1 | 3114 | Risk Ratio (M‐H, Random, 95% CI) | 0.66 [0.49, 0.91] |
| 2.3.11 Nausea grade 3 or 4 | 1 | 3114 | Risk Ratio (M‐H, Random, 95% CI) | 1.19 [0.98, 1.44] |
| 2.3.12 Stomatitis grade 3 or 4 | 1 | 3114 | Risk Ratio (M‐H, Random, 95% CI) | 0.40 [0.27, 0.61] |
| 2.3.13 Vomiting grade 3 or 4 | 1 | 3114 | Risk Ratio (M‐H, Random, 95% CI) | 1.31 [1.07, 1.59] |
| Outcome or subgroup title | No. of studies | No. of participants | Statistical method | Effect size |
| 3.1 Response rate (defined as objective palliative tumour response (i.e. decrease in PSA levels of >= 50%)) Show forest plot | 1 | 48 | Risk Ratio (M‐H, Random, 95% CI) | 0.07 [0.00, 1.13] |
| 3.2 Adverse effects other than cardiac damage Show forest plot | 1 | Risk Ratio (M‐H, Random, 95% CI) | Subtotals only | |
| 3.2.1 Gastrointestinal toxicity grade 3 or 4 | 1 | 48 | Risk Ratio (M‐H, Random, 95% CI) | 0.17 [0.01, 3.08] |
| 3.2.2 Tachycardia grade 3 or 4 | 1 | 48 | Risk Ratio (M‐H, Random, 95% CI) | 0.06 [0.00, 1.00] |
| 3.2.3 Arrhythmia grade 3 or 4 | 1 | 48 | Risk Ratio (M‐H, Random, 95% CI) | 0.39 [0.04, 3.52] |
| 3.2.4 Dyspnoea grade 3 or 4 | 1 | 48 | Risk Ratio (M‐H, Random, 95% CI) | 0.47 [0.10, 2.20] |
| 3.2.5 Palmar‐plantar erythrodysesthesia grade 3 or 4 | 1 | 48 | Risk Ratio (M‐H, Random, 95% CI) | 5.91 [1.45, 24.16] |
| 3.2.6 Hepatic toxicity grade 3 or 4 | 1 | 48 | Risk Ratio (M‐H, Random, 95% CI) | 0.20 [0.05, 0.79] |
| 3.2.7 Leukopenia grade 3 or 4 | 1 | 48 | Risk Ratio (M‐H, Random, 95% CI) | 0.24 [0.03, 1.87] |
| 3.2.8 Thrombocytopenia grade 3 or 4 | 1 | 48 | Risk Ratio (M‐H, Random, 95% CI) | 0.39 [0.02, 9.15] |
| 3.2.9 Haemoglobin‐related toxicity grade 3 or 4 | 1 | 48 | Risk Ratio (M‐H, Random, 95% CI) | 0.07 [0.00, 1.13] |
| Outcome or subgroup title | No. of studies | No. of participants | Statistical method | Effect size |
| 4.1 Clinical heart failure Show forest plot | 1 | 1086 | Risk Ratio (M‐H, Random, 95% CI) | 0.97 [0.06, 15.48] |
| 4.2 Adverse effects other than cardiac damage Show forest plot | 1 | Risk Ratio (M‐H, Random, 95% CI) | Subtotals only | |
| 4.2.1 Anaemia grade 3 or 4 | 1 | 1086 | Risk Ratio (M‐H, Random, 95% CI) | 2.91 [0.79, 10.70] |
| 4.2.2 Leukopenia grade 3 or 4 | 1 | 1086 | Risk Ratio (M‐H, Random, 95% CI) | 1.06 [0.75, 1.49] |
| 4.2.3 Neutropenia grade 3 or 4 | 1 | 1086 | Risk Ratio (M‐H, Random, 95% CI) | 1.05 [0.84, 1.31] |
| 4.2.4 Febrile neutropenia grade 3 or 4 | 1 | 1086 | Risk Ratio (M‐H, Random, 95% CI) | 0.78 [0.47, 1.31] |
| 4.2.5 Thrombocytopenia grade 3 or 4 | 1 | 1086 | Risk Ratio (M‐H, Random, 95% CI) | 12.62 [0.71, 223.52] |
| 4.2.6 Nausea/vomiting grade 3 or 4 | 1 | 1086 | Risk Ratio (M‐H, Random, 95% CI) | 0.91 [0.45, 1.82] |
| 4.2.7 Fatigue grade 3 or 4 | 1 | 1086 | Risk Ratio (M‐H, Random, 95% CI) | 0.32 [0.07, 1.60] |
| 4.2.8 Infection grade 3 or 4 | 1 | 1086 | Risk Ratio (M‐H, Random, 95% CI) | 0.79 [0.48, 1.31] |
| 4.2.9 Central nervous system grade 3 or 4 | 1 | 1086 | Risk Ratio (M‐H, Random, 95% CI) | 2.91 [0.12, 71.35] |
| 4.2.10 Pulmonary grade 3 or 4 | 1 | 1086 | Risk Ratio (M‐H, Random, 95% CI) | 2.91 [0.12, 71.35] |
| 4.2.11 Peripheral neuropathy grade 3 or 4 | 1 | 1086 | Risk Ratio (M‐H, Random, 95% CI) | 4.50 [2.37, 8.54] |
| 4.2.12 Hepatotoxicity grade 3 or 4 | 1 | 1086 | Risk Ratio (M‐H, Random, 95% CI) | 1.70 [0.50, 5.77] |
| 4.2.13 Hypersensitivity reactions grade 3 or 4 | 1 | 1086 | Risk Ratio (M‐H, Random, 95% CI) | 3.88 [1.71, 8.82] |
| 4.2.14 Mucositis grade 3 or 4 | 1 | 1086 | Risk Ratio (M‐H, Random, 95% CI) | 1.05 [0.48, 2.28] |
| 4.2.15 Pain grade 3 or 4 | 1 | 1086 | Risk Ratio (M‐H, Random, 95% CI) | 0.32 [0.01, 7.93] |
| 4.2.16 Arthralgias/myalgias grade 3 or 4 | 1 | 1086 | Risk Ratio (M‐H, Random, 95% CI) | 3.88 [1.31, 11.54] |
| 4.2.17 Treatment‐related death | 1 | 1086 | Risk Ratio (M‐H, Random, 95% CI) | 2.91 [0.12, 71.35] |