Scolaris Content Display Scolaris Content Display

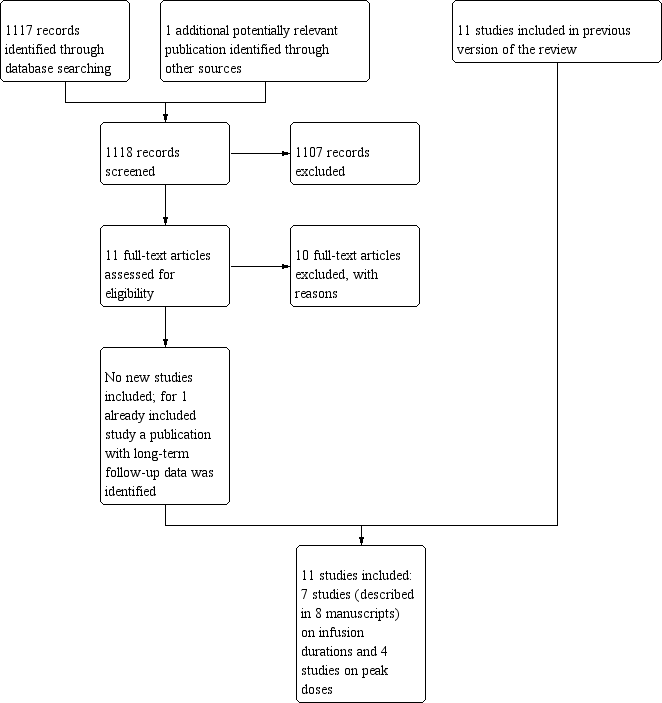
Study flow diagram.

Figuras y tablas -
Figure 1

Study flow diagram.

Risk of bias summary: review authors' judgements about each risk of bias item for each included study.

Figuras y tablas -
Figure 2

Risk of bias summary: review authors' judgements about each risk of bias item for each included study.

Comparison 1: Infusion duration less than 6 hours versus infusion duration 6 hours or more, Outcome 1: Clinical heart failure

Figuras y tablas -
Analysis 1.1

Comparison 1: Infusion duration less than 6 hours versus infusion duration 6 hours or more, Outcome 1: Clinical heart failure

Comparison 1: Infusion duration less than 6 hours versus infusion duration 6 hours or more, Outcome 2: (Sub)clinical heart failure combined

Figuras y tablas -
Analysis 1.2

Comparison 1: Infusion duration less than 6 hours versus infusion duration 6 hours or more, Outcome 2: (Sub)clinical heart failure combined

Comparison 1: Infusion duration less than 6 hours versus infusion duration 6 hours or more, Outcome 3: Response rate

Figuras y tablas -
Analysis 1.3

Comparison 1: Infusion duration less than 6 hours versus infusion duration 6 hours or more, Outcome 3: Response rate

Comparison 1: Infusion duration less than 6 hours versus infusion duration 6 hours or more, Outcome 4: Overall survival

Figuras y tablas -
Analysis 1.4

Comparison 1: Infusion duration less than 6 hours versus infusion duration 6 hours or more, Outcome 4: Overall survival

Comparison 2: Doxorubicin peak dose less than 60 mg/m2 versus 60 mg/m2 or more, Outcome 1: Clinical heart failure

Figuras y tablas -
Analysis 2.1

Comparison 2: Doxorubicin peak dose less than 60 mg/m2 versus 60 mg/m2 or more, Outcome 1: Clinical heart failure

Comparison 2: Doxorubicin peak dose less than 60 mg/m2 versus 60 mg/m2 or more, Outcome 2: Overall survival

Figuras y tablas -
Analysis 2.2

Comparison 2: Doxorubicin peak dose less than 60 mg/m2 versus 60 mg/m2 or more, Outcome 2: Overall survival

Comparison 2: Doxorubicin peak dose less than 60 mg/m2 versus 60 mg/m2 or more, Outcome 3: Adverse effects other than cardiac damage

Figuras y tablas -
Analysis 2.3

Comparison 2: Doxorubicin peak dose less than 60 mg/m2 versus 60 mg/m2 or more, Outcome 3: Adverse effects other than cardiac damage

Comparison 3: Liposomal doxorubicin (Caelyx) peak dose 25 mg/m2 versus 50 mg/m2, Outcome 1: Response rate (defined as objective palliative tumour response (i.e. decrease in PSA levels of >= 50%))

Figuras y tablas -
Analysis 3.1

Comparison 3: Liposomal doxorubicin (Caelyx) peak dose 25 mg/m2 versus 50 mg/m2, Outcome 1: Response rate (defined as objective palliative tumour response (i.e. decrease in PSA levels of >= 50%))

Comparison 3: Liposomal doxorubicin (Caelyx) peak dose 25 mg/m2 versus 50 mg/m2, Outcome 2: Adverse effects other than cardiac damage

Figuras y tablas -
Analysis 3.2

Comparison 3: Liposomal doxorubicin (Caelyx) peak dose 25 mg/m2 versus 50 mg/m2, Outcome 2: Adverse effects other than cardiac damage

Comparison 4: Epirubicin peak dose 110 mg/m2 versus 83 mg/m2, Outcome 1: Clinical heart failure

Figuras y tablas -
Analysis 4.1

Comparison 4: Epirubicin peak dose 110 mg/m2 versus 83 mg/m2, Outcome 1: Clinical heart failure

Comparison 4: Epirubicin peak dose 110 mg/m2 versus 83 mg/m2, Outcome 2: Adverse effects other than cardiac damage

Figuras y tablas -
Analysis 4.2

Comparison 4: Epirubicin peak dose 110 mg/m2 versus 83 mg/m2, Outcome 2: Adverse effects other than cardiac damage

Comparison 1. Infusion duration less than 6 hours versus infusion duration 6 hours or more

Outcome or subgroup title

No. of studies

No. of participants

Statistical method

Effect size

1.1 Clinical heart failure Show forest plot

5

557

Risk Ratio (M‐H, Random, 95% CI)

0.27 [0.09, 0.81]

1.2 (Sub)clinical heart failure combined Show forest plot

4

Risk Ratio (M‐H, Random, 95% CI)

Subtotals only

1.2.1 (Sub)clinical heart failure combined (subclinical defined as >=10% decrease in LVEF)

1

82

Risk Ratio (M‐H, Random, 95% CI)

0.76 [0.46, 1.26]

1.2.2 (Sub)clinical heart failure combined (subclinical defined as >=15% decrease in LVEF)

1

52

Risk Ratio (M‐H, Random, 95% CI)

0.31 [0.03, 2.78]

1.2.3 (Sub)clinical heart failure combined (subclinical defined as a fall in LVEF of > 20%)

1

62

Risk Ratio (M‐H, Random, 95% CI)

0.04 [0.00, 0.60]

1.2.4 (Sub)clinical heart failure combined (subclinical defined as a decrease in LVEF)

1

240

Risk Ratio (M‐H, Random, 95% CI)

0.36 [0.15, 0.90]

1.3 Response rate Show forest plot

3

Risk Ratio (M‐H, Random, 95% CI)

Subtotals only

1.3.1 Response rate (defined as complete or partial remission)

2

292

Risk Ratio (M‐H, Random, 95% CI)

1.20 [0.65, 2.22]

1.3.2 Response rate (defined as good response)

1

178

Risk Ratio (M‐H, Random, 95% CI)

1.23 [0.91, 1.66]

1.4 Overall survival Show forest plot

2

322

Hazard Ratio (IV, Random, 95% CI)

1.42 [0.61, 3.30]

Figuras y tablas -
Comparison 1. Infusion duration less than 6 hours versus infusion duration 6 hours or more
Comparison 2. Doxorubicin peak dose less than 60 mg/m2 versus 60 mg/m2 or more

Outcome or subgroup title

No. of studies

No. of participants

Statistical method

Effect size

2.1 Clinical heart failure Show forest plot

2

4146

Risk Ratio (M‐H, Random, 95% CI)

0.65 [0.23, 1.88]

2.2 Overall survival Show forest plot

2

4146

Hazard Ratio (IV, Random, 95% CI)

1.06 [0.93, 1.22]

2.3 Adverse effects other than cardiac damage Show forest plot

2

Risk Ratio (M‐H, Random, 95% CI)

Subtotals only

2.3.1 Treatment‐related death

1

3114

Risk Ratio (M‐H, Random, 95% CI)

0.19 [0.01, 3.99]

2.3.2 Death attributable to chemotherapy

1

1032

Risk Ratio (M‐H, Random, 95% CI)

0.34 [0.01, 8.26]

2.3.3 Leukopenia grade 4

1

3114

Risk Ratio (M‐H, Random, 95% CI)

0.58 [0.53, 0.64]

2.3.4 Leukopenia grade 3 or 4

1

1032

Risk Ratio (M‐H, Random, 95% CI)

0.26 [0.21, 0.31]

2.3.5 Granulocytopenia grade 4

1

3114

Risk Ratio (M‐H, Random, 95% CI)

0.67 [0.61, 0.73]

2.3.6 Thrombocytopenia grade 4

1

3114

Risk Ratio (M‐H, Random, 95% CI)

0.45 [0.34, 0.59]

2.3.7 Diarrhoea grade 3 or 4

1

3114

Risk Ratio (M‐H, Random, 95% CI)

0.34 [0.19, 0.60]

2.3.8 Dyspnoea grade 3 or 4

1

3114

Risk Ratio (M‐H, Random, 95% CI)

0.51 [0.28, 0.93]

2.3.9 Infection grade 3 or 4

1

3114

Risk Ratio (M‐H, Random, 95% CI)

0.61 [0.42, 0.86]

2.3.10 Malaise/fatigue/lethargy grade 3 or 4

1

3114

Risk Ratio (M‐H, Random, 95% CI)

0.66 [0.49, 0.91]

2.3.11 Nausea grade 3 or 4

1

3114

Risk Ratio (M‐H, Random, 95% CI)

1.19 [0.98, 1.44]

2.3.12 Stomatitis grade 3 or 4

1

3114

Risk Ratio (M‐H, Random, 95% CI)

0.40 [0.27, 0.61]

2.3.13 Vomiting grade 3 or 4

1

3114

Risk Ratio (M‐H, Random, 95% CI)

1.31 [1.07, 1.59]

Figuras y tablas -
Comparison 2. Doxorubicin peak dose less than 60 mg/m2 versus 60 mg/m2 or more
Comparison 3. Liposomal doxorubicin (Caelyx) peak dose 25 mg/m2 versus 50 mg/m2

Outcome or subgroup title

No. of studies

No. of participants

Statistical method

Effect size

3.1 Response rate (defined as objective palliative tumour response (i.e. decrease in PSA levels of >= 50%)) Show forest plot

1

48

Risk Ratio (M‐H, Random, 95% CI)

0.07 [0.00, 1.13]

3.2 Adverse effects other than cardiac damage Show forest plot

1

Risk Ratio (M‐H, Random, 95% CI)

Subtotals only

3.2.1 Gastrointestinal toxicity grade 3 or 4

1

48

Risk Ratio (M‐H, Random, 95% CI)

0.17 [0.01, 3.08]

3.2.2 Tachycardia grade 3 or 4

1

48

Risk Ratio (M‐H, Random, 95% CI)

0.06 [0.00, 1.00]

3.2.3 Arrhythmia grade 3 or 4

1

48

Risk Ratio (M‐H, Random, 95% CI)

0.39 [0.04, 3.52]

3.2.4 Dyspnoea grade 3 or 4

1

48

Risk Ratio (M‐H, Random, 95% CI)

0.47 [0.10, 2.20]

3.2.5 Palmar‐plantar erythrodysesthesia grade 3 or 4

1

48

Risk Ratio (M‐H, Random, 95% CI)

5.91 [1.45, 24.16]

3.2.6 Hepatic toxicity grade 3 or 4

1

48

Risk Ratio (M‐H, Random, 95% CI)

0.20 [0.05, 0.79]

3.2.7 Leukopenia grade 3 or 4

1

48

Risk Ratio (M‐H, Random, 95% CI)

0.24 [0.03, 1.87]

3.2.8 Thrombocytopenia grade 3 or 4

1

48

Risk Ratio (M‐H, Random, 95% CI)

0.39 [0.02, 9.15]

3.2.9 Haemoglobin‐related toxicity grade 3 or 4

1

48

Risk Ratio (M‐H, Random, 95% CI)

0.07 [0.00, 1.13]

Figuras y tablas -
Comparison 3. Liposomal doxorubicin (Caelyx) peak dose 25 mg/m2 versus 50 mg/m2
Comparison 4. Epirubicin peak dose 110 mg/m2 versus 83 mg/m2

Outcome or subgroup title

No. of studies

No. of participants

Statistical method

Effect size

4.1 Clinical heart failure Show forest plot

1

1086

Risk Ratio (M‐H, Random, 95% CI)

0.97 [0.06, 15.48]

4.2 Adverse effects other than cardiac damage Show forest plot

1

Risk Ratio (M‐H, Random, 95% CI)

Subtotals only

4.2.1 Anaemia grade 3 or 4

1

1086

Risk Ratio (M‐H, Random, 95% CI)

2.91 [0.79, 10.70]

4.2.2 Leukopenia grade 3 or 4

1

1086

Risk Ratio (M‐H, Random, 95% CI)

1.06 [0.75, 1.49]

4.2.3 Neutropenia grade 3 or 4

1

1086

Risk Ratio (M‐H, Random, 95% CI)

1.05 [0.84, 1.31]

4.2.4 Febrile neutropenia grade 3 or 4

1

1086

Risk Ratio (M‐H, Random, 95% CI)

0.78 [0.47, 1.31]

4.2.5 Thrombocytopenia grade 3 or 4

1

1086

Risk Ratio (M‐H, Random, 95% CI)

12.62 [0.71, 223.52]

4.2.6 Nausea/vomiting grade 3 or 4

1

1086

Risk Ratio (M‐H, Random, 95% CI)

0.91 [0.45, 1.82]

4.2.7 Fatigue grade 3 or 4

1

1086

Risk Ratio (M‐H, Random, 95% CI)

0.32 [0.07, 1.60]

4.2.8 Infection grade 3 or 4

1

1086

Risk Ratio (M‐H, Random, 95% CI)

0.79 [0.48, 1.31]

4.2.9 Central nervous system grade 3 or 4

1

1086

Risk Ratio (M‐H, Random, 95% CI)

2.91 [0.12, 71.35]

4.2.10 Pulmonary grade 3 or 4

1

1086

Risk Ratio (M‐H, Random, 95% CI)

2.91 [0.12, 71.35]

4.2.11 Peripheral neuropathy grade 3 or 4

1

1086

Risk Ratio (M‐H, Random, 95% CI)

4.50 [2.37, 8.54]

4.2.12 Hepatotoxicity grade 3 or 4

1

1086

Risk Ratio (M‐H, Random, 95% CI)

1.70 [0.50, 5.77]

4.2.13 Hypersensitivity reactions grade 3 or 4

1

1086

Risk Ratio (M‐H, Random, 95% CI)

3.88 [1.71, 8.82]

4.2.14 Mucositis grade 3 or 4

1

1086

Risk Ratio (M‐H, Random, 95% CI)

1.05 [0.48, 2.28]

4.2.15 Pain grade 3 or 4

1

1086

Risk Ratio (M‐H, Random, 95% CI)

0.32 [0.01, 7.93]

4.2.16 Arthralgias/myalgias grade 3 or 4

1

1086

Risk Ratio (M‐H, Random, 95% CI)

3.88 [1.31, 11.54]

4.2.17 Treatment‐related death

1

1086

Risk Ratio (M‐H, Random, 95% CI)

2.91 [0.12, 71.35]

Figuras y tablas -
Comparison 4. Epirubicin peak dose 110 mg/m2 versus 83 mg/m2