Ejercicios para mujeres que reciben tratamiento adyuvante para el cáncer de mama
Appendices
Appendix 1. CENTRAL
#1 MeSH descriptor: [Breast Neoplasms] explode all trees
#2 breast near cancer
#3 breast near neoplasm*
#4 breast near carcinoma*
#5 breast near tumour*
#6 breast near tumor*
#7 #1 or #2 or #3 or #4 or #5 or #6
#8 MeSH descriptor: [Exercise] explode all trees
#9 MeSH descriptor: [Exercise Movement Techniques] explode all trees
#10 MeSH descriptor: [Physical Education and Training] explode all trees
#11 MeSH descriptor: [Exercise Therapy] explode all trees
#12 MeSH descriptor: [Physical Fitness] explode all trees
#13 exercise or exercise movement technique or exercise therapy or physical education or physical fitness or weight or training or strengthening endurance
#14 #8 or #9 or #10 or #11 or #12 or #13
#15 #7 and #14
Appendix 2. MEDLINE search strategy (via OvidSP)
| Searches | |
| 1 | randomized controlled trial.pt. |
| 2 | controlled clinical trial.pt. |
| 3 | randomized.ab. |
| 4 | placebo.ab. |
| 5 | Clinical Trials as Topic/ |
| 6 | randomly.ab. |
| 7 | trial.ti. |
| 8 | (crossover or cross‐over).tw. |
| 9 | Pragmatic Clinical Trials as Topic/ |
| 10 | pragmatic clinical trial.pt. |
| 11 | or/1‐10 |
| 12 | exp Breast Neoplasms/ |
| 13 | (breast adj6 cancer$).mp. |
| 14 | (breast adj6 neoplasm$).mp. |
| 15 | (breast adj6 carcinoma$).mp. |
| 16 | (breast adj6 tumour$).mp. |
| 17 | (breast adj6 tumor$).mp. |
| 18 | 12 or 13 or 14 or 15 or 16 or 17 |
| 19 | exp Exercise/ |
| 20 | exp Exercise Movement Techniques/ |
| 21 | exp Exercise Therapy/ |
| 22 | exercise.mp. |
| 23 | exp "Physical Education and Training"/ |
| 24 | physical‐education‐and‐training.mp. |
| 25 | exp Physical Fitness/ |
| 26 | physical fitness.mp. |
| 27 | Physical Exertion/ |
| 28 | exertion.mp. |
| 29 | exp Sports/ |
| 30 | sport$.mp. |
| 31 | physical activity.mp. |
| 32 | physical activities.mp. |
| 33 | exp Walking/ |
| 34 | walking.ti,ab. |
| 35 | exp Jogging/ |
| 36 | jogging.ti,ab. |
| 37 | exp Swimming/ |
| 38 | swimming.ti,ab. |
| 39 | exp Bicycling/ |
| 40 | bicycling.ti,ab. |
| 41 | cycling.ti,ab. |
| 42 | weight.ti,ab. |
| 43 | training.ti,ab. |
| 44 | muscle.ti,ab. |
| 45 | strengthening.ti,ab. |
| 46 | endurance.ti,ab. |
| 47 | 19 or 20 or 21 or 22 or 23 or 24 or 25 or 26 or 27 or 28 or 29 or 30 or 31 or 32 or 33 or 34 or 35 or 36 or 37 or 38 or 39 or 40 or 41 or 42 or 43 or 44 or 45 or 46 |
| 48 | adjuvant therapy.mp. |
| 49 | chemotherapy.mp. or exp Drug Therapy/ |
| 50 | radiotherapy.mp. or exp Radiotherapy/ |
| 51 | hormonal therapy.mp. |
| 52 | 48 or 49 or 50 or 51 |
| 53 | 11 and 18 and 47 and 52 |
| 54 | Animals/ not Humans/ |
| 55 | 53 not 54 |
Appendix 3. EMBASE search strategy (via Embase.com)
-
'breast cancer'/exp OR 'breast cancer'
-
'breast carcinoma'/exp
-
'breast neoplasm'
-
'breast tumour'
-
'breast tumor'/exp
-
#1 OR #2 OR #3 OR #4 OR #5
-
'exercise'/exp
-
exercise*
-
'exercise movement techniques'/exp OR 'exercise movement techniques'
-
'physical education training'
-
'physical education'/exp OR 'physical education'
-
'physical training'/exp OR 'physical training'
-
'physical fitness'/exp OR 'physical fitness'
-
'exercise therapy'/exp OR 'exercise therapy'
-
'exertion'/exp OR exertion
-
'sports'/exp OR sports
-
'walking'/exp OR walking
-
'jogging'/exp OR jogging
-
'swimming'/exp OR swimming
-
'cycling'/exp OR cycling
-
'bicycling'/exp OR bicycling
-
'endurance'/exp OR endurance
-
'weight'/exp OR weight
-
'training'/exp OR training
-
'muscle'/exp OR muscle
-
strengthening
-
'endurance'/exp OR endurance
-
#7 OR #8 OR #9 OR #10 OR #11 OR #12 OR #13 OR #14 OR #15 OR #16 OR #17 OR #18 OR #19 OR #20 OR #21 OR #22 OR #23 OR #24 OR#25 OR #26 OR #27
-
'adjuvant therapy'/exp OR 'adjuvant therapy'
-
'chemotherapy'/exp OR chemotherapy
-
'radiotherapy'/exp OR radiotherapy
-
hormonal AND ('therapy'/exp OR therapy)
-
#29 OR #30 OR #31 OR #32
-
random* OR factorial* OR crossover* OR cross NEXT/1 over* OR placebo* OR (doubl* AND blind*) OR (singl* AND blind*) OR assign*OR allocat* OR volunteer* OR 'crossover procedure'/exp OR 'double blind procedure'/exp OR 'randomized controlled trial'/exp OR'single blind procedure'/exp
-
#6 AND #28 AND #33 AND #34
-
#35 NOT ([animals]/lim NOT [humans]/lim)
-
#36 AND [embase]/lim
Appendix 4. WHO ICTRP search strategies
Basic Searches:
1. Exercise for women receiving adjuvant therapy for breast cancer
2. Breast cancer AND exercise
Advanced Searches:
1. Title: Exercise for women receiving adjuvant therapy for breast cancer
Recruitment Status: ALL
2. Condition: breast cancer
Intervention: exercise
Recruitment Status: ALL
3. Condition: breast cancer
Intervention: exercise% OR exercise therap% OR physical education
Recruitment Status: ALL
Appendix 5. ClinicalTrials.gov search strategies
Basic Searches:
1. Exercise for women receiving adjuvant therapy for breast cancer
2. Breast cancer AND exercise
Advanced Searches:
1. Title: Exercise for women receiving adjuvant therapy for breast cancer
Recruitment: All studies
Study Results: All studies
Study Type: All studies
Gender: All Studies
2. Condition: breast cancer
Intervention: exercise OR exercises OR exercise therapy OR exercise therapies OR exercise movement technique OR exercise movement techniques OR physical education OR physical training OR physical fitness OR physical activity OR physical activities
Recruitment: All studies
Study Results: All studies
Study Type: All studies
Gender: All Studies
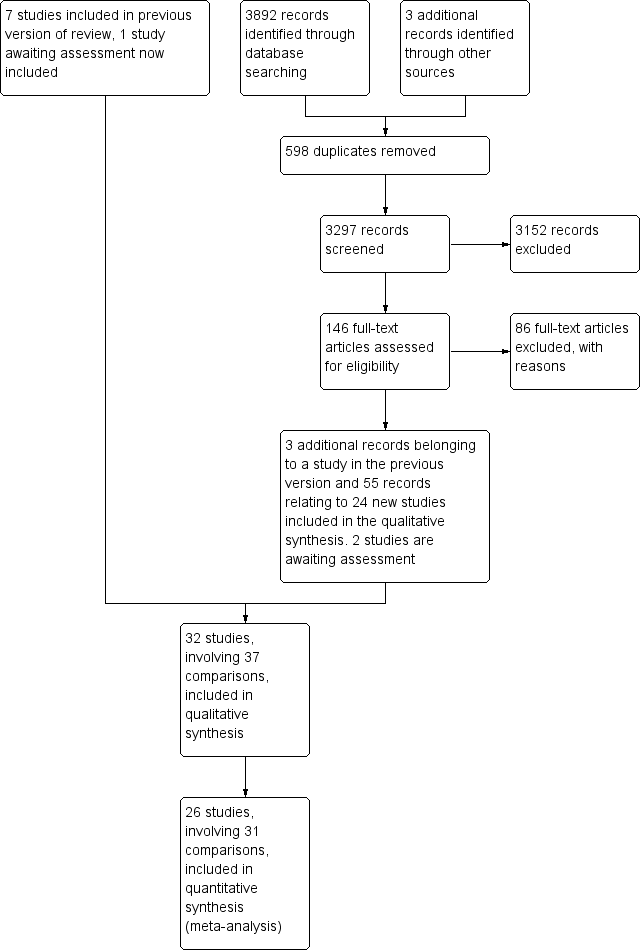
Study flow diagram.

Risk of bias summary: review authors' judgements about each risk of bias item for each included study.
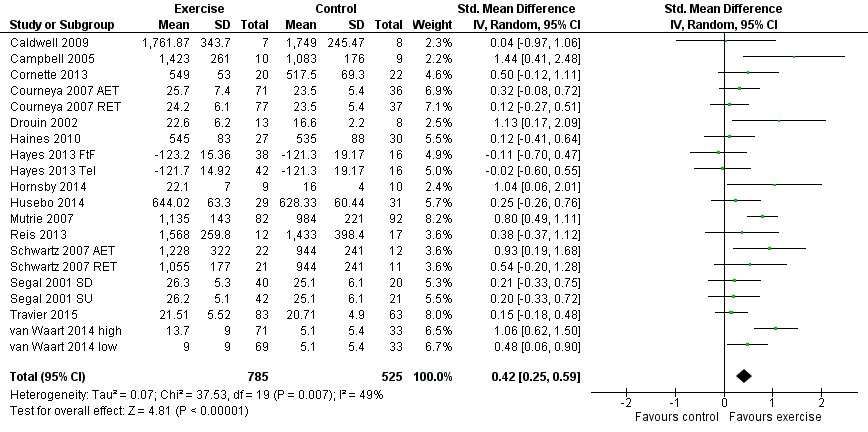
Forest plot of comparison: 1 Exercise versus control, outcome: 1.1 Physical fitness.

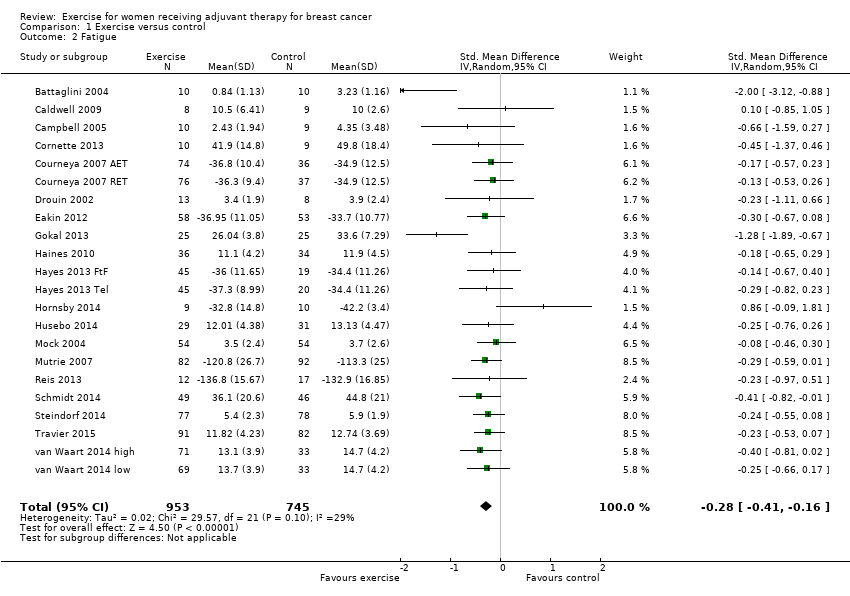
Forest plot of comparison: 1 Exercise versus control, outcome: 1.2 Fatigue.

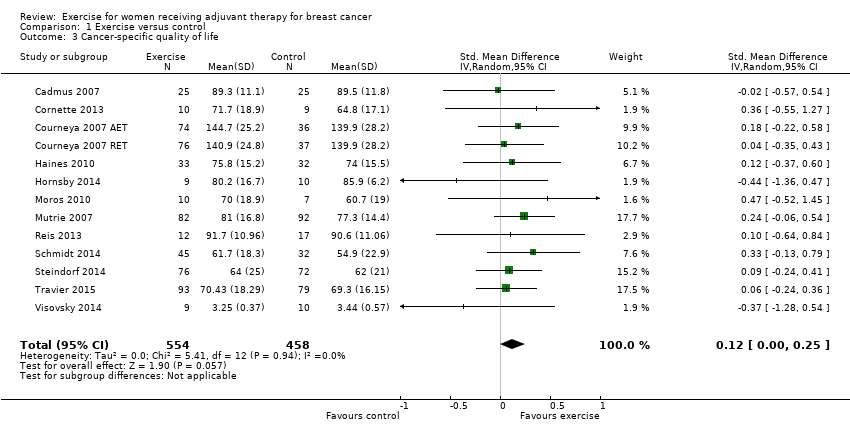
Forest plot of comparison: 1 Exercise versus control, outcome: 1.3 Cancer‐specific quality of life.

Forest plot of comparison: 1 Exercise versus control, outcome: 1.6 Depression.

Comparison 1 Exercise versus control, Outcome 1 Physical fitness.
Comparison 1 Exercise versus control, Outcome 2 Fatigue.
Comparison 1 Exercise versus control, Outcome 3 Cancer‐specific quality of life.
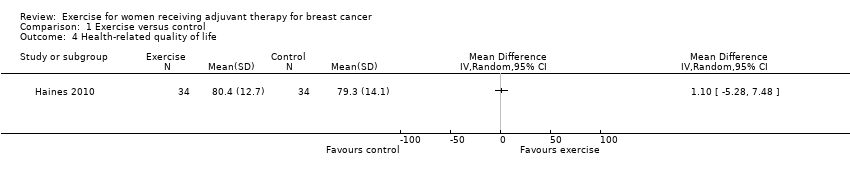
Comparison 1 Exercise versus control, Outcome 4 Health‐related quality of life.

Comparison 1 Exercise versus control, Outcome 5 Cancer site‐specific quality of life.

Comparison 1 Exercise versus control, Outcome 6 Depression.

Comparison 1 Exercise versus control, Outcome 7 Cognitive function.

Comparison 1 Exercise versus control, Outcome 8 Strength.
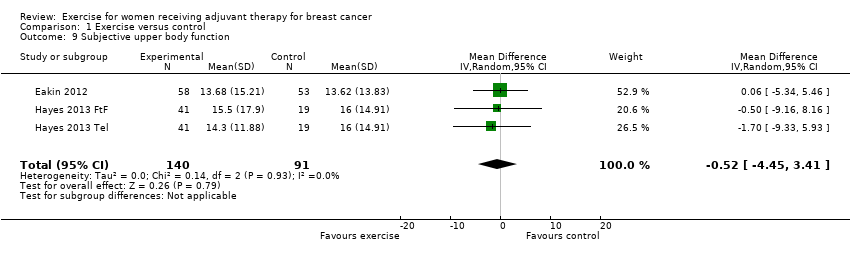
Comparison 1 Exercise versus control, Outcome 9 Subjective upper body function.

Comparison 1 Exercise versus control, Outcome 10 Shoulder mobility.

Comparison 1 Exercise versus control, Outcome 11 Arm morbidity.

Comparison 1 Exercise versus control, Outcome 12 Anxiety.

Comparison 1 Exercise versus control, Outcome 13 Mood disturbances.
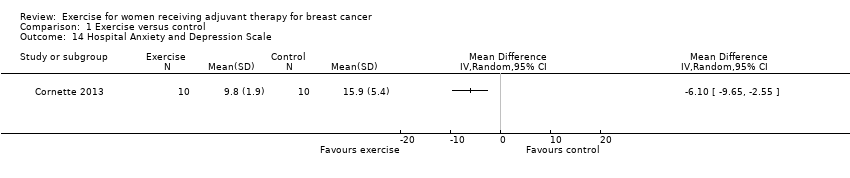
Comparison 1 Exercise versus control, Outcome 14 Hospital Anxiety and Depression Scale.
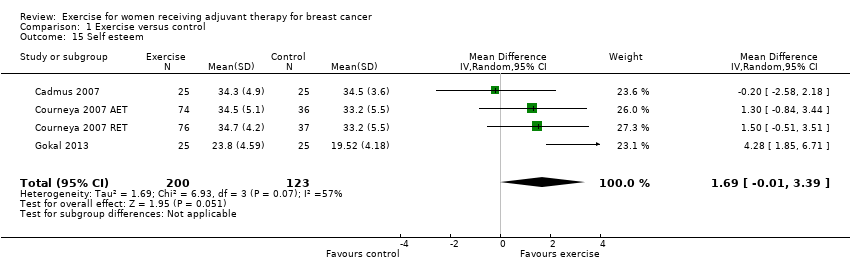
Comparison 1 Exercise versus control, Outcome 15 Self esteem.

Comparison 1 Exercise versus control, Outcome 16 Physical activity.

Comparison 1 Exercise versus control, Outcome 17 Neuropathic pain.

Comparison 1 Exercise versus control, Outcome 18 Neuropathy symptoms.
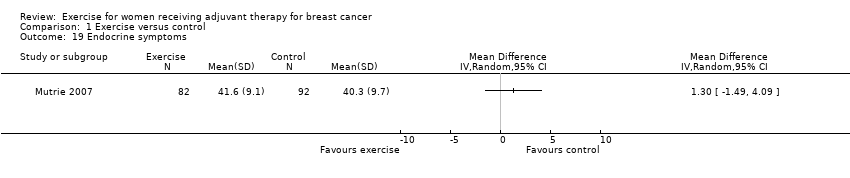
Comparison 1 Exercise versus control, Outcome 19 Endocrine symptoms.

Comparison 1 Exercise versus control, Outcome 20 Gait and balance.
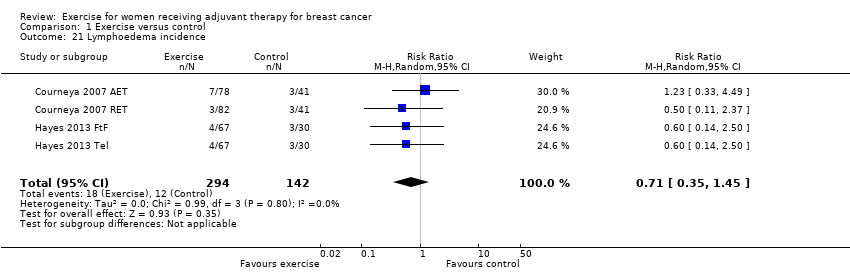
Comparison 1 Exercise versus control, Outcome 21 Lymphoedema incidence.

Comparison 2 Exercise versus control follow‐up, Outcome 1 Physical fitness.
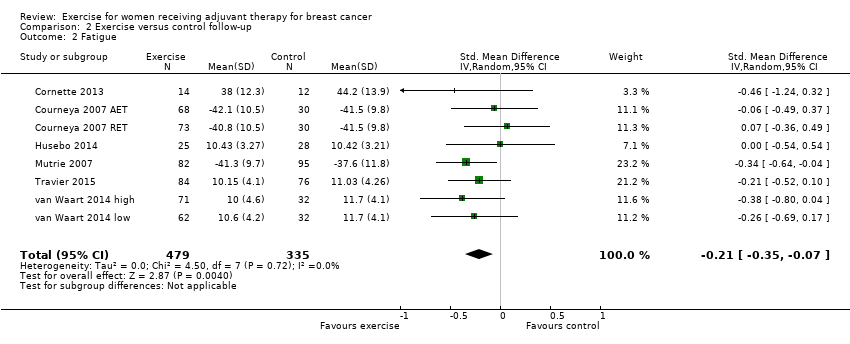
Comparison 2 Exercise versus control follow‐up, Outcome 2 Fatigue.

Comparison 2 Exercise versus control follow‐up, Outcome 3 Cancer‐specific quality of life.
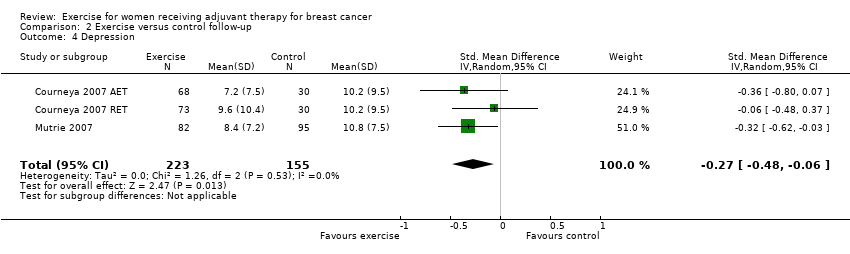
Comparison 2 Exercise versus control follow‐up, Outcome 4 Depression.
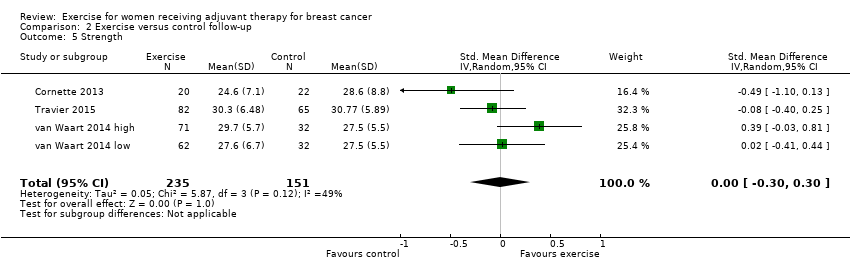
Comparison 2 Exercise versus control follow‐up, Outcome 5 Strength.
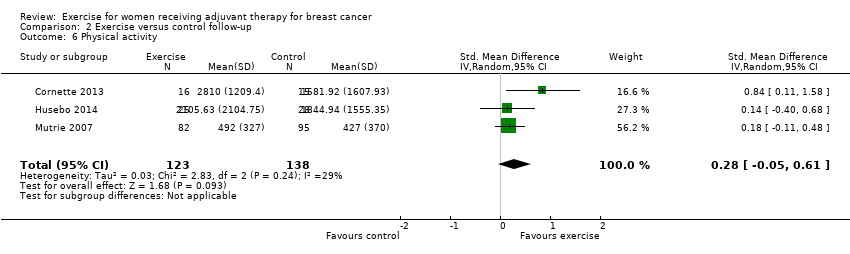
Comparison 2 Exercise versus control follow‐up, Outcome 6 Physical activity.

Comparison 2 Exercise versus control follow‐up, Outcome 7 Anxiety.

Comparison 2 Exercise versus control follow‐up, Outcome 8 Self esteem.

Comparison 2 Exercise versus control follow‐up, Outcome 9 Endocrine symptoms.

Comparison 2 Exercise versus control follow‐up, Outcome 10 Neuropathy symptoms.
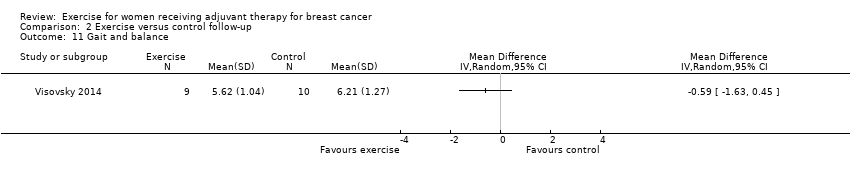
Comparison 2 Exercise versus control follow‐up, Outcome 11 Gait and balance.
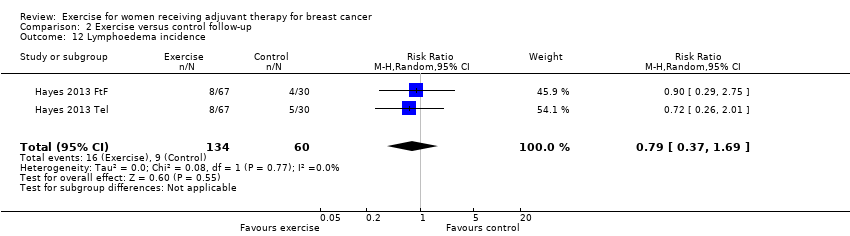
Comparison 2 Exercise versus control follow‐up, Outcome 12 Lymphoedema incidence.
| Exercise compared with control for women receiving adjuvant therapy for breast cancer | ||||
| Population: women receiving adjuvant therapy (chemo‐ or radiotherapy or both) for breast cancer Settings: supervised or home based Intervention: aerobic or resistance exercise or a combination of both Comparison: control intervention (usual care or intervention that was not exercise, such as stretching) | ||||
| Outcomes | Relative effects* (95% CI) | No of Participants | Quality of the evidence | Comments |
| Exercise vs control | ||||
| Physical fitness assessed with: 6‐ or 12‐minute walk test, peak oxygen uptake, and other scales (follow‐up: 18 weeks to 6 months) | The mean physical fitness in the intervention group was 0.42 standard deviations higher (0.25 to 0.59 higher) | 1310 (15 RCTs) | ⊕⊕⊕⊝ | SMD 0.42 (95% CI 0.25 to 0.59) |
| Fatigue assessed with: FACIT‐F scale, (revised) Piper Fatigue Scale, Multidimensional Fatigue Inventory and other scales (follow‐up: 18 weeks to 6 months) | The mean fatigue in the intervention group was 0.28 standard deviations lower (0.41 lower to 0.16 lower) | 1698 (19 RCTs) | ⊕⊕⊕⊝ | SMD ‐0.28 (95% CI ‐0.41 to ‐0.16) |
| Cancer‐specific quality of life assessed with: FACT‐G, EORTC QLQ‐C30 and other scales (follow‐up: 12 weeks to 6 months) | The mean cancer‐specific quality of life in the intervention group was 0.12 standard deviations higher (0.00 to 0.25 higher) | 1012 (12 RCTs) | ⊕⊕⊕⊝ | SMD 0.12 (95% CI 0.00 to 0.25) |
| Health‐related quality of life assessed with EQ‐5D visual analogue scale (higher scores indicate higher quality of life, score range from 0 to 100) MID: 7 points (follow‐up: end of intervention) | The mean health‐related quality of life in the intervention group was 1.10 points higher (5.28 lower to 7.48 higher) | 68 (1 RCT) | ⊕⊕⊝⊝ | MD 1.10 (95% CI ‐5.28 to 7.48) |
| Cancer site‐specific quality of life assessed with: FACT‐B (higher scores indicate better quality of life, score range from 0 to 144) MID: 7 to 8 points (follow‐up: end of intervention) | The mean cancer site‐specific quality of life in the intervention group was 4.24 points higher (1.81 lower to 10.29 points higher) | 262 (4 RCTs) | ⊕⊕⊝⊝ | MD 4.24 (95% CI ‐1.81 to 10.29) |
| Depression assessed with: BDI, CES‐D (follow‐up: 6 months) | The mean depression in the intervention group was 0.15 standard deviations lower (0.30 lower to 0.01 higher) | 674 (5 RCTs) | ⊕⊕⊕⊝ | SMD ‐0.15 (95% CI ‐0.30 to 0.01) |
| Cognitive function assessed with: Trail Making Test (less time in seconds needed for completing the test means less cognitive dysfunction) (follow‐up: end of intervention) | The mean time needed for completing the test in the intervention group was 11.55 seconds less (22.06 seconds less to 1.05 seconds less) | 213 (2 RCTs) | ⊕⊕⊝⊝ | MD ‐11.55 (95% CI ‐22.06 to ‐1.05) |
| Lymphoedema assessed with: volumetric arm measurements and bioimpedance spectroscopy (follow‐up: 8 weeks) | Assumed risk11: 60 per 1000 (30 to 123) | 436 (2 RCTs) | ⊕⊕⊝⊝ | RR 0.71 (95% CI 0.35 to 1.45) |
| *The basis for the assumed risk (e.g. the median control group risk across studies) is provided in footnotes. The corresponding risk (and its 95% confidence interval) is based on the assumed risk in the comparison group and the relative effect of the intervention (and its 95% CI). | ||||
| GRADE Working Group grades of evidence | ||||
| 1Lack of blinding, low adherence and high or unclear contamination, several randomisation and many allocation concealment procedures were unclear, therefore we downgraded by one level. | ||||
| Outcome or subgroup title | No. of studies | No. of participants | Statistical method | Effect size |
| 1 Physical fitness Show forest plot | 20 | 1310 | Std. Mean Difference (IV, Random, 95% CI) | 0.42 [0.25, 0.59] |
| 2 Fatigue Show forest plot | 22 | 1698 | Std. Mean Difference (IV, Random, 95% CI) | ‐0.28 [‐0.41, ‐0.16] |
| 3 Cancer‐specific quality of life Show forest plot | 13 | 1012 | Std. Mean Difference (IV, Random, 95% CI) | 0.12 [‐0.00, 0.25] |
| 4 Health‐related quality of life Show forest plot | 1 | Mean Difference (IV, Random, 95% CI) | Totals not selected | |
| 5 Cancer site‐specific quality of life Show forest plot | 4 | 262 | Mean Difference (IV, Random, 95% CI) | 4.24 [‐1.81, 10.29] |
| 6 Depression Show forest plot | 6 | 674 | Std. Mean Difference (IV, Random, 95% CI) | ‐0.15 [‐0.30, 0.01] |
| 7 Cognitive function Show forest plot | 2 | 213 | Mean Difference (IV, Random, 95% CI) | ‐11.55 [‐22.06, ‐1.05] |
| 8 Strength Show forest plot | 13 | 912 | Std. Mean Difference (IV, Random, 95% CI) | 0.27 [0.04, 0.50] |
| 9 Subjective upper body function Show forest plot | 3 | 231 | Mean Difference (IV, Random, 95% CI) | ‐0.52 [‐4.45, 3.41] |
| 10 Shoulder mobility Show forest plot | 1 | Mean Difference (IV, Random, 95% CI) | Totals not selected | |
| 11 Arm morbidity Show forest plot | 3 | 240 | Mean Difference (IV, Random, 95% CI) | 1.11 [‐4.07, 6.29] |
| 12 Anxiety Show forest plot | 3 | 331 | Mean Difference (IV, Random, 95% CI) | ‐1.45 [‐4.36, 1.46] |
| 13 Mood disturbances Show forest plot | 3 | 111 | Std. Mean Difference (IV, Random, 95% CI) | ‐1.00 [‐1.40, ‐0.60] |
| 14 Hospital Anxiety and Depression Scale Show forest plot | 1 | Mean Difference (IV, Random, 95% CI) | Totals not selected | |
| 15 Self esteem Show forest plot | 4 | 323 | Mean Difference (IV, Random, 95% CI) | 1.69 [‐0.01, 3.39] |
| 16 Physical activity Show forest plot | 8 | 549 | Std. Mean Difference (IV, Random, 95% CI) | 0.29 [0.12, 0.47] |
| 17 Neuropathic pain Show forest plot | 2 | 130 | Mean Difference (IV, Random, 95% CI) | 3.64 [‐1.32, 8.60] |
| 18 Neuropathy symptoms Show forest plot | 1 | Mean Difference (IV, Random, 95% CI) | Totals not selected | |
| 19 Endocrine symptoms Show forest plot | 1 | Mean Difference (IV, Random, 95% CI) | Totals not selected | |
| 20 Gait and balance Show forest plot | 3 | 122 | Std. Mean Difference (IV, Random, 95% CI) | 0.10 [‐0.25, 0.46] |
| 21 Lymphoedema incidence Show forest plot | 4 | 436 | Risk Ratio (M‐H, Random, 95% CI) | 0.71 [0.35, 1.45] |
| Outcome or subgroup title | No. of studies | No. of participants | Statistical method | Effect size |
| 1 Physical fitness Show forest plot | 6 | 612 | Std. Mean Difference (IV, Random, 95% CI) | 0.26 [‐0.06, 0.57] |
| 2 Fatigue Show forest plot | 8 | 814 | Std. Mean Difference (IV, Random, 95% CI) | ‐0.21 [‐0.35, ‐0.07] |
| 3 Cancer‐specific quality of life Show forest plot | 6 | 583 | Std. Mean Difference (IV, Random, 95% CI) | 0.18 [0.01, 0.35] |
| 4 Depression Show forest plot | 3 | 378 | Std. Mean Difference (IV, Random, 95% CI) | ‐0.27 [‐0.48, ‐0.06] |
| 5 Strength Show forest plot | 4 | 386 | Std. Mean Difference (IV, Random, 95% CI) | ‐0.00 [‐0.30, 0.30] |
| 6 Physical activity Show forest plot | 3 | 261 | Std. Mean Difference (IV, Random, 95% CI) | 0.28 [‐0.05, 0.61] |
| 7 Anxiety Show forest plot | 2 | 201 | Mean Difference (IV, Random, 95% CI) | ‐3.61 [‐7.24, 0.03] |
| 8 Self esteem Show forest plot | 2 | 201 | Mean Difference (IV, Random, 95% CI) | 1.20 [‐0.41, 2.81] |
| 9 Endocrine symptoms Show forest plot | 1 | Mean Difference (IV, Random, 95% CI) | Totals not selected | |
| 10 Neuropathy symptoms Show forest plot | 1 | Mean Difference (IV, Random, 95% CI) | Totals not selected | |
| 11 Gait and balance Show forest plot | 1 | Mean Difference (IV, Random, 95% CI) | Totals not selected | |
| 12 Lymphoedema incidence Show forest plot | 2 | 194 | Risk Ratio (M‐H, Random, 95% CI) | 0.79 [0.37, 1.69] |