| 1 Prevalence of stress urinary incontinence within 2 years post surgery Show forest plot | 5 | 955 | Odds Ratio (M‐H, Fixed, 95% CI) | 1.45 [0.85, 2.47] |
|
| 1.1 Abdominal surgery | 4 | 826 | Odds Ratio (M‐H, Fixed, 95% CI) | 1.55 [0.86, 2.78] |
| 1.2 Laparoscopic surgery | 1 | 129 | Odds Ratio (M‐H, Fixed, 95% CI) | 1.05 [0.29, 3.82] |
| 2 Prevalence of stress urinary incontinence >2 years post surgery Show forest plot | 1 | 178 | Odds Ratio (M‐H, Fixed, 95% CI) | 1.15 [0.63, 2.08] |
|
| 2.1 Abdominal surgery | 1 | 178 | Odds Ratio (M‐H, Fixed, 95% CI) | 1.15 [0.63, 2.08] |
| 2.2 Laparoscopic surgery | 0 | 0 | Odds Ratio (M‐H, Fixed, 95% CI) | 0.0 [0.0, 0.0] |
| 3 Prevalence of incomplete bladder emptying within 2 years post surgery Show forest plot | 4 | 768 | Odds Ratio (M‐H, Fixed, 95% CI) | 0.94 [0.59, 1.47] |
|
| 3.1 Abdominal surgery | 3 | 639 | Odds Ratio (M‐H, Fixed, 95% CI) | 0.89 [0.55, 1.45] |
| 3.2 Laparoscopic surgery | 1 | 129 | Odds Ratio (M‐H, Fixed, 95% CI) | 1.28 [0.37, 4.44] |
| 4 Prevalence of incomplete bladder emptying >2 years post surgery Show forest plot | 1 | 173 | Odds Ratio (M‐H, Fixed, 95% CI) | 0.69 [0.37, 1.29] |
|
| 4.1 Abdominal surgery | 1 | 173 | Odds Ratio (M‐H, Fixed, 95% CI) | 0.69 [0.37, 1.29] |
| 4.2 Laparoscopic surgery | 0 | 0 | Odds Ratio (M‐H, Fixed, 95% CI) | 0.0 [0.0, 0.0] |
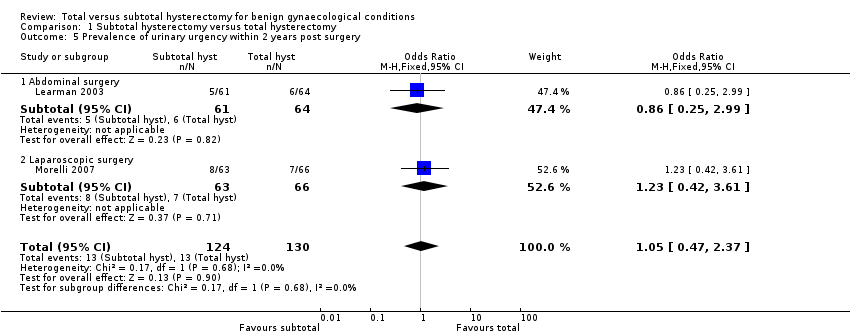
| 5 Prevalence of urinary urgency within 2 years post surgery Show forest plot | 2 | 254 | Odds Ratio (M‐H, Fixed, 95% CI) | 1.05 [0.47, 2.37] |
|
| 5.1 Abdominal surgery | 1 | 125 | Odds Ratio (M‐H, Fixed, 95% CI) | 0.86 [0.25, 2.99] |
| 5.2 Laparoscopic surgery | 1 | 129 | Odds Ratio (M‐H, Fixed, 95% CI) | 1.23 [0.42, 3.61] |
| 6 Prevalence of urinary urgency >2 years post surgery Show forest plot | 1 | 174 | Odds Ratio (M‐H, Fixed, 95% CI) | 1.26 [0.68, 2.32] |
|
| 6.1 Abdominal surgery | 1 | 174 | Odds Ratio (M‐H, Fixed, 95% CI) | 1.26 [0.68, 2.32] |
| 6.2 Laparoscopic surgery | 0 | 0 | Odds Ratio (M‐H, Fixed, 95% CI) | 0.0 [0.0, 0.0] |
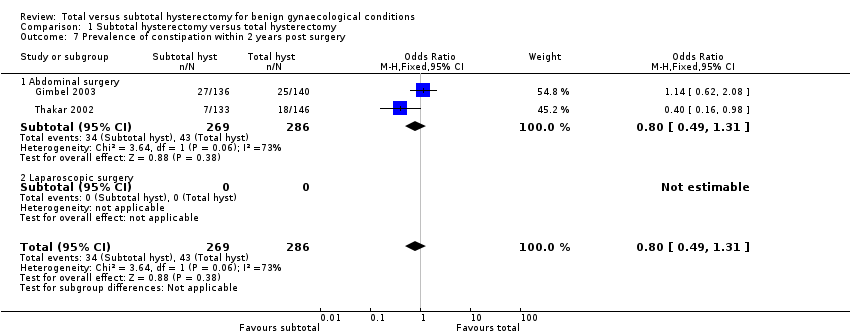
| 7 Prevalence of constipation within 2 years post surgery Show forest plot | 2 | 555 | Odds Ratio (M‐H, Fixed, 95% CI) | 0.80 [0.49, 1.31] |
|
| 7.1 Abdominal surgery | 2 | 555 | Odds Ratio (M‐H, Fixed, 95% CI) | 0.80 [0.49, 1.31] |
| 7.2 Laparoscopic surgery | 0 | 0 | Odds Ratio (M‐H, Fixed, 95% CI) | 0.0 [0.0, 0.0] |
| 8 Prevalence of constipation >2 years post surgery Show forest plot | 1 | 165 | Odds Ratio (M‐H, Fixed, 95% CI) | 1.52 [0.67, 3.45] |
|
| 8.1 Abdominal surgery | 1 | 165 | Odds Ratio (M‐H, Fixed, 95% CI) | 1.52 [0.67, 3.45] |
| 8.2 Laparoscopic surgery | 0 | 0 | Odds Ratio (M‐H, Fixed, 95% CI) | 0.0 [0.0, 0.0] |
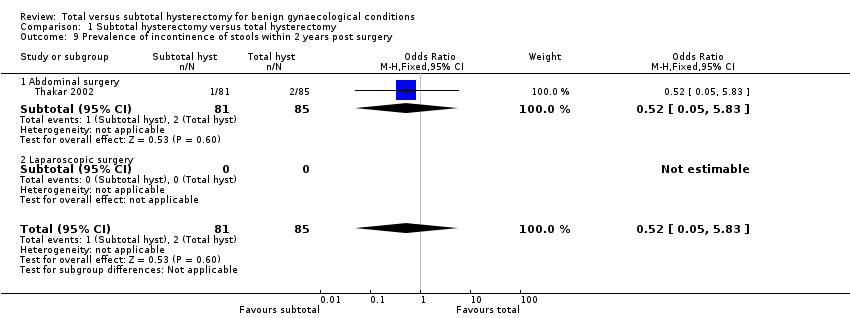
| 9 Prevalence of incontinence of stools within 2 years post surgery Show forest plot | 1 | 166 | Odds Ratio (M‐H, Fixed, 95% CI) | 0.52 [0.05, 5.83] |
|
| 9.1 Abdominal surgery | 1 | 166 | Odds Ratio (M‐H, Fixed, 95% CI) | 0.52 [0.05, 5.83] |
| 9.2 Laparoscopic surgery | 0 | 0 | Odds Ratio (M‐H, Fixed, 95% CI) | 0.0 [0.0, 0.0] |
| 10 Prevalence of incontinence of stools >2 years post surgery Show forest plot | 1 | 166 | Odds Ratio (M‐H, Fixed, 95% CI) | 0.52 [0.05, 5.83] |
|
| 10.1 Abdominal surgery | 1 | 166 | Odds Ratio (M‐H, Fixed, 95% CI) | 0.52 [0.05, 5.83] |
| 10.2 Laparoscopic surgery | 0 | 0 | Odds Ratio (M‐H, Fixed, 95% CI) | 0.0 [0.0, 0.0] |
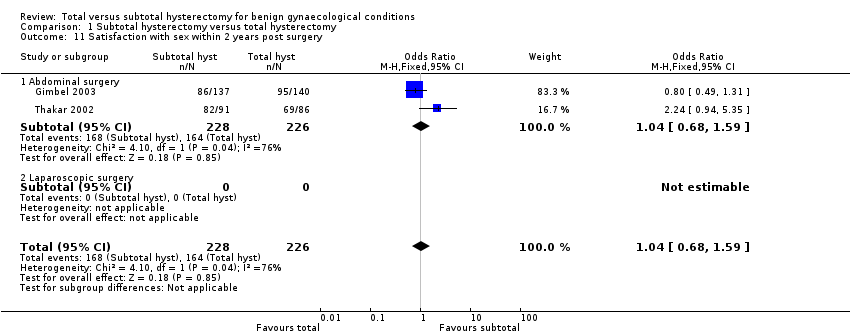
| 11 Satisfaction with sex within 2 years post surgery Show forest plot | 2 | 454 | Odds Ratio (M‐H, Fixed, 95% CI) | 1.04 [0.68, 1.59] |
|
| 11.1 Abdominal surgery | 2 | 454 | Odds Ratio (M‐H, Fixed, 95% CI) | 1.04 [0.68, 1.59] |
| 11.2 Laparoscopic surgery | 0 | 0 | Odds Ratio (M‐H, Fixed, 95% CI) | 0.0 [0.0, 0.0] |
| 12 Satisfaction with sex >2 years post surgery Show forest plot | 1 | 131 | Odds Ratio (M‐H, Fixed, 95% CI) | 0.95 [0.13, 6.98] |
|
| 12.1 Abdominal hysterectomy | 1 | 131 | Odds Ratio (M‐H, Fixed, 95% CI) | 0.95 [0.13, 6.98] |
| 12.2 Laparoscopic hysterectomy | 0 | 0 | Odds Ratio (M‐H, Fixed, 95% CI) | 0.0 [0.0, 0.0] |
| 13 Satisfaction with sex (cont) within 2 years post surgery Show forest plot | 2 | 192 | Std. Mean Difference (IV, Fixed, 95% CI) | ‐0.15 [‐0.43, 0.13] |
|
| 13.1 Abdominal surgery | 1 | 129 | Std. Mean Difference (IV, Fixed, 95% CI) | ‐0.04 [‐0.39, 0.30] |
| 13.2 Laparoscopic surgery | 1 | 63 | Std. Mean Difference (IV, Fixed, 95% CI) | ‐0.37 [‐0.87, 0.13] |
| 14 Satisfaction with sex (cont) >2 years post surgery | 0 | 0 | Std. Mean Difference (IV, Fixed, 95% CI) | 0.0 [0.0, 0.0] |
| 14.1 Abdominal surgery | 0 | 0 | Std. Mean Difference (IV, Fixed, 95% CI) | 0.0 [0.0, 0.0] |
| 14.2 Laparoscopic surgery | 0 | 0 | Std. Mean Difference (IV, Fixed, 95% CI) | 0.0 [0.0, 0.0] |
| 15 Prevalence of pain during sex within 2 years post surgery Show forest plot | 2 | 452 | Odds Ratio (M‐H, Fixed, 95% CI) | 0.87 [0.46, 1.67] |
|
| 15.1 Abdominal surgery | 2 | 452 | Odds Ratio (M‐H, Fixed, 95% CI) | 0.87 [0.46, 1.67] |
| 15.2 Laparoscopic surgery | 0 | 0 | Odds Ratio (M‐H, Fixed, 95% CI) | 0.0 [0.0, 0.0] |
| 16 Prevalence of pain during sex >2 years post surgery Show forest plot | 1 | 133 | Odds Ratio (M‐H, Fixed, 95% CI) | 0.56 [0.25, 1.23] |
|
| 16.1 Abdominal surgery | 1 | 133 | Odds Ratio (M‐H, Fixed, 95% CI) | 0.56 [0.25, 1.23] |
| 16.2 Laparoscopic surgery | 0 | 0 | Odds Ratio (M‐H, Fixed, 95% CI) | 0.0 [0.0, 0.0] |
| 17 Quality of life within 2 years post abdominal surgery (high better) Show forest plot | 5 | | Mean Difference (IV, Fixed, 95% CI) | Subtotals only |
|
| 17.1 General (abdominal) | 3 | 478 | Mean Difference (IV, Fixed, 95% CI) | 0.35 [‐0.27, 0.97] |
| 17.2 Physical domain (abdominal) | 3 | 652 | Mean Difference (IV, Fixed, 95% CI) | ‐0.52 [‐2.18, 1.14] |
| 17.3 Mental domain (abdominal) | 4 | 831 | Mean Difference (IV, Fixed, 95% CI) | ‐0.61 [‐2.05, 0.82] |
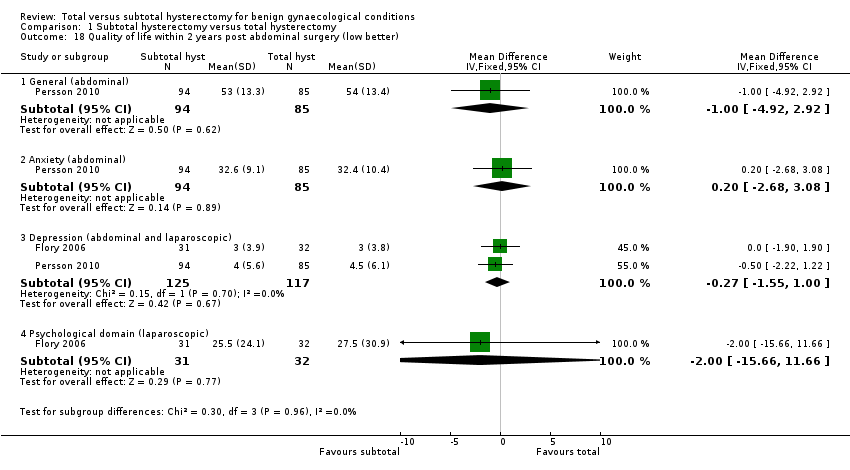
| 18 Quality of life within 2 years post abdominal surgery (low better) Show forest plot | 2 | | Mean Difference (IV, Fixed, 95% CI) | Subtotals only |
|
| 18.1 General (abdominal) | 1 | 179 | Mean Difference (IV, Fixed, 95% CI) | ‐1.0 [‐4.92, 2.92] |
| 18.2 Anxiety (abdominal) | 1 | 179 | Mean Difference (IV, Fixed, 95% CI) | 0.20 [‐2.68, 3.08] |
| 18.3 Depression (abdominal and laparoscopic) | 2 | 242 | Mean Difference (IV, Fixed, 95% CI) | ‐0.27 [‐1.55, 1.00] |
| 18.4 Psychological domain (laparoscopic) | 1 | 63 | Mean Difference (IV, Fixed, 95% CI) | ‐2.0 [‐15.66, 11.66] |
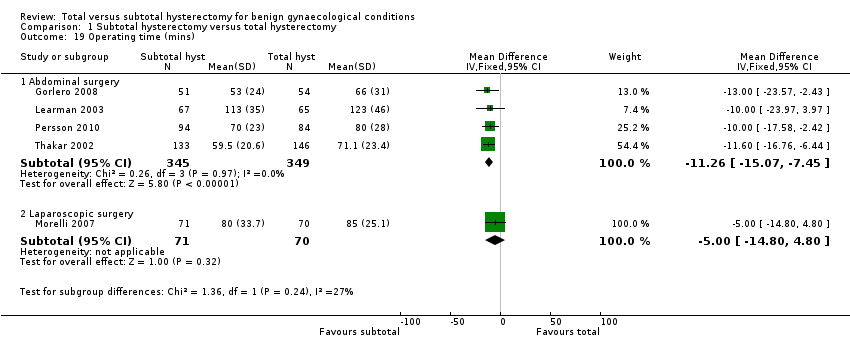
| 19 Operating time (mins) Show forest plot | 5 | | Mean Difference (IV, Fixed, 95% CI) | Subtotals only |
|
| 19.1 Abdominal surgery | 4 | 694 | Mean Difference (IV, Fixed, 95% CI) | ‐11.26 [‐15.07, ‐7.45] |
| 19.2 Laparoscopic surgery | 1 | 141 | Mean Difference (IV, Fixed, 95% CI) | ‐5.0 [‐14.80, 4.80] |
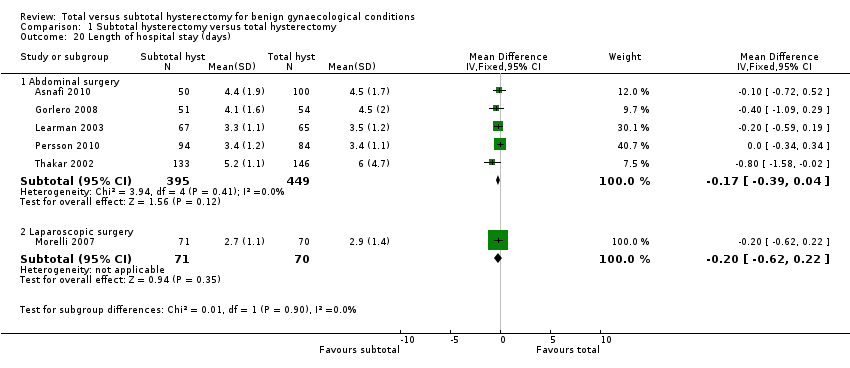
| 20 Length of hospital stay (days) Show forest plot | 6 | | Mean Difference (IV, Fixed, 95% CI) | Subtotals only |
|
| 20.1 Abdominal surgery | 5 | 844 | Mean Difference (IV, Fixed, 95% CI) | ‐0.17 [‐0.39, 0.04] |
| 20.2 Laparoscopic surgery | 1 | 141 | Mean Difference (IV, Fixed, 95% CI) | ‐0.20 [‐0.62, 0.22] |
| 21 Return to normal activities (weeks) Show forest plot | 2 | | Mean Difference (IV, Fixed, 95% CI) | Subtotals only |
|
| 21.1 Abdominal surgery | 2 | 310 | Mean Difference (IV, Fixed, 95% CI) | ‐0.14 [‐0.53, 0.25] |
| 21.2 Laparoscopic surgery | 0 | 0 | Mean Difference (IV, Fixed, 95% CI) | 0.0 [0.0, 0.0] |
| 22 Requirement for blood transfusion Show forest plot | 5 | | Odds Ratio (M‐H, Fixed, 95% CI) | Subtotals only |
|
| 22.1 Abdominal surgery | 4 | 694 | Odds Ratio (M‐H, Fixed, 95% CI) | 1.24 [0.61, 2.54] |
| 22.2 Laparoscopic surgery | 1 | 141 | Odds Ratio (M‐H, Fixed, 95% CI) | 1.25 [0.32, 4.86] |
| 23 Blood loss during surgery (mls) Show forest plot | 4 | | Mean Difference (IV, Fixed, 95% CI) | Subtotals only |
|
| 23.1 Abdominal surgery | 3 | 589 | Mean Difference (IV, Fixed, 95% CI) | ‐56.63 [‐99.58, ‐13.68] |
| 23.2 Laparoscopic surgery | 1 | 141 | Mean Difference (IV, Fixed, 95% CI) | ‐36.0 [‐145.35, 73.35] |
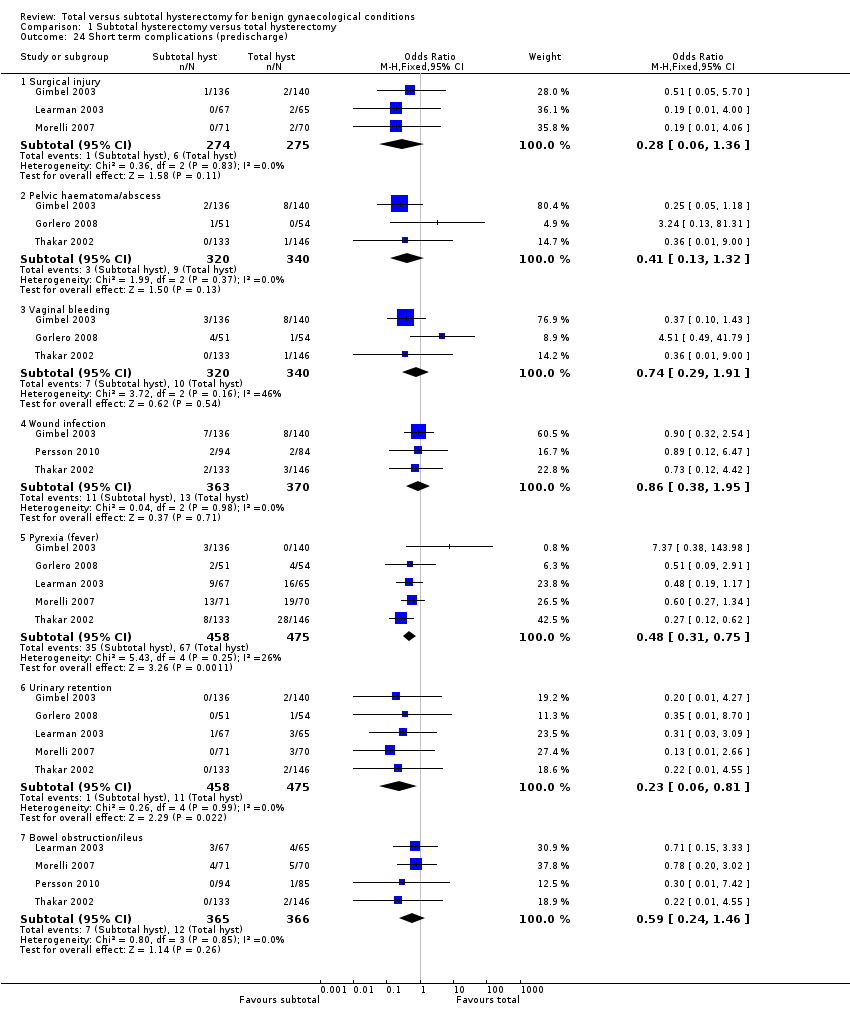
| 24 Short term complications (predischarge) Show forest plot | 6 | | Odds Ratio (M‐H, Fixed, 95% CI) | Subtotals only |
|
| 24.1 Surgical injury | 3 | 549 | Odds Ratio (M‐H, Fixed, 95% CI) | 0.28 [0.06, 1.36] |
| 24.2 Pelvic haematoma/abscess | 3 | 660 | Odds Ratio (M‐H, Fixed, 95% CI) | 0.41 [0.13, 1.32] |
| 24.3 Vaginal bleeding | 3 | 660 | Odds Ratio (M‐H, Fixed, 95% CI) | 0.74 [0.29, 1.91] |
| 24.4 Wound infection | 3 | 733 | Odds Ratio (M‐H, Fixed, 95% CI) | 0.86 [0.38, 1.95] |
| 24.5 Pyrexia (fever) | 5 | 933 | Odds Ratio (M‐H, Fixed, 95% CI) | 0.48 [0.31, 0.75] |
| 24.6 Urinary retention | 5 | 933 | Odds Ratio (M‐H, Fixed, 95% CI) | 0.23 [0.06, 0.81] |
| 24.7 Bowel obstruction/ileus | 4 | 731 | Odds Ratio (M‐H, Fixed, 95% CI) | 0.59 [0.24, 1.46] |
| 25 Intermediate term complications (after discharge and within 2 years post surgery) Show forest plot | 5 | | Odds Ratio (M‐H, Fixed, 95% CI) | Subtotals only |
|
| 25.1 Ongoing cyclical bleeding | 5 | 964 | Odds Ratio (M‐H, Fixed, 95% CI) | 15.97 [6.14, 41.56] |
| 25.2 Persistent pain | 5 | 963 | Odds Ratio (M‐H, Fixed, 95% CI) | 0.90 [0.58, 1.38] |
| 25.3 Removal of cervical stump | 2 | 457 | Odds Ratio (M‐H, Fixed, 95% CI) | 5.14 [0.60, 44.35] |
| 25.4 Pelvic prolapse | 4 | 839 | Odds Ratio (M‐H, Fixed, 95% CI) | 2.74 [0.80, 9.34] |
| 25.5 Gynaecological cancer | 0 | 0 | Odds Ratio (M‐H, Fixed, 95% CI) | 0.0 [0.0, 0.0] |
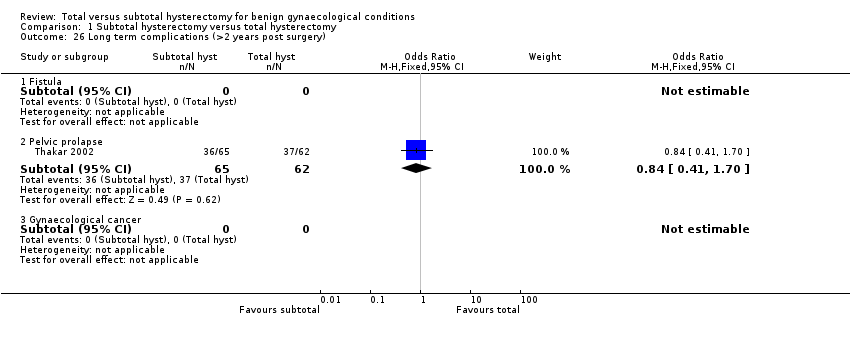
| 26 Long term complications (>2 years post surgery) Show forest plot | 1 | | Odds Ratio (M‐H, Fixed, 95% CI) | Subtotals only |
|
| 26.1 Fistula | 0 | 0 | Odds Ratio (M‐H, Fixed, 95% CI) | 0.0 [0.0, 0.0] |
| 26.2 Pelvic prolapse | 1 | 127 | Odds Ratio (M‐H, Fixed, 95% CI) | 0.84 [0.41, 1.70] |
| 26.3 Gynaecological cancer | 0 | 0 | Odds Ratio (M‐H, Fixed, 95% CI) | 0.0 [0.0, 0.0] |
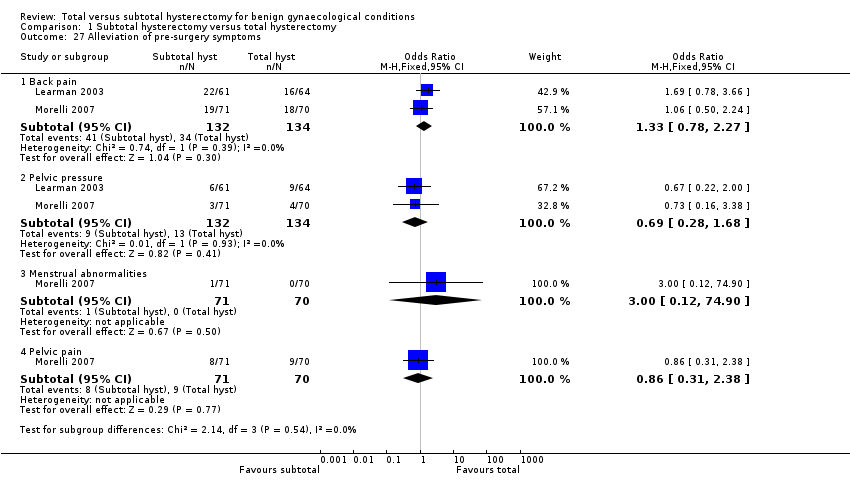
| 27 Alleviation of pre‐surgery symptoms Show forest plot | 2 | | Odds Ratio (M‐H, Fixed, 95% CI) | Subtotals only |
|
| 27.1 Back pain | 2 | 266 | Odds Ratio (M‐H, Fixed, 95% CI) | 1.33 [0.78, 2.27] |
| 27.2 Pelvic pressure | 2 | 266 | Odds Ratio (M‐H, Fixed, 95% CI) | 0.69 [0.28, 1.68] |
| 27.3 Menstrual abnormalities | 1 | 141 | Odds Ratio (M‐H, Fixed, 95% CI) | 3.00 [0.12, 74.90] |
| 27.4 Pelvic pain | 1 | 141 | Odds Ratio (M‐H, Fixed, 95% CI) | 0.86 [0.31, 2.38] |
| 28 Readmission rate (related to surgery) Show forest plot | 5 | | Odds Ratio (M‐H, Fixed, 95% CI) | Subtotals only |
|
| 28.1 Abdominal surgery | 4 | 869 | Odds Ratio (M‐H, Fixed, 95% CI) | 1.10 [0.63, 1.91] |
| 28.2 Laparoscopic surgery | 1 | 141 | Odds Ratio (M‐H, Fixed, 95% CI) | 1.96 [0.68, 5.62] |