Histerectomía total versus subtotal para enfermedades ginecológicas benignas
Referencias
Referencias de los estudios incluidos en esta revisión
Referencias de los estudios excluidos de esta revisión
Referencias de los estudios en espera de evaluación
Referencias adicionales
Characteristics of studies
Characteristics of included studies [ordered by study ID]
| Methods | Randomisation method: Not reported No. of centres: 1 Design: Parallel group Blinding: Not reported but unlikely No. randomised: 150 No. analysed: 150 Power calculation: Yes (150 overall to detect a 20% difference between the groups with 80% power, alpha level of 0.95 and confidence level of 95%) Intention‐to‐treat analysis: Yes, except for sexual functioning/dyspareunia ‐ analyses performed only in women who were sexually active or complained of dyspareunia Source of funding: Babol Medical University, Iran | |
| Participants | Inclusion: Women >35 years; premenopausal; offered abdominal hysterectomy for symptomatic uterine fibroids with confirmation of the lesion or abnormal uterine bleeding without any response to hormone therapy of at least 3 months trial. Exclusion: Age >50 years at screening; positive pregnancy test; genital tract carcinoma; body weight >100kg; diabetes mellitus; candidates for vaginal hysterectomy determined by a gynecologist; unlikely to remain geographically accessible for follow up. Age: 43 and 46 years (mean in each treatment group) Source: From Department of Gynecology in a teaching hospital associated with Babol Medical University in Iran | |
| Interventions | (1) subtotal abdominal hysterectomy (2) total abdominal hysterectomy Follow up: 6 months after surgery | |
| Outcomes | Fever; anaemia; duration of hospitalisation, changes in sexual function | |
| Notes | ||
| Risk of bias | ||
| Bias | Authors' judgement | Support for judgement |
| Random sequence generation (selection bias) | Unclear risk | Stated as "randomly assigned" |
| Allocation concealment (selection bias) | Unclear risk | Not reported |
| Blinding (performance bias and detection bias) | High risk | Lack of blinding could have affected outcomes such as sexual functioning and pain |
| Incomplete outcome data (attrition bias) | Low risk | No reported dropouts |
| Selective reporting (reporting bias) | Low risk | All prespecified outcomes reported |
| Other bias | Unclear risk | Sexual functioning assessed only in subgroups of women ‐ unclear if these subgroups groups were comparable at baseline. Short follow up for assessment of sexual functioning |
| Methods | Randomisation method: Method not described, other than allocation from sealed opaque envelopes No. of centres: 1 Design: Parallel group Blinding: No No. randomised: 132 No. analysed: 104 Exclusions from analysis: Subtotal: declined surgery or operated elsewhere (n=2); salphingoophorectomy (n=2); lost to follow up (n=10) Total: declined surgery or operated elsewhere (n=5); malignancy diagnosed perioperatively (n=1); lost to follow up (n=10) Protocol violations: Subtotal: Change of method due to surgical complications (n=2) Total: n=0 Power calculation: Yes (50‐70 patients per treatment arm required, no other details reported) Intention to treat analysis: Stated as yes, but not true ITT analysis as lost to follow up not included Source of funding: Swedish Medical Research Council (B95‐17X‐11237‐01A) and the Goteborg Medical Society Fund | |
| Participants | Inclusion: Pre‐menopausal patients scheduled for hysterectomy for benign disorders Exclusion: Previous cervical dysplasia; planned oophorectomy; previous symptomatic prolapse Age: 45 years (mean) Source: Patients requiring hysterectomy for benign disorders at the Department of Obstetrics and Gynaecology, Sahlgrenska University Hospital, Gothenburg, Sweden | |
| Interventions | (1) subtotal hysterectomy (2) total hysterectomy For both treatment groups, abdominal hysterectomy was recommended when the diameter of the uterus was >11cm, otherwise vaginal or laparoscopic surgery was planned but the final decision was made by the surgeon. Follow up: 12 months after surgery | |
| Outcomes | Changes in sexual health (measured by the McCoy Female Sexuality Questionnaire) and changes in psychological wellbeing (measured by the Psychological General Well‐being index) | |
| Notes | Lack of power | |
| Risk of bias | ||
| Bias | Authors' judgement | Support for judgement |
| Random sequence generation (selection bias) | Unclear risk | "Randomised in a ratio of 1:1" but method not described |
| Allocation concealment (selection bias) | Low risk | Sealed opaque envelopes; performed by a study nurse |
| Blinding (performance bias and detection bias) | High risk | Blinding of participants was originally planned but proved impossible. Knowledge of treatment could have affected patients' perceptions of sexual function and health |
| Incomplete outcome data (attrition bias) | Unclear risk | >20% attrition in each group |
| Selective reporting (reporting bias) | Low risk | All prespecified outcomes reported |
| Other bias | Unclear risk | No adjustments made for multiple outcomes |
| Methods | Randomisation method: Computer generated block randomisation No. of centres: 1 Design: Parallel group Blinding: No No. randomised: 80 No. analysed: 63 Dropout at the end of follow up: 9/40 in subtotal group (2 after randomisation; 2 moved/wrong phone; 3 not interested; 4 other reasons); 8/40 in total group (1 after randomisation; 3 moved/wrong phone; 2 not interested; 3 other reasons) Power calculation: Yes (32 per treatment arm for moderate effect size (difference of 0.5 SD) gave 80% power, with alpha=0.05) Intention‐to‐treat analysis: No Source of funding: Canadian Foundation for Womens Health Institute of Health Research | |
| Participants | Inclusion: 18‐55 years old; pre‐menopausal; fluent in French language Exclusion: Prior oophorectomy; prior uterine prolapse; prior chemotherapy; prior neoplasia in the uterus/cervix Age: 44 years (mean) Source: From surgeons/gynaecologists and local media announcement, study undertaken at Department of Obstetrics and Gynecology, University of Montreal | |
| Interventions | (1) subtotal laparoscopic hysterectomy (2) total laparoscopic assisted vaginal hysterectomy Follow up: 6 ‐ 7 months after surgery | |
| Outcomes | Sexual drive; sexual arousal; orgasm; sexual behaviour; overall sexual functioning; pain (Likert scale and MPQ); depression and other psychological symptoms (BDI and BSI); body image (SSS and BES); psychosocial functioning | |
| Notes | ||
| Risk of bias | ||
| Bias | Authors' judgement | Support for judgement |
| Random sequence generation (selection bias) | Low risk | Computer generated block randomisation |
| Allocation concealment (selection bias) | Low risk | Treatment assignment concealed in consecutively numbered sealed envelopes, opened by surgeons at the time of surgery |
| Blinding (performance bias and detection bias) | Unclear risk | Not reported |
| Incomplete outcome data (attrition bias) | Unclear risk | >20% dropout but balanced between groups |
| Selective reporting (reporting bias) | Low risk | All prespecified outcomes reported |
| Other bias | Unclear risk | Groups not balanced at baseline (87% of women in subtotal group and 66% of women in total group had fibroids) |
| Methods | Randomisation method: Restricted, computer generated block randomisation | |
| Participants | Inclusion: | |
| Interventions | (1) subtotal hysterectomy | |
| Outcomes | Primary: | |
| Notes | A later publication compared the effects of interventions on sexual function (Zobbe 2003) and another later publication (Gimbel 2005) compared the effects of the interventions on a more detailed specification or urinary symptoms (stress, urge and mixed incontinence and incomplete bladder emptying) | |
| Risk of bias | ||
| Bias | Authors' judgement | Support for judgement |
| Random sequence generation (selection bias) | Low risk | Computer generated randomisation procedure |
| Allocation concealment (selection bias) | Low risk | Central allocation |
| Blinding (performance bias and detection bias) | High risk | Authors acknowledged the "lack of blinding" |
| Incomplete outcome data (attrition bias) | Unclear risk | >10% lost to follow up ‐ no reasons given |
| Selective reporting (reporting bias) | Low risk | All prespecified outcomes reported |
| Other bias | Low risk | Multiple sources of funding including Organon but unlikely bias because of independent data monitoring. No baseline imbalance between groups. |
| Methods | Randomisation method: computer generated numbers Number of centres: 1 Design: parallel group No. randomised: 117 No. analysed: 105 Dropout at end of follow up: 12/117 (10.3%) ‐ reasons not given Power calculation: no Intention to treat analysis: no Source of funding: not stated | |
| Participants | Inclusion: Women requiring an abdominal hysterectomy for a benign indication Exclusion: 2nd or 3rd degree uterine prolapse; age >75 years; malignancy; BMI>29; previous pelvic surgery; endometriosis or history of chronic pelvic pain; abnormal cervical smears; psychiatric disorders Age: subtotal hyst (mean 46 years); total hyst (mean 49 years) Source: Department of San Martino Hospital and University of Genoa in Genoa, Italy (Jan 2003 to December 2005) | |
| Interventions | (1) subtotal hysterectomy (2) total hysterectomy Follow up: 1 year | |
| Outcomes | Primary: Womens' satisfaction (evaluated by answers to a questionnaire on sexual activity, body image and health status) Secondary: Occurrence of surgical complications; postoperative recovery | |
| Notes | Study measures 'satisfaction' by women's responses to questions on sexual activity, body image and quality of life | |
| Risk of bias | ||
| Bias | Authors' judgement | Support for judgement |
| Random sequence generation (selection bias) | Low risk | Computer generated numbers |
| Allocation concealment (selection bias) | Low risk | Sealed opaque envelopes opened immediately before surgical incision |
| Blinding (performance bias and detection bias) | High risk | Stated as not blinded |
| Incomplete outcome data (attrition bias) | Unclear risk | No reasons given for incomplete data and no information on distribution between groups |
| Selective reporting (reporting bias) | Low risk | All prespecified outcomes reported |
| Other bias | Low risk | Groups comparable at baseline and no other potential bias identified |
| Methods | Randomisation method: Computer generated random numbers sequence in blocks with sealed numbered opaque envelopes | |
| Participants | Inclusion: | |
| Interventions | (1) subtotal hysterectomy | |
| Outcomes | Primary: | |
| Notes | A later publication compared the effects of the interventions on sexual function and quality of life | |
| Risk of bias | ||
| Bias | Authors' judgement | Support for judgement |
| Random sequence generation (selection bias) | Low risk | Computer generated random number sequence, stratified by centre, in blocks |
| Allocation concealment (selection bias) | Low risk | Sealed numbered opaque envelopes |
| Blinding (performance bias and detection bias) | High risk | Unblinded |
| Incomplete outcome data (attrition bias) | Low risk | Loss to follow up but reasons clearly specified |
| Selective reporting (reporting bias) | Low risk | All pre‐specified outcomes reported |
| Other bias | Low risk | No baseline imbalance, funding by AHRQ |
| Methods | Randomisation method: Computer generated No. of centres: 1 Design: Parallel group No. randomised: 141 No. analysed: 129 (primary outcome at 24 months); 141 for surgical outcomes Dropout at end of follow up: Subtotal group: 8/71 (11.3%) ‐ 1 death, 7 lost to follow up. Total group: 4/70 (5.7%) ‐ 1 death, 3 lost to follow up Power calculation: Not reported Intention to treat analysis: No for primary outcomes but surgical outcomes were ITT. Source of funding: Not reported | |
| Participants | Inclusion: Age >30 years; pre‐menopausal; abnormal uterine bleeding with previous hormonal treatment for at least 3 months and diagnosis confirmed by echo or hysteroscopy OR symptomatic uterine leiomyomas (bleeding, compression etc) with diagnosis confirmed by echo or hysteroscopy OR patients >45 years with FSH ≤30 mIU/ml and negative endometrial biopsy for hyperplasia or carcinoma. Exclusion: Pregnancy; age >50 years; planned pregnancy; diagnosed or suspected genital cancer; dysplasia; endometrial hyperplasia; candidate for vaginal hysterectomy Age: Mean 42 years Source: Not reported ‐ all patients identified through a vaginal screening program in Catanzaro, Italy | |
| Interventions | (1) subtotal laparoscopic hysterectomy (2) total laparoscopic hysterectomy (both using standard surgery procedures) Follow up: 24 months after surgery | |
| Outcomes | Surgical outcomes: operation time, blood loss, other operative complications; readmission to hospital during follow up; irregular bleeding; pelvic pain; pelvic compression; lumbar pain; urinary urgency; sensation of incomplete emptying of bladder; stress incontinence | |
| Notes | Publication translated from Italian into English by Lorenzo Moja of the Italian Cochrane Centre | |
| Risk of bias | ||
| Bias | Authors' judgement | Support for judgement |
| Random sequence generation (selection bias) | Low risk | Computer generated |
| Allocation concealment (selection bias) | Unclear risk | Not reported |
| Blinding (performance bias and detection bias) | Unclear risk | Not reported but unlikely |
| Incomplete outcome data (attrition bias) | Low risk | Reasons clearly specified for dropouts before the conclusion of the trial at 24 months |
| Selective reporting (reporting bias) | Low risk | All prespecified outcomes reported |
| Other bias | Low risk | Groups balanced at baseline. No other possible bias identified. |
| Methods | Randomisation method: Random numbers table with block randomisation according to centre No. of centres: 8 Design: Parallel group No. randomised: 200 No. analysed: 178 Dropout at end of follow up: Subtotal group: 5/104 withdrew consent prior to surgery, 4/104 withdrew consent during study period and 1/104 missing diary. Total group: 3/96 withdrew consent prior to surgery, 2/96 intraoperative finding of cancer, 1/96 converted to subtotal hysterectomy, 1/96 protocol violation, 5/96 withdrew consent during study period, 1/96 missing diary Power calculation: Yes: difference in PGWB score of 8 points Intention to treat analysis: Stated as intention to treat but 10% of subtotal and 13% of total group not included in the analyses Source of funding: Medical Research Council of south‐east Sweden and County Council of Ostergotland and Linkoping University | |
| Participants | Inclusion: Planned hysterectomy for benign gynaecological condition, proficiency in Swedish, preservation of at least one ovary Exclusion: Malignancy in genital organs, previous or present cervical dysplasia, rapidly growing fibroids where malignancy could not be ruled out, preoperative treatment with GnRH analogues, post‐menopausal women without hormone replacement therapy, severe psychiatric disorders Age: Mean 46 years Source: Patients identified from seven hospitals and one private gynaecological clinic in Sweden ‐ admitted for hysterectomy because of benign gynaecological conditions | |
| Interventions | (1) subtotal abdominal hysterectomy (2) total abdominal hysterectomy (both techniques according to surgeon discretion) Follow up: 12 months after surgery | |
| Outcomes | Primary: | |
| Notes | Two publications | |
| Risk of bias | ||
| Bias | Authors' judgement | Support for judgement |
| Random sequence generation (selection bias) | Low risk | Random numbers table with block randomisation according to centre |
| Allocation concealment (selection bias) | Low risk | "Opaque envelopes numbered sequentially in accordance with random table, opened consecutively" |
| Blinding (performance bias and detection bias) | High risk | "Women informed about their assignment prior to surgery" |
| Incomplete outcome data (attrition bias) | Low risk | "Missing outcome data balanced in numbers across intervention groups with similar reasons for missing data across groups" |
| Selective reporting (reporting bias) | Low risk | All prespecified outcomes reported |
| Other bias | Low risk | Comparison groups balanced at baseline. No pharmaceutical funding. |
| Methods | Randomisation method: | |
| Participants | Inclusion: | |
| Interventions | (1) subtotal hysterectomy | |
| Outcomes | Primary: | |
| Notes | A later publication (Thakar 2004) compared the effects of the interventions on health status/quality of life and psychological outcomes and another later publication (Thakar 2005) compared the effects of the interventions on longer follow up (7 to 11 years after surgery). | |
| Risk of bias | ||
| Bias | Authors' judgement | Support for judgement |
| Random sequence generation (selection bias) | Low risk | Computer generated numbers |
| Allocation concealment (selection bias) | Low risk | Sealed opaque envelopes only opened after surgical incision |
| Blinding (performance bias and detection bias) | Low risk | Participants and investigators blinded for 1 year |
| Incomplete outcome data (attrition bias) | Low risk | Clear explanations given for missing data but analysis at 9 years undertaken on 65% of original study group |
| Selective reporting (reporting bias) | Low risk | All pre‐specified outcomes reported |
| Other bias | Low risk | No baseline imbalance, funding by research program |
Characteristics of excluded studies [ordered by study ID]
| Study | Reason for exclusion |
| Not RCT ‐ does not mention randomisation to groups | |
| Meta‐analysis, not RCT | |
| Guideline on subtotal hysterectomy, not RCT | |
| Did not measure one or more of the primary outcomes for the review | |
| Not randomised | |
| Meta‐analysis, not RCT | |
| Resource use for total and supracervical hysterectomy was compared. These outcomes are not relevant to the review |
Characteristics of studies awaiting assessment [ordered by study ID]
| Methods | RCT |
| Participants | Patients who were candidates for hysterectomy with benign disease with no contraindications for laparoscopic surgery; recruited from Arash Hospital from March 2007 to April 2009. N=45; 20 for subtotal and 25 for total hysterectomy |
| Interventions | (1) subtotal laparoscopic hysterectomy; (2) total laparoscopic hysterectomy |
| Outcomes | Duration of surgery, blood transfusion, length of hospital stay, post‐operative pain, time to return to normal activities, sexual function, dyspareunia, cyclic bleeding, cervical prolapse, intra and post‐operative complications |
| Notes | Awaiting translation |
| Methods | Single blinded RCT |
| Participants | N=50; 25 randomised to subtotal abdominal hysterectomy and 25 randomised to total abdominal hysterectomy |
| Interventions | (1) subtotal abdominal hysterectomy; (2) total abdominal hysterectomy |
| Outcomes | Duration of surgery, volume of bleeding, duration of hospital stay, operative complications, dyspareunia, sexual satisfaction, ongoing bleeding |
| Notes | Awaiting translation |
Data and analyses
| Outcome or subgroup title | No. of studies | No. of participants | Statistical method | Effect size |
| 1 Prevalence of stress urinary incontinence within 2 years post surgery Show forest plot | 5 | 955 | Odds Ratio (M‐H, Fixed, 95% CI) | 1.45 [0.85, 2.47] |
| Analysis 1.1  Comparison 1 Subtotal hysterectomy versus total hysterectomy, Outcome 1 Prevalence of stress urinary incontinence within 2 years post surgery. | ||||
| 1.1 Abdominal surgery | 4 | 826 | Odds Ratio (M‐H, Fixed, 95% CI) | 1.55 [0.86, 2.78] |
| 1.2 Laparoscopic surgery | 1 | 129 | Odds Ratio (M‐H, Fixed, 95% CI) | 1.05 [0.29, 3.82] |
| 2 Prevalence of stress urinary incontinence >2 years post surgery Show forest plot | 1 | 178 | Odds Ratio (M‐H, Fixed, 95% CI) | 1.15 [0.63, 2.08] |
| Analysis 1.2  Comparison 1 Subtotal hysterectomy versus total hysterectomy, Outcome 2 Prevalence of stress urinary incontinence >2 years post surgery. | ||||
| 2.1 Abdominal surgery | 1 | 178 | Odds Ratio (M‐H, Fixed, 95% CI) | 1.15 [0.63, 2.08] |
| 2.2 Laparoscopic surgery | 0 | 0 | Odds Ratio (M‐H, Fixed, 95% CI) | 0.0 [0.0, 0.0] |
| 3 Prevalence of incomplete bladder emptying within 2 years post surgery Show forest plot | 4 | 768 | Odds Ratio (M‐H, Fixed, 95% CI) | 0.94 [0.59, 1.47] |
| Analysis 1.3  Comparison 1 Subtotal hysterectomy versus total hysterectomy, Outcome 3 Prevalence of incomplete bladder emptying within 2 years post surgery. | ||||
| 3.1 Abdominal surgery | 3 | 639 | Odds Ratio (M‐H, Fixed, 95% CI) | 0.89 [0.55, 1.45] |
| 3.2 Laparoscopic surgery | 1 | 129 | Odds Ratio (M‐H, Fixed, 95% CI) | 1.28 [0.37, 4.44] |
| 4 Prevalence of incomplete bladder emptying >2 years post surgery Show forest plot | 1 | 173 | Odds Ratio (M‐H, Fixed, 95% CI) | 0.69 [0.37, 1.29] |
| Analysis 1.4  Comparison 1 Subtotal hysterectomy versus total hysterectomy, Outcome 4 Prevalence of incomplete bladder emptying >2 years post surgery. | ||||
| 4.1 Abdominal surgery | 1 | 173 | Odds Ratio (M‐H, Fixed, 95% CI) | 0.69 [0.37, 1.29] |
| 4.2 Laparoscopic surgery | 0 | 0 | Odds Ratio (M‐H, Fixed, 95% CI) | 0.0 [0.0, 0.0] |
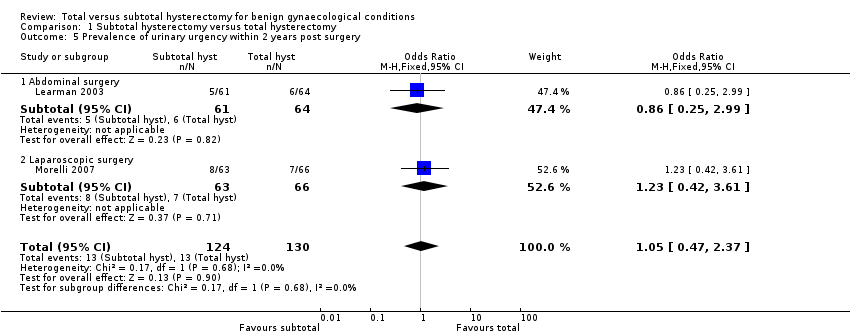
| 5 Prevalence of urinary urgency within 2 years post surgery Show forest plot | 2 | 254 | Odds Ratio (M‐H, Fixed, 95% CI) | 1.05 [0.47, 2.37] |
| Analysis 1.5  Comparison 1 Subtotal hysterectomy versus total hysterectomy, Outcome 5 Prevalence of urinary urgency within 2 years post surgery. | ||||
| 5.1 Abdominal surgery | 1 | 125 | Odds Ratio (M‐H, Fixed, 95% CI) | 0.86 [0.25, 2.99] |
| 5.2 Laparoscopic surgery | 1 | 129 | Odds Ratio (M‐H, Fixed, 95% CI) | 1.23 [0.42, 3.61] |
| 6 Prevalence of urinary urgency >2 years post surgery Show forest plot | 1 | 174 | Odds Ratio (M‐H, Fixed, 95% CI) | 1.26 [0.68, 2.32] |
| Analysis 1.6  Comparison 1 Subtotal hysterectomy versus total hysterectomy, Outcome 6 Prevalence of urinary urgency >2 years post surgery. | ||||
| 6.1 Abdominal surgery | 1 | 174 | Odds Ratio (M‐H, Fixed, 95% CI) | 1.26 [0.68, 2.32] |
| 6.2 Laparoscopic surgery | 0 | 0 | Odds Ratio (M‐H, Fixed, 95% CI) | 0.0 [0.0, 0.0] |
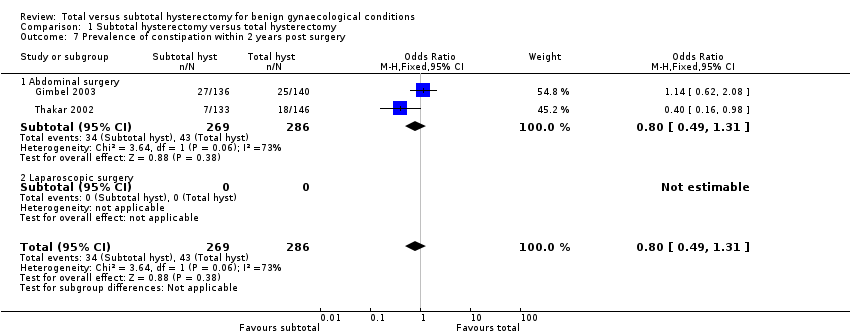
| 7 Prevalence of constipation within 2 years post surgery Show forest plot | 2 | 555 | Odds Ratio (M‐H, Fixed, 95% CI) | 0.80 [0.49, 1.31] |
| Analysis 1.7  Comparison 1 Subtotal hysterectomy versus total hysterectomy, Outcome 7 Prevalence of constipation within 2 years post surgery. | ||||
| 7.1 Abdominal surgery | 2 | 555 | Odds Ratio (M‐H, Fixed, 95% CI) | 0.80 [0.49, 1.31] |
| 7.2 Laparoscopic surgery | 0 | 0 | Odds Ratio (M‐H, Fixed, 95% CI) | 0.0 [0.0, 0.0] |
| 8 Prevalence of constipation >2 years post surgery Show forest plot | 1 | 165 | Odds Ratio (M‐H, Fixed, 95% CI) | 1.52 [0.67, 3.45] |
| Analysis 1.8  Comparison 1 Subtotal hysterectomy versus total hysterectomy, Outcome 8 Prevalence of constipation >2 years post surgery. | ||||
| 8.1 Abdominal surgery | 1 | 165 | Odds Ratio (M‐H, Fixed, 95% CI) | 1.52 [0.67, 3.45] |
| 8.2 Laparoscopic surgery | 0 | 0 | Odds Ratio (M‐H, Fixed, 95% CI) | 0.0 [0.0, 0.0] |
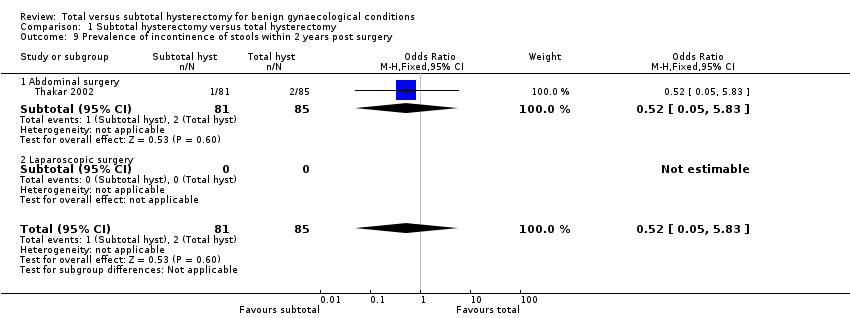
| 9 Prevalence of incontinence of stools within 2 years post surgery Show forest plot | 1 | 166 | Odds Ratio (M‐H, Fixed, 95% CI) | 0.52 [0.05, 5.83] |
| Analysis 1.9  Comparison 1 Subtotal hysterectomy versus total hysterectomy, Outcome 9 Prevalence of incontinence of stools within 2 years post surgery. | ||||
| 9.1 Abdominal surgery | 1 | 166 | Odds Ratio (M‐H, Fixed, 95% CI) | 0.52 [0.05, 5.83] |
| 9.2 Laparoscopic surgery | 0 | 0 | Odds Ratio (M‐H, Fixed, 95% CI) | 0.0 [0.0, 0.0] |
| 10 Prevalence of incontinence of stools >2 years post surgery Show forest plot | 1 | 166 | Odds Ratio (M‐H, Fixed, 95% CI) | 0.52 [0.05, 5.83] |
| Analysis 1.10  Comparison 1 Subtotal hysterectomy versus total hysterectomy, Outcome 10 Prevalence of incontinence of stools >2 years post surgery. | ||||
| 10.1 Abdominal surgery | 1 | 166 | Odds Ratio (M‐H, Fixed, 95% CI) | 0.52 [0.05, 5.83] |
| 10.2 Laparoscopic surgery | 0 | 0 | Odds Ratio (M‐H, Fixed, 95% CI) | 0.0 [0.0, 0.0] |
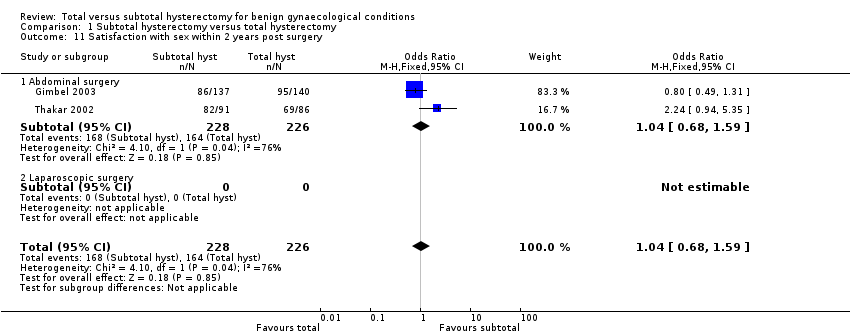
| 11 Satisfaction with sex within 2 years post surgery Show forest plot | 2 | 454 | Odds Ratio (M‐H, Fixed, 95% CI) | 1.04 [0.68, 1.59] |
| Analysis 1.11  Comparison 1 Subtotal hysterectomy versus total hysterectomy, Outcome 11 Satisfaction with sex within 2 years post surgery. | ||||
| 11.1 Abdominal surgery | 2 | 454 | Odds Ratio (M‐H, Fixed, 95% CI) | 1.04 [0.68, 1.59] |
| 11.2 Laparoscopic surgery | 0 | 0 | Odds Ratio (M‐H, Fixed, 95% CI) | 0.0 [0.0, 0.0] |
| 12 Satisfaction with sex >2 years post surgery Show forest plot | 1 | 131 | Odds Ratio (M‐H, Fixed, 95% CI) | 0.95 [0.13, 6.98] |
| Analysis 1.12  Comparison 1 Subtotal hysterectomy versus total hysterectomy, Outcome 12 Satisfaction with sex >2 years post surgery. | ||||
| 12.1 Abdominal hysterectomy | 1 | 131 | Odds Ratio (M‐H, Fixed, 95% CI) | 0.95 [0.13, 6.98] |
| 12.2 Laparoscopic hysterectomy | 0 | 0 | Odds Ratio (M‐H, Fixed, 95% CI) | 0.0 [0.0, 0.0] |
| 13 Satisfaction with sex (cont) within 2 years post surgery Show forest plot | 2 | 192 | Std. Mean Difference (IV, Fixed, 95% CI) | ‐0.15 [‐0.43, 0.13] |
| Analysis 1.13  Comparison 1 Subtotal hysterectomy versus total hysterectomy, Outcome 13 Satisfaction with sex (cont) within 2 years post surgery. | ||||
| 13.1 Abdominal surgery | 1 | 129 | Std. Mean Difference (IV, Fixed, 95% CI) | ‐0.04 [‐0.39, 0.30] |
| 13.2 Laparoscopic surgery | 1 | 63 | Std. Mean Difference (IV, Fixed, 95% CI) | ‐0.37 [‐0.87, 0.13] |
| 14 Satisfaction with sex (cont) >2 years post surgery | 0 | 0 | Std. Mean Difference (IV, Fixed, 95% CI) | 0.0 [0.0, 0.0] |
| 14.1 Abdominal surgery | 0 | 0 | Std. Mean Difference (IV, Fixed, 95% CI) | 0.0 [0.0, 0.0] |
| 14.2 Laparoscopic surgery | 0 | 0 | Std. Mean Difference (IV, Fixed, 95% CI) | 0.0 [0.0, 0.0] |
| 15 Prevalence of pain during sex within 2 years post surgery Show forest plot | 2 | 452 | Odds Ratio (M‐H, Fixed, 95% CI) | 0.87 [0.46, 1.67] |
| Analysis 1.15  Comparison 1 Subtotal hysterectomy versus total hysterectomy, Outcome 15 Prevalence of pain during sex within 2 years post surgery. | ||||
| 15.1 Abdominal surgery | 2 | 452 | Odds Ratio (M‐H, Fixed, 95% CI) | 0.87 [0.46, 1.67] |
| 15.2 Laparoscopic surgery | 0 | 0 | Odds Ratio (M‐H, Fixed, 95% CI) | 0.0 [0.0, 0.0] |
| 16 Prevalence of pain during sex >2 years post surgery Show forest plot | 1 | 133 | Odds Ratio (M‐H, Fixed, 95% CI) | 0.56 [0.25, 1.23] |
| Analysis 1.16  Comparison 1 Subtotal hysterectomy versus total hysterectomy, Outcome 16 Prevalence of pain during sex >2 years post surgery. | ||||
| 16.1 Abdominal surgery | 1 | 133 | Odds Ratio (M‐H, Fixed, 95% CI) | 0.56 [0.25, 1.23] |
| 16.2 Laparoscopic surgery | 0 | 0 | Odds Ratio (M‐H, Fixed, 95% CI) | 0.0 [0.0, 0.0] |
| 17 Quality of life within 2 years post abdominal surgery (high better) Show forest plot | 5 | Mean Difference (IV, Fixed, 95% CI) | Subtotals only | |
| Analysis 1.17  Comparison 1 Subtotal hysterectomy versus total hysterectomy, Outcome 17 Quality of life within 2 years post abdominal surgery (high better). | ||||
| 17.1 General (abdominal) | 3 | 478 | Mean Difference (IV, Fixed, 95% CI) | 0.35 [‐0.27, 0.97] |
| 17.2 Physical domain (abdominal) | 3 | 652 | Mean Difference (IV, Fixed, 95% CI) | ‐0.52 [‐2.18, 1.14] |
| 17.3 Mental domain (abdominal) | 4 | 831 | Mean Difference (IV, Fixed, 95% CI) | ‐0.61 [‐2.05, 0.82] |
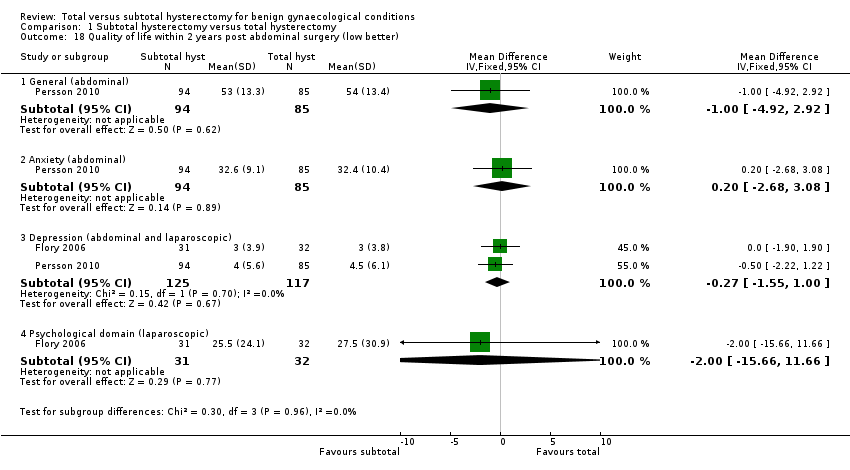
| 18 Quality of life within 2 years post abdominal surgery (low better) Show forest plot | 2 | Mean Difference (IV, Fixed, 95% CI) | Subtotals only | |
| Analysis 1.18  Comparison 1 Subtotal hysterectomy versus total hysterectomy, Outcome 18 Quality of life within 2 years post abdominal surgery (low better). | ||||
| 18.1 General (abdominal) | 1 | 179 | Mean Difference (IV, Fixed, 95% CI) | ‐1.0 [‐4.92, 2.92] |
| 18.2 Anxiety (abdominal) | 1 | 179 | Mean Difference (IV, Fixed, 95% CI) | 0.20 [‐2.68, 3.08] |
| 18.3 Depression (abdominal and laparoscopic) | 2 | 242 | Mean Difference (IV, Fixed, 95% CI) | ‐0.27 [‐1.55, 1.00] |
| 18.4 Psychological domain (laparoscopic) | 1 | 63 | Mean Difference (IV, Fixed, 95% CI) | ‐2.0 [‐15.66, 11.66] |
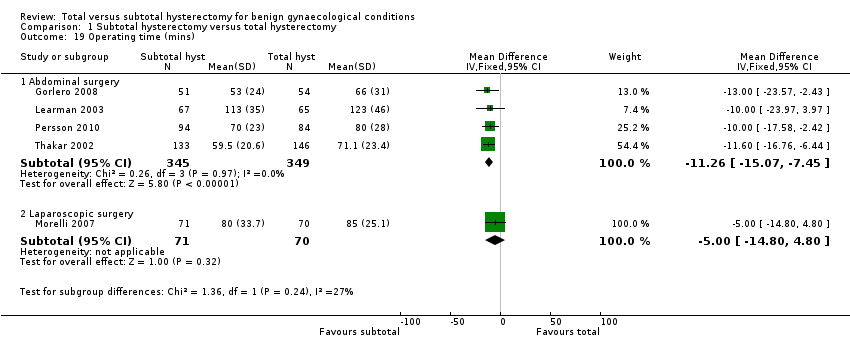
| 19 Operating time (mins) Show forest plot | 5 | Mean Difference (IV, Fixed, 95% CI) | Subtotals only | |
| Analysis 1.19  Comparison 1 Subtotal hysterectomy versus total hysterectomy, Outcome 19 Operating time (mins). | ||||
| 19.1 Abdominal surgery | 4 | 694 | Mean Difference (IV, Fixed, 95% CI) | ‐11.26 [‐15.07, ‐7.45] |
| 19.2 Laparoscopic surgery | 1 | 141 | Mean Difference (IV, Fixed, 95% CI) | ‐5.0 [‐14.80, 4.80] |
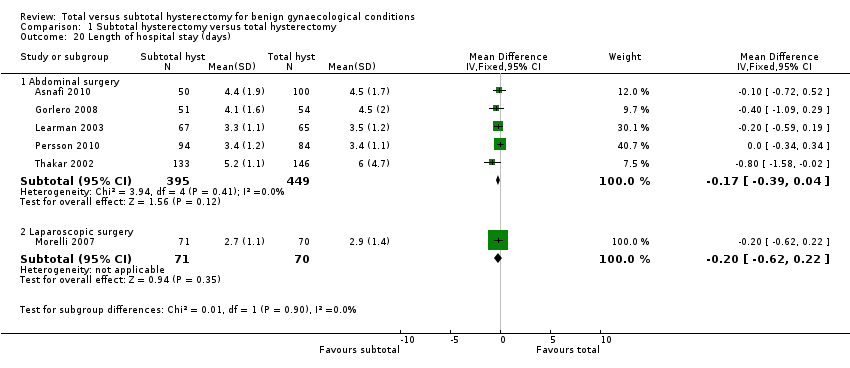
| 20 Length of hospital stay (days) Show forest plot | 6 | Mean Difference (IV, Fixed, 95% CI) | Subtotals only | |
| Analysis 1.20  Comparison 1 Subtotal hysterectomy versus total hysterectomy, Outcome 20 Length of hospital stay (days). | ||||
| 20.1 Abdominal surgery | 5 | 844 | Mean Difference (IV, Fixed, 95% CI) | ‐0.17 [‐0.39, 0.04] |
| 20.2 Laparoscopic surgery | 1 | 141 | Mean Difference (IV, Fixed, 95% CI) | ‐0.20 [‐0.62, 0.22] |
| 21 Return to normal activities (weeks) Show forest plot | 2 | Mean Difference (IV, Fixed, 95% CI) | Subtotals only | |
| Analysis 1.21  Comparison 1 Subtotal hysterectomy versus total hysterectomy, Outcome 21 Return to normal activities (weeks). | ||||
| 21.1 Abdominal surgery | 2 | 310 | Mean Difference (IV, Fixed, 95% CI) | ‐0.14 [‐0.53, 0.25] |
| 21.2 Laparoscopic surgery | 0 | 0 | Mean Difference (IV, Fixed, 95% CI) | 0.0 [0.0, 0.0] |
| 22 Requirement for blood transfusion Show forest plot | 5 | Odds Ratio (M‐H, Fixed, 95% CI) | Subtotals only | |
| Analysis 1.22  Comparison 1 Subtotal hysterectomy versus total hysterectomy, Outcome 22 Requirement for blood transfusion. | ||||
| 22.1 Abdominal surgery | 4 | 694 | Odds Ratio (M‐H, Fixed, 95% CI) | 1.24 [0.61, 2.54] |
| 22.2 Laparoscopic surgery | 1 | 141 | Odds Ratio (M‐H, Fixed, 95% CI) | 1.25 [0.32, 4.86] |
| 23 Blood loss during surgery (mls) Show forest plot | 4 | Mean Difference (IV, Fixed, 95% CI) | Subtotals only | |
| Analysis 1.23  Comparison 1 Subtotal hysterectomy versus total hysterectomy, Outcome 23 Blood loss during surgery (mls). | ||||
| 23.1 Abdominal surgery | 3 | 589 | Mean Difference (IV, Fixed, 95% CI) | ‐56.63 [‐99.58, ‐13.68] |
| 23.2 Laparoscopic surgery | 1 | 141 | Mean Difference (IV, Fixed, 95% CI) | ‐36.0 [‐145.35, 73.35] |
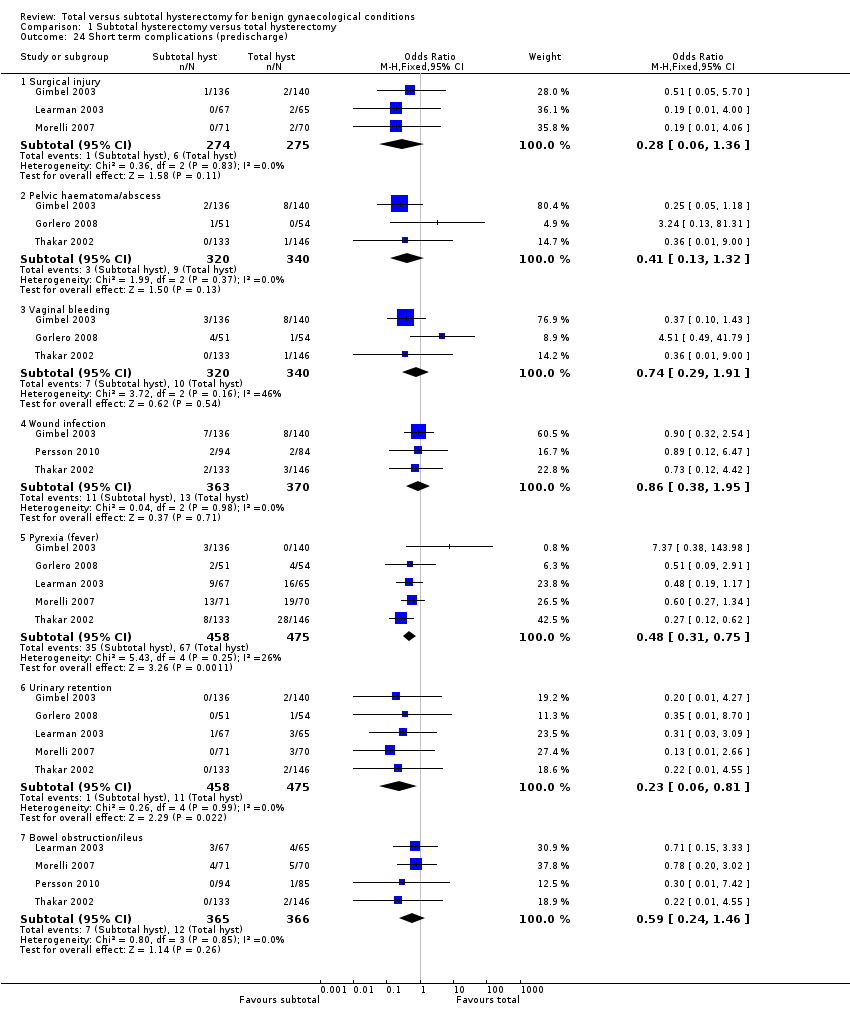
| 24 Short term complications (predischarge) Show forest plot | 6 | Odds Ratio (M‐H, Fixed, 95% CI) | Subtotals only | |
| Analysis 1.24  Comparison 1 Subtotal hysterectomy versus total hysterectomy, Outcome 24 Short term complications (predischarge). | ||||
| 24.1 Surgical injury | 3 | 549 | Odds Ratio (M‐H, Fixed, 95% CI) | 0.28 [0.06, 1.36] |
| 24.2 Pelvic haematoma/abscess | 3 | 660 | Odds Ratio (M‐H, Fixed, 95% CI) | 0.41 [0.13, 1.32] |
| 24.3 Vaginal bleeding | 3 | 660 | Odds Ratio (M‐H, Fixed, 95% CI) | 0.74 [0.29, 1.91] |
| 24.4 Wound infection | 3 | 733 | Odds Ratio (M‐H, Fixed, 95% CI) | 0.86 [0.38, 1.95] |
| 24.5 Pyrexia (fever) | 5 | 933 | Odds Ratio (M‐H, Fixed, 95% CI) | 0.48 [0.31, 0.75] |
| 24.6 Urinary retention | 5 | 933 | Odds Ratio (M‐H, Fixed, 95% CI) | 0.23 [0.06, 0.81] |
| 24.7 Bowel obstruction/ileus | 4 | 731 | Odds Ratio (M‐H, Fixed, 95% CI) | 0.59 [0.24, 1.46] |
| 25 Intermediate term complications (after discharge and within 2 years post surgery) Show forest plot | 5 | Odds Ratio (M‐H, Fixed, 95% CI) | Subtotals only | |
| Analysis 1.25  Comparison 1 Subtotal hysterectomy versus total hysterectomy, Outcome 25 Intermediate term complications (after discharge and within 2 years post surgery). | ||||
| 25.1 Ongoing cyclical bleeding | 5 | 964 | Odds Ratio (M‐H, Fixed, 95% CI) | 15.97 [6.14, 41.56] |
| 25.2 Persistent pain | 5 | 963 | Odds Ratio (M‐H, Fixed, 95% CI) | 0.90 [0.58, 1.38] |
| 25.3 Removal of cervical stump | 2 | 457 | Odds Ratio (M‐H, Fixed, 95% CI) | 5.14 [0.60, 44.35] |
| 25.4 Pelvic prolapse | 4 | 839 | Odds Ratio (M‐H, Fixed, 95% CI) | 2.74 [0.80, 9.34] |
| 25.5 Gynaecological cancer | 0 | 0 | Odds Ratio (M‐H, Fixed, 95% CI) | 0.0 [0.0, 0.0] |
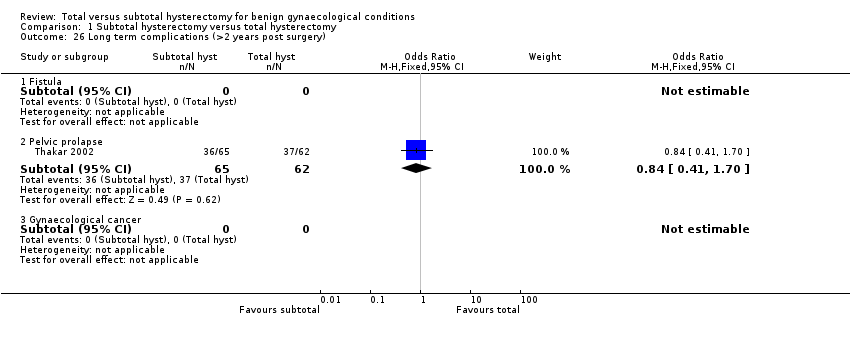
| 26 Long term complications (>2 years post surgery) Show forest plot | 1 | Odds Ratio (M‐H, Fixed, 95% CI) | Subtotals only | |
| Analysis 1.26  Comparison 1 Subtotal hysterectomy versus total hysterectomy, Outcome 26 Long term complications (>2 years post surgery). | ||||
| 26.1 Fistula | 0 | 0 | Odds Ratio (M‐H, Fixed, 95% CI) | 0.0 [0.0, 0.0] |
| 26.2 Pelvic prolapse | 1 | 127 | Odds Ratio (M‐H, Fixed, 95% CI) | 0.84 [0.41, 1.70] |
| 26.3 Gynaecological cancer | 0 | 0 | Odds Ratio (M‐H, Fixed, 95% CI) | 0.0 [0.0, 0.0] |
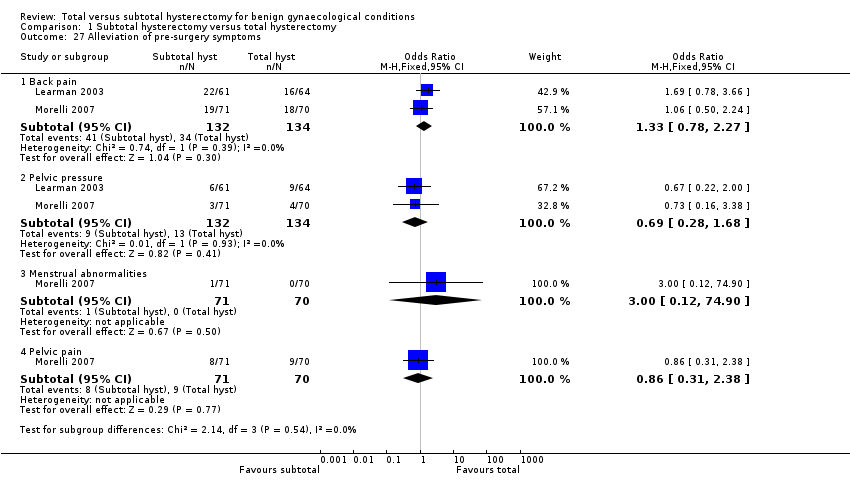
| 27 Alleviation of pre‐surgery symptoms Show forest plot | 2 | Odds Ratio (M‐H, Fixed, 95% CI) | Subtotals only | |
| Analysis 1.27  Comparison 1 Subtotal hysterectomy versus total hysterectomy, Outcome 27 Alleviation of pre‐surgery symptoms. | ||||
| 27.1 Back pain | 2 | 266 | Odds Ratio (M‐H, Fixed, 95% CI) | 1.33 [0.78, 2.27] |
| 27.2 Pelvic pressure | 2 | 266 | Odds Ratio (M‐H, Fixed, 95% CI) | 0.69 [0.28, 1.68] |
| 27.3 Menstrual abnormalities | 1 | 141 | Odds Ratio (M‐H, Fixed, 95% CI) | 3.00 [0.12, 74.90] |
| 27.4 Pelvic pain | 1 | 141 | Odds Ratio (M‐H, Fixed, 95% CI) | 0.86 [0.31, 2.38] |
| 28 Readmission rate (related to surgery) Show forest plot | 5 | Odds Ratio (M‐H, Fixed, 95% CI) | Subtotals only | |
| Analysis 1.28  Comparison 1 Subtotal hysterectomy versus total hysterectomy, Outcome 28 Readmission rate (related to surgery). | ||||
| 28.1 Abdominal surgery | 4 | 869 | Odds Ratio (M‐H, Fixed, 95% CI) | 1.10 [0.63, 1.91] |
| 28.2 Laparoscopic surgery | 1 | 141 | Odds Ratio (M‐H, Fixed, 95% CI) | 1.96 [0.68, 5.62] |

Methodological quality summary: review authors' judgements about each methodological quality item for each included study.

Risk of bias graph: review authors' judgements about each risk of bias item presented as percentages across all included studies.

Comparison 1 Subtotal hysterectomy versus total hysterectomy, Outcome 1 Prevalence of stress urinary incontinence within 2 years post surgery.

Comparison 1 Subtotal hysterectomy versus total hysterectomy, Outcome 2 Prevalence of stress urinary incontinence >2 years post surgery.

Comparison 1 Subtotal hysterectomy versus total hysterectomy, Outcome 3 Prevalence of incomplete bladder emptying within 2 years post surgery.

Comparison 1 Subtotal hysterectomy versus total hysterectomy, Outcome 4 Prevalence of incomplete bladder emptying >2 years post surgery.
Comparison 1 Subtotal hysterectomy versus total hysterectomy, Outcome 5 Prevalence of urinary urgency within 2 years post surgery.

Comparison 1 Subtotal hysterectomy versus total hysterectomy, Outcome 6 Prevalence of urinary urgency >2 years post surgery.
Comparison 1 Subtotal hysterectomy versus total hysterectomy, Outcome 7 Prevalence of constipation within 2 years post surgery.

Comparison 1 Subtotal hysterectomy versus total hysterectomy, Outcome 8 Prevalence of constipation >2 years post surgery.
Comparison 1 Subtotal hysterectomy versus total hysterectomy, Outcome 9 Prevalence of incontinence of stools within 2 years post surgery.

Comparison 1 Subtotal hysterectomy versus total hysterectomy, Outcome 10 Prevalence of incontinence of stools >2 years post surgery.
Comparison 1 Subtotal hysterectomy versus total hysterectomy, Outcome 11 Satisfaction with sex within 2 years post surgery.

Comparison 1 Subtotal hysterectomy versus total hysterectomy, Outcome 12 Satisfaction with sex >2 years post surgery.

Comparison 1 Subtotal hysterectomy versus total hysterectomy, Outcome 13 Satisfaction with sex (cont) within 2 years post surgery.

Comparison 1 Subtotal hysterectomy versus total hysterectomy, Outcome 15 Prevalence of pain during sex within 2 years post surgery.

Comparison 1 Subtotal hysterectomy versus total hysterectomy, Outcome 16 Prevalence of pain during sex >2 years post surgery.

Comparison 1 Subtotal hysterectomy versus total hysterectomy, Outcome 17 Quality of life within 2 years post abdominal surgery (high better).
Comparison 1 Subtotal hysterectomy versus total hysterectomy, Outcome 18 Quality of life within 2 years post abdominal surgery (low better).
Comparison 1 Subtotal hysterectomy versus total hysterectomy, Outcome 19 Operating time (mins).
Comparison 1 Subtotal hysterectomy versus total hysterectomy, Outcome 20 Length of hospital stay (days).

Comparison 1 Subtotal hysterectomy versus total hysterectomy, Outcome 21 Return to normal activities (weeks).

Comparison 1 Subtotal hysterectomy versus total hysterectomy, Outcome 22 Requirement for blood transfusion.

Comparison 1 Subtotal hysterectomy versus total hysterectomy, Outcome 23 Blood loss during surgery (mls).
Comparison 1 Subtotal hysterectomy versus total hysterectomy, Outcome 24 Short term complications (predischarge).

Comparison 1 Subtotal hysterectomy versus total hysterectomy, Outcome 25 Intermediate term complications (after discharge and within 2 years post surgery).
Comparison 1 Subtotal hysterectomy versus total hysterectomy, Outcome 26 Long term complications (>2 years post surgery).
Comparison 1 Subtotal hysterectomy versus total hysterectomy, Outcome 27 Alleviation of pre‐surgery symptoms.

Comparison 1 Subtotal hysterectomy versus total hysterectomy, Outcome 28 Readmission rate (related to surgery).
| Subtotal hysterectomy compared with total hysterectomy for benign gynaecological conditions | ||||||
| Patient or population: Women requiring hysterectomy for benign conditions Settings: Hospital Intervention: Subtotal hysterectomy Comparison: Total hysterectomy | ||||||
| Outcomes | Illustrative comparative risks* (95% CI) | Relative effect | No of Participants | Quality of the evidence | Comments | |
| Assumed risk | Corresponding risk | |||||
| [control] | [experimental] | |||||
| Prevalence of stress urinary incontinence within 2 years post surgery [follow‐up] | Low risk population | OR 1.45 (0.85 to 2.47) | 955 | ⊕⊕⊕⊝ | Stress incontinence was measured in most trials by questionnaire, but in Thakar it was more objectively determined by the use of twin‐channel subtracted cystometrography | |
| 52 per 1000 | 73 per 1000 | |||||
| Medium risk population | ||||||
| [value] per 1000 | [value] per 1000 | |||||
| High risk population | ||||||
| [value] per 1000 | [value] per 1000 | |||||
| Prevalence of constipation within 2 years post surgery [follow‐up] | Low risk population | OR 0.80 (0.49 to 1.31) | 555 | ⊕⊕⊝⊝ | Evaluated by questionnaire. Inconsistency between trials. | |
| [value] per 1000 | [value] per 1000 | |||||
| Medium risk population | ||||||
| 150 per 1000 | 126 per 1000 | |||||
| High risk population | ||||||
| [value] per 1000 | [value] per 1000 | |||||
| Satisfaction with sex within 2 years post surgery [follow‐up] | Low risk population | OR 1.04 (0.68 to 1.59) | 454 | ⊕⊕⊝⊝ | Evaluated by questionnaire. Inconsistency between trials may have resulted from different questions on sexual satisfaction being asked. | |
| [value] per 1000 | [value] per 1000 | |||||
| Medium risk population | ||||||
| [value] per 1000 | [value] per 1000 | |||||
| High risk population | ||||||
| 725 per 1000 | 736 per 1000 | |||||
| *The basis for the assumed risk (e.g. the median control group risk across studies) is provided in footnotes. The corresponding risk (and its 95% confidence interval) is based on the assumed risk in the comparison group and the relative effect of the intervention (and its 95% CI). | ||||||
| GRADE Working Group grades of evidence | ||||||
| Outcome or subgroup title | No. of studies | No. of participants | Statistical method | Effect size |
| 1 Prevalence of stress urinary incontinence within 2 years post surgery Show forest plot | 5 | 955 | Odds Ratio (M‐H, Fixed, 95% CI) | 1.45 [0.85, 2.47] |
| 1.1 Abdominal surgery | 4 | 826 | Odds Ratio (M‐H, Fixed, 95% CI) | 1.55 [0.86, 2.78] |
| 1.2 Laparoscopic surgery | 1 | 129 | Odds Ratio (M‐H, Fixed, 95% CI) | 1.05 [0.29, 3.82] |
| 2 Prevalence of stress urinary incontinence >2 years post surgery Show forest plot | 1 | 178 | Odds Ratio (M‐H, Fixed, 95% CI) | 1.15 [0.63, 2.08] |
| 2.1 Abdominal surgery | 1 | 178 | Odds Ratio (M‐H, Fixed, 95% CI) | 1.15 [0.63, 2.08] |
| 2.2 Laparoscopic surgery | 0 | 0 | Odds Ratio (M‐H, Fixed, 95% CI) | 0.0 [0.0, 0.0] |
| 3 Prevalence of incomplete bladder emptying within 2 years post surgery Show forest plot | 4 | 768 | Odds Ratio (M‐H, Fixed, 95% CI) | 0.94 [0.59, 1.47] |
| 3.1 Abdominal surgery | 3 | 639 | Odds Ratio (M‐H, Fixed, 95% CI) | 0.89 [0.55, 1.45] |
| 3.2 Laparoscopic surgery | 1 | 129 | Odds Ratio (M‐H, Fixed, 95% CI) | 1.28 [0.37, 4.44] |
| 4 Prevalence of incomplete bladder emptying >2 years post surgery Show forest plot | 1 | 173 | Odds Ratio (M‐H, Fixed, 95% CI) | 0.69 [0.37, 1.29] |
| 4.1 Abdominal surgery | 1 | 173 | Odds Ratio (M‐H, Fixed, 95% CI) | 0.69 [0.37, 1.29] |
| 4.2 Laparoscopic surgery | 0 | 0 | Odds Ratio (M‐H, Fixed, 95% CI) | 0.0 [0.0, 0.0] |
| 5 Prevalence of urinary urgency within 2 years post surgery Show forest plot | 2 | 254 | Odds Ratio (M‐H, Fixed, 95% CI) | 1.05 [0.47, 2.37] |
| 5.1 Abdominal surgery | 1 | 125 | Odds Ratio (M‐H, Fixed, 95% CI) | 0.86 [0.25, 2.99] |
| 5.2 Laparoscopic surgery | 1 | 129 | Odds Ratio (M‐H, Fixed, 95% CI) | 1.23 [0.42, 3.61] |
| 6 Prevalence of urinary urgency >2 years post surgery Show forest plot | 1 | 174 | Odds Ratio (M‐H, Fixed, 95% CI) | 1.26 [0.68, 2.32] |
| 6.1 Abdominal surgery | 1 | 174 | Odds Ratio (M‐H, Fixed, 95% CI) | 1.26 [0.68, 2.32] |
| 6.2 Laparoscopic surgery | 0 | 0 | Odds Ratio (M‐H, Fixed, 95% CI) | 0.0 [0.0, 0.0] |
| 7 Prevalence of constipation within 2 years post surgery Show forest plot | 2 | 555 | Odds Ratio (M‐H, Fixed, 95% CI) | 0.80 [0.49, 1.31] |
| 7.1 Abdominal surgery | 2 | 555 | Odds Ratio (M‐H, Fixed, 95% CI) | 0.80 [0.49, 1.31] |
| 7.2 Laparoscopic surgery | 0 | 0 | Odds Ratio (M‐H, Fixed, 95% CI) | 0.0 [0.0, 0.0] |
| 8 Prevalence of constipation >2 years post surgery Show forest plot | 1 | 165 | Odds Ratio (M‐H, Fixed, 95% CI) | 1.52 [0.67, 3.45] |
| 8.1 Abdominal surgery | 1 | 165 | Odds Ratio (M‐H, Fixed, 95% CI) | 1.52 [0.67, 3.45] |
| 8.2 Laparoscopic surgery | 0 | 0 | Odds Ratio (M‐H, Fixed, 95% CI) | 0.0 [0.0, 0.0] |
| 9 Prevalence of incontinence of stools within 2 years post surgery Show forest plot | 1 | 166 | Odds Ratio (M‐H, Fixed, 95% CI) | 0.52 [0.05, 5.83] |
| 9.1 Abdominal surgery | 1 | 166 | Odds Ratio (M‐H, Fixed, 95% CI) | 0.52 [0.05, 5.83] |
| 9.2 Laparoscopic surgery | 0 | 0 | Odds Ratio (M‐H, Fixed, 95% CI) | 0.0 [0.0, 0.0] |
| 10 Prevalence of incontinence of stools >2 years post surgery Show forest plot | 1 | 166 | Odds Ratio (M‐H, Fixed, 95% CI) | 0.52 [0.05, 5.83] |
| 10.1 Abdominal surgery | 1 | 166 | Odds Ratio (M‐H, Fixed, 95% CI) | 0.52 [0.05, 5.83] |
| 10.2 Laparoscopic surgery | 0 | 0 | Odds Ratio (M‐H, Fixed, 95% CI) | 0.0 [0.0, 0.0] |
| 11 Satisfaction with sex within 2 years post surgery Show forest plot | 2 | 454 | Odds Ratio (M‐H, Fixed, 95% CI) | 1.04 [0.68, 1.59] |
| 11.1 Abdominal surgery | 2 | 454 | Odds Ratio (M‐H, Fixed, 95% CI) | 1.04 [0.68, 1.59] |
| 11.2 Laparoscopic surgery | 0 | 0 | Odds Ratio (M‐H, Fixed, 95% CI) | 0.0 [0.0, 0.0] |
| 12 Satisfaction with sex >2 years post surgery Show forest plot | 1 | 131 | Odds Ratio (M‐H, Fixed, 95% CI) | 0.95 [0.13, 6.98] |
| 12.1 Abdominal hysterectomy | 1 | 131 | Odds Ratio (M‐H, Fixed, 95% CI) | 0.95 [0.13, 6.98] |
| 12.2 Laparoscopic hysterectomy | 0 | 0 | Odds Ratio (M‐H, Fixed, 95% CI) | 0.0 [0.0, 0.0] |
| 13 Satisfaction with sex (cont) within 2 years post surgery Show forest plot | 2 | 192 | Std. Mean Difference (IV, Fixed, 95% CI) | ‐0.15 [‐0.43, 0.13] |
| 13.1 Abdominal surgery | 1 | 129 | Std. Mean Difference (IV, Fixed, 95% CI) | ‐0.04 [‐0.39, 0.30] |
| 13.2 Laparoscopic surgery | 1 | 63 | Std. Mean Difference (IV, Fixed, 95% CI) | ‐0.37 [‐0.87, 0.13] |
| 14 Satisfaction with sex (cont) >2 years post surgery | 0 | 0 | Std. Mean Difference (IV, Fixed, 95% CI) | 0.0 [0.0, 0.0] |
| 14.1 Abdominal surgery | 0 | 0 | Std. Mean Difference (IV, Fixed, 95% CI) | 0.0 [0.0, 0.0] |
| 14.2 Laparoscopic surgery | 0 | 0 | Std. Mean Difference (IV, Fixed, 95% CI) | 0.0 [0.0, 0.0] |
| 15 Prevalence of pain during sex within 2 years post surgery Show forest plot | 2 | 452 | Odds Ratio (M‐H, Fixed, 95% CI) | 0.87 [0.46, 1.67] |
| 15.1 Abdominal surgery | 2 | 452 | Odds Ratio (M‐H, Fixed, 95% CI) | 0.87 [0.46, 1.67] |
| 15.2 Laparoscopic surgery | 0 | 0 | Odds Ratio (M‐H, Fixed, 95% CI) | 0.0 [0.0, 0.0] |
| 16 Prevalence of pain during sex >2 years post surgery Show forest plot | 1 | 133 | Odds Ratio (M‐H, Fixed, 95% CI) | 0.56 [0.25, 1.23] |
| 16.1 Abdominal surgery | 1 | 133 | Odds Ratio (M‐H, Fixed, 95% CI) | 0.56 [0.25, 1.23] |
| 16.2 Laparoscopic surgery | 0 | 0 | Odds Ratio (M‐H, Fixed, 95% CI) | 0.0 [0.0, 0.0] |
| 17 Quality of life within 2 years post abdominal surgery (high better) Show forest plot | 5 | Mean Difference (IV, Fixed, 95% CI) | Subtotals only | |
| 17.1 General (abdominal) | 3 | 478 | Mean Difference (IV, Fixed, 95% CI) | 0.35 [‐0.27, 0.97] |
| 17.2 Physical domain (abdominal) | 3 | 652 | Mean Difference (IV, Fixed, 95% CI) | ‐0.52 [‐2.18, 1.14] |
| 17.3 Mental domain (abdominal) | 4 | 831 | Mean Difference (IV, Fixed, 95% CI) | ‐0.61 [‐2.05, 0.82] |
| 18 Quality of life within 2 years post abdominal surgery (low better) Show forest plot | 2 | Mean Difference (IV, Fixed, 95% CI) | Subtotals only | |
| 18.1 General (abdominal) | 1 | 179 | Mean Difference (IV, Fixed, 95% CI) | ‐1.0 [‐4.92, 2.92] |
| 18.2 Anxiety (abdominal) | 1 | 179 | Mean Difference (IV, Fixed, 95% CI) | 0.20 [‐2.68, 3.08] |
| 18.3 Depression (abdominal and laparoscopic) | 2 | 242 | Mean Difference (IV, Fixed, 95% CI) | ‐0.27 [‐1.55, 1.00] |
| 18.4 Psychological domain (laparoscopic) | 1 | 63 | Mean Difference (IV, Fixed, 95% CI) | ‐2.0 [‐15.66, 11.66] |
| 19 Operating time (mins) Show forest plot | 5 | Mean Difference (IV, Fixed, 95% CI) | Subtotals only | |
| 19.1 Abdominal surgery | 4 | 694 | Mean Difference (IV, Fixed, 95% CI) | ‐11.26 [‐15.07, ‐7.45] |
| 19.2 Laparoscopic surgery | 1 | 141 | Mean Difference (IV, Fixed, 95% CI) | ‐5.0 [‐14.80, 4.80] |
| 20 Length of hospital stay (days) Show forest plot | 6 | Mean Difference (IV, Fixed, 95% CI) | Subtotals only | |
| 20.1 Abdominal surgery | 5 | 844 | Mean Difference (IV, Fixed, 95% CI) | ‐0.17 [‐0.39, 0.04] |
| 20.2 Laparoscopic surgery | 1 | 141 | Mean Difference (IV, Fixed, 95% CI) | ‐0.20 [‐0.62, 0.22] |
| 21 Return to normal activities (weeks) Show forest plot | 2 | Mean Difference (IV, Fixed, 95% CI) | Subtotals only | |
| 21.1 Abdominal surgery | 2 | 310 | Mean Difference (IV, Fixed, 95% CI) | ‐0.14 [‐0.53, 0.25] |
| 21.2 Laparoscopic surgery | 0 | 0 | Mean Difference (IV, Fixed, 95% CI) | 0.0 [0.0, 0.0] |
| 22 Requirement for blood transfusion Show forest plot | 5 | Odds Ratio (M‐H, Fixed, 95% CI) | Subtotals only | |
| 22.1 Abdominal surgery | 4 | 694 | Odds Ratio (M‐H, Fixed, 95% CI) | 1.24 [0.61, 2.54] |
| 22.2 Laparoscopic surgery | 1 | 141 | Odds Ratio (M‐H, Fixed, 95% CI) | 1.25 [0.32, 4.86] |
| 23 Blood loss during surgery (mls) Show forest plot | 4 | Mean Difference (IV, Fixed, 95% CI) | Subtotals only | |
| 23.1 Abdominal surgery | 3 | 589 | Mean Difference (IV, Fixed, 95% CI) | ‐56.63 [‐99.58, ‐13.68] |
| 23.2 Laparoscopic surgery | 1 | 141 | Mean Difference (IV, Fixed, 95% CI) | ‐36.0 [‐145.35, 73.35] |
| 24 Short term complications (predischarge) Show forest plot | 6 | Odds Ratio (M‐H, Fixed, 95% CI) | Subtotals only | |
| 24.1 Surgical injury | 3 | 549 | Odds Ratio (M‐H, Fixed, 95% CI) | 0.28 [0.06, 1.36] |
| 24.2 Pelvic haematoma/abscess | 3 | 660 | Odds Ratio (M‐H, Fixed, 95% CI) | 0.41 [0.13, 1.32] |
| 24.3 Vaginal bleeding | 3 | 660 | Odds Ratio (M‐H, Fixed, 95% CI) | 0.74 [0.29, 1.91] |
| 24.4 Wound infection | 3 | 733 | Odds Ratio (M‐H, Fixed, 95% CI) | 0.86 [0.38, 1.95] |
| 24.5 Pyrexia (fever) | 5 | 933 | Odds Ratio (M‐H, Fixed, 95% CI) | 0.48 [0.31, 0.75] |
| 24.6 Urinary retention | 5 | 933 | Odds Ratio (M‐H, Fixed, 95% CI) | 0.23 [0.06, 0.81] |
| 24.7 Bowel obstruction/ileus | 4 | 731 | Odds Ratio (M‐H, Fixed, 95% CI) | 0.59 [0.24, 1.46] |
| 25 Intermediate term complications (after discharge and within 2 years post surgery) Show forest plot | 5 | Odds Ratio (M‐H, Fixed, 95% CI) | Subtotals only | |
| 25.1 Ongoing cyclical bleeding | 5 | 964 | Odds Ratio (M‐H, Fixed, 95% CI) | 15.97 [6.14, 41.56] |
| 25.2 Persistent pain | 5 | 963 | Odds Ratio (M‐H, Fixed, 95% CI) | 0.90 [0.58, 1.38] |
| 25.3 Removal of cervical stump | 2 | 457 | Odds Ratio (M‐H, Fixed, 95% CI) | 5.14 [0.60, 44.35] |
| 25.4 Pelvic prolapse | 4 | 839 | Odds Ratio (M‐H, Fixed, 95% CI) | 2.74 [0.80, 9.34] |
| 25.5 Gynaecological cancer | 0 | 0 | Odds Ratio (M‐H, Fixed, 95% CI) | 0.0 [0.0, 0.0] |
| 26 Long term complications (>2 years post surgery) Show forest plot | 1 | Odds Ratio (M‐H, Fixed, 95% CI) | Subtotals only | |
| 26.1 Fistula | 0 | 0 | Odds Ratio (M‐H, Fixed, 95% CI) | 0.0 [0.0, 0.0] |
| 26.2 Pelvic prolapse | 1 | 127 | Odds Ratio (M‐H, Fixed, 95% CI) | 0.84 [0.41, 1.70] |
| 26.3 Gynaecological cancer | 0 | 0 | Odds Ratio (M‐H, Fixed, 95% CI) | 0.0 [0.0, 0.0] |
| 27 Alleviation of pre‐surgery symptoms Show forest plot | 2 | Odds Ratio (M‐H, Fixed, 95% CI) | Subtotals only | |
| 27.1 Back pain | 2 | 266 | Odds Ratio (M‐H, Fixed, 95% CI) | 1.33 [0.78, 2.27] |
| 27.2 Pelvic pressure | 2 | 266 | Odds Ratio (M‐H, Fixed, 95% CI) | 0.69 [0.28, 1.68] |
| 27.3 Menstrual abnormalities | 1 | 141 | Odds Ratio (M‐H, Fixed, 95% CI) | 3.00 [0.12, 74.90] |
| 27.4 Pelvic pain | 1 | 141 | Odds Ratio (M‐H, Fixed, 95% CI) | 0.86 [0.31, 2.38] |
| 28 Readmission rate (related to surgery) Show forest plot | 5 | Odds Ratio (M‐H, Fixed, 95% CI) | Subtotals only | |
| 28.1 Abdominal surgery | 4 | 869 | Odds Ratio (M‐H, Fixed, 95% CI) | 1.10 [0.63, 1.91] |
| 28.2 Laparoscopic surgery | 1 | 141 | Odds Ratio (M‐H, Fixed, 95% CI) | 1.96 [0.68, 5.62] |