Bifosfonatos para la enfermedad de Paget del hueso en adultos
Resumen
Antecedentes
Los bifosfonatos se consideran el tratamiento de elección para los pacientes con la enfermedad de Paget del hueso. Sin embargo, los efectos de los bifosfonatos sobre los resultados centrados en el paciente no se han estudiado ampliamente. No hay datos suficientes para determinar si la reducción y el mantenimiento de los marcadores bioquímicos del recambio óseo dentro de los límites normales mejora la calidad de vida y reduce el riesgo de complicaciones.
Objetivos
Evaluar los efectos beneficiosos y perjudiciales de los bifosfonatos para los pacientes adultos con enfermedad de Paget del hueso.
Métodos de búsqueda
Se realizaron búsquedas en el Registro Cochrane Central de Ensayos Controlados (Cochrane Central Register of Controlled Trials, CENTRAL), MEDLINE, Embase, ISI Web of Knowledge y en los registros de ensayos hasta marzo 2017. Se buscó en la información publicada por el organismo regulador para detectar eventos adversos poco frecuentes.
Criterios de selección
Ensayos controlados aleatorizados (ECA) de bifosfonatos como tratamiento para la enfermedad de Paget en adultos.
Obtención y análisis de los datos
Dos autores de la revisión de forma independiente examinaron los resultados de la búsqueda, extrajeron los datos y evaluaron el riesgo de sesgo. Se utilizaron los procedimientos metodológicos estándar previstos por la Colaboración Cochrane.
Resultados principales
Se incluyeron 20 ensayos (25 informes, 3168 participantes). De éstos, diez ensayos (801 participantes) compararon bifosfonatos (etidronato, tiludronato, ibandronato, pamidronato, olpadronato, alendronato, risedronato, zoledronato) versus placebo, siete compararon dos bifosfonatos (992 participantes), un ensayo comparó un bifosfonato con un bifosfonato más calcitonina (44 participantes), y dos estudios, el ensayo más grande (1331 participantes) y su estudio de extensión de la intervención (502 participantes), compararon el tratamiento sintomático y el tratamiento intensivo, en el que el objetivo fue normalizar la fosfatasa alcalina.
La mayoría de los estudios se evaluaron como riesgo de sesgo bajo o incierto. Seis de los diez estudios que compararon los bifosfonatos con placebo se evaluaron como alto riesgo de sesgo, principalmente debido a los datos de resultados incompletos y al informe de resultados selectivos.
Las poblaciones participantes fueron razonablemente homogéneas en cuanto a la edad (media de edad 66 a 74 años) y el sexo (del 51% al 74% hombres). La mayoría de los estudios incluyeron participantes que tenían niveles elevados de fosfatasa alcalina, independientemente de que tuvieran o no dolor óseo. El periodo de seguimiento fue de seis meses.
Bifosfonatos orales versus placebo
Los bifosfonatos triplicaron la proporción (31% versus 9%) de participantes cuyo dolor óseo desapareció (RR 3,42; intervalo de confianza [IC] del 95%: 1,31 a 8,90; dos estudios, 205 participantes; NNT 5; IC del 95%: 1 a 31; evidencia de calidad moderada). Este resultado es clínicamente importante. Los datos fueron consistentes cuando se midió el cambio en el dolor como cualquier reducción (RR 1,97; IC del 95%: 1,29 a 3,01; siete estudios, 481 participantes).
Hubo incertidumbre sobre las diferencias en las fracturas incidentes: El 1,4% de las fracturas ocurrieron en el grupo de bifosfonatos y ninguna en el grupo placebo (RR 0,89; IC del 95%: 0,18 a 4,31; cuatro estudios, 356 participantes; evidencia de calidad muy baja).
Ninguno de los estudios informó datos sobre la cirugía ortopédica, la calidad de vida o los umbrales de audición.
Los resultados relativos a los efectos adversos y la interrupción del tratamiento no fueron claros. Hubo un riesgo del 64% de eventos adversos gastrointestinales leves en los participantes del grupo de intervención y del 48% en el grupo control (RR 1,32; IC del 95%: 0,91 a 1,92; seis estudios, 376 participantes; evidencia de calidad baja). La probabilidad de que los participantes del estudio interrumpieran el estudio debido a los efectos adversos fue ligeramente mayor en los participantes del grupo de intervención (4,4%) que en el grupo control (4,1%) (RR 1,01; IC del 95%: 0,41 a 2,52; seis estudios, 517 participantes; evidencia de calidad baja). El zoledronato se asoció con un mayor riesgo de fiebre o fatiga transitoria (RR 2,57; IC del 95%: 1,21 a 5,44; un estudio, 176 participantes; evidencia de calidad moderada).
Bifosfonatos versus comparador activo
Más participantes informaron alivio del dolor con zoledronato que con pamidronato (RR 1,30; IC del 95%: 1,10 a 1,53; un estudio, 89 participantes; NNT 5; IC del 95%: 3 a 11) o con risedronato (RR 1,36; IC del 95%: 1,06 a 1,74; un estudio, 347 participantes; NNT 7; IC del 95%: 4 a 24; evidencia de calidad muy baja). Este resultado es clínicamente importante.
No hubo evidencia suficiente para confirmar o excluir las diferencias en los efectos adversos de los bifosfonatos (RR 1,05; IC del 95%: 0,95 a 1,76; dos estudios, 437 participantes; evidencia de calidad baja) y la interrupción del tratamiento (dos estudios, 437 participantes) (RR 2,04; IC del 95%: 0,43 a 9,59; dos estudios, 437 participantes; evidencia de calidad muy baja).
Tratamiento intensivo versus tratamiento sintomático
No hubo evidencia consistente de diferencias en la respuesta al dolor óseo, al dolor corporal o a la calidad de vida en los participantes que recibieron tratamiento intensivo frente a sintomático.
Se observaron resultados no concluyentes en relación con las fracturas y los procedimientos ortopédicos para el tratamiento intensivo frente al sintomático (tratamiento intensivo de la fractura: RR 1,84; IC del 95%: 0,76 a 4,44; riesgo absoluto 8,1% versus 5,2%; procedimientos ortopédicos: RR 1,58; IC del 95%: 0,80 a 3,11; riesgo absoluto 5,6% versus 3,0%; un estudio, 502 participantes; evidencia de calidad baja).
No hubo evidencia suficiente para confirmar o excluir una diferencia importante en los efectos adversos entre el tratamiento intensivo y el sintomático (RR 1,05; IC del 95%: 0,79 a 1,41; evidencia de calidad baja).
No hubo evidencia suficiente para confirmar o excluir una diferencia importante de riesgo de eventos adversos poco frecuentes (incluida la osteonecrosis de la mandíbula) de las bases de datos de los organismos reguladores.
Conclusiones de los autores
Se encontró evidencia de calidad moderada de que los bifosfonatos mejoraron el dolor en los pacientes con enfermedad de Paget del hueso, en comparación con placebo. No existe certeza sobre los resultados de los estudios directos que investigaron los bifosfonatos. No se encontró evidencia suficiente de los efectos beneficiosos en cuanto al dolor o calidad de vida del tratamiento intensivo. La información sobre los efectos adversos fue limitada, pero los efectos secundarios graves fueron poco frecuentes y la tasa de retiros debido a efectos secundarios fue baja.
PICO
Resumen en términos sencillos
Bifosfonatos para la enfermedad de Paget del hueso en adultos
Pregunta de la revisión
Se deseaba averiguar si la administración de tratamiento con bifosfonatos fue mejor o peor que el tratamiento simulado (placebo) para aliviar el dolor óseo en pacientes con enfermedad de Paget ósea, y determinar si el tratamiento podría prevenir las complicaciones. También se deseaba descubrir qué bisfosfonatos son mejores.
¿Qué es la enfermedad de Paget del hueso y qué son los bisfosfonatos?
La enfermedad de Paget del hueso es un problema crónico que suele afectar a uno o unos pocos huesos. La enfermedad de Paget hace que la renovación y reparación de los huesos se vuelva anormal; los huesos se debilitan, se agrandan y se deforman, lo que provoca dolor, fracturas y artritis en las articulaciones cercanas a los huesos afectados.
Los bifosfonatos son medicamentos que retrasan el proceso de remodelación ósea.
Fecha de la búsqueda
Marzo 2017.
Características de los estudios
Se incluyeron 20 estudios con 3168 pacientes. De estos, diez estudios (801 pacientes) compararon los bifosfonatos con placebo. Los estudios incluyeron pacientes de edad avanzada; un ligeramente más participantes fueron hombres; y casi todos tenían elevados los marcadores séricos de recambio óseo. Catorce estudios reclutaron participantes de hospitales, consultorios ambulatorios y de medicina general. Se realizaron estudios en los EE.UU., Canadá, el Reino Unido, Europa, Australia, Nueva Zelanda y Argentina.
¿Cuáles son los efectos de los bisfosfonatos en los pacientes con enfermedad de Paget del hueso?
Los bifosfonatos probablemente ayudan a aliviar el dolor óseo. No existe certeza sobre qué bisfosfonato es mejor. Los resultados fueron similares en todos los estudios.
No existe certeza sobre si los bifosfonatos puedan prevenir las fracturas óseas.
Los efectos sobre la calidad de vida, la necesidad de cirugía ortopédica y la prevención de la pérdida de audición no se informaron en los estudios que compararon los bifosfonatos con placebo.
¿Cuáles son los efectos secundarios de los bisfosfonatos en los pacientes con enfermedad de Paget del hueso?
La mayoría de los estudios no informaron detalles sobre los efectos secundarios y las complicaciones relacionadas con los fármacos. Los bifosfonatos pueden tener poca o ninguna diferencia sobre los efectos secundarios, excepto por la fiebre temporal o el cansancio con los tratamientos intravenosos, así como los efectos secundarios gastrointestinales leves con los medicamentos orales. Los efectos secundarios graves que causaron la interrupción del tratamiento fueron poco frecuentes.
¿Qué le pasa a los pacientes con enfermedad de Paget del hueso tratados con bifosfonatos?
Dolor
Se encontró que de 100 adultos con enfermedad de Paget del hueso, 31 experimentarían un alivio completo del dolor si tomaran bifosfonatos durante seis meses, en comparación con nueve pacientes que no tomaran bifosfonatos.
Efectos secundarios
Se encontró que de 100 adultos con enfermedad de Paget del hueso, 64 experimentarían efectos secundarios si tomaran bifosfonatos durante seis meses, en comparación con 48 que no los tomaran.
El número de pacientes que interrumpieron el tratamiento debido a los efectos secundarios fue el mismo para los grupos de bifosfonato y placebo (cuatro de 100).
Calidad de la evidencia
Los datos sobre el alivio del dolor proporcionaron evidencia de calidad moderada, pero los datos sobre las fracturas se evaluaron como evidencia de calidad muy baja. Los datos sobre los efectos secundarios proporcionaron evidencia de calidad baja; los datos sobre la interrupción del tratamiento proporcionaron evidencia de calidad moderada. La calidad de la evidencia se disminuyó principalmente por los datos limitados y las preocupaciones sobre el diseño de los estudios.
Fuentes de financiación de los estudios
Once estudios fueron financiados por los fabricantes del medicamento. Cuatro estudios fueron financiados por organismos gubernamentales o de beneficencia. En cinco estudios no se proporcionaron datos sobre las fuentes de financiación, o fueron poco claros.
Authors' conclusions
Summary of findings
| Bisphosphonates versus placebo for Paget's disease of bone | ||||||
| Patient or population: Paget's disease of bone Comparison: Placebo | ||||||
| Outcomes | Anticipated absolute effects* (95% CI) | Relative effect | № of participants | Quality of the evidence | Comments | |
| Risk with placebo | Risk with bisphosphonates | |||||
| Number of participants with change in bone pain (disappearance of pain)¹ | Study population | RR 3.42 | 205 | ⊕⊕⊕⊝ | NNTB 5 (1 to 35) Absolute risk difference: 23% more (12% to 34%) Relative percent change: 242 % (31% to 790%) (Improvement) | |
| 91 per 1000 | 311 per 1000 | |||||
| Number of participants who experienced radiologically‐confirmed fractures | Low (study population)³ | RR 0.89 | 356 | ⊕⊝⊝⊝ | Absolute risk difference: 1% more (‐2% to 5%) Relative percentage change: 11% (‐82% to 331%) (improvement) Effect is uncertain due to very low quality evidence | |
| 0 per 1000 | 0 per 1000 | |||||
| Moderate³ | ||||||
| 9 per 1000 | 8 per 1000 (2 to 39) | |||||
| High³ | ||||||
| 52 per 1000 | 46 per 1000 (9 to 224) | |||||
| Number of participants who needed orthopaedic surgery (not measured) | See comments | See comments | Not estimable | 0 (0 RCTs) | See comments | Outcome not reported in the included studies |
| Number of participants with change in quality of life measures (not measured) | See comments | See comments | Not estimable | 0 (0 RCTs) | See comments | Outcome not reported in the included studies |
| Number of participants with change in hearing thresholds (not measured) | See comments | See comments | Not estimable | 0 (0 RCTs) | See comments | Outcome not reported in the included studies |
| Number of participants who experienced side effects related to use of bisphosphonates | Study population | RR 1.32 | 678 | ⊕⊕⊝⊝ | Absolute risk difference: 11% more (0% to 22%) Relative percent change: 32 % (‐10% to 92%) (worsening) Gastrointestinal side effects (diarrhoea, dyspepsia, vomiting, nausea, oesophagitis or gastritis) were the most common | |
| 483 per 1000 | 638 per 1000 | |||||
| Number of participants who withdrew due to adverse events | Study population | RR 1.01 | 517 | ⊕⊕⊝⊝ | Absolute risk difference: 0% (‐4% to 3%) Relative percent change: 1% (‐59% to 152%) (worsening) | |
| 41 per 1000 | 41 per 1000 | |||||
| *The risk in the intervention group (and its 95% CI) is based on the assumed risk in the comparison group and the relative effect of the intervention (and its 95% CI). | ||||||
| GRADE Working Group grades of evidence | ||||||
| ¹ When pain was assessed as any pain reduction instead of disappearance of pain, the outcomes were consistent: 227 per 1000 in placebo vs. 446 per 1000 (292 to 682) in bisphosphonates group (RR 1.97, 95% CI 1.29 to 3.01), NNTD 4 (2 to 13), absolute risk difference 33% more (18% to 49%), relative percentage change 97% (29% to 201% improvement), based on results from seven RCTs (481 participants). Visual analogue scale ranging from 0 to 10 was used in four of the seven studies. One study classified pain in three groups; the tool used for pain assessment was not detailed in the other two studies. Moderate quality evidence: downgraded by one level; there was high risk for attrition bias in three studies and high risk for reporting bias in three studies. The outcome did not change in a sensitive analysis excluding high risk of bias studies. ² Downgraded by one level (imprecision). Few events, resulting in wide CI. ³ The 0% calculated assumed risk in the control group (no fractures in placebo group) is misleading. This outcome is likely due to the short follow‐up period of the studies. To give a more accurate data we have added two scenarios of moderate and high prevalence using data from a study with a longest follow‐up period, the PRISM‐EZ trial (Tan 2017). In summary there are three scenarios to calculate the assumed risk in the control group: 1) To calculate low prevalence we used data from the included studies (placebo groups). 2) To calculate moderate prevalence we used the percentage of fractures in bones affected by Paget's disease of bone in the symptomatic treatment arm of the PRISM‐EZ trial. 3) To calculate high prevalence we used the percentage of fractures in both affected and unaffected bones in the symptomatic treatment arm of the PRISM‐EZ trial. ⁴ Downgraded by two levels (limitation of studies). Most data were from studies assessed at high risk of bias; there was high risk for attrition bias in two studies and high risk for reporting bias in one study. ⁵ Downgraded by one level (indirectness). Long‐term impact on fractures was not assessed. ⁶ Downgraded by one level (limitation of studies). High risk for attrition bias in two studies. ⁷ Downgraded by one level (inconsistency). The side effects considered in the studies were heterogeneous. In addition, considerable heterogeneity was found when the six studies were meta‐analysed (I² = 75%, P = 0.001). However, only one study (McClung 1995) showed more adverse events in the placebo group than the bisphosphonates group. The heterogeneity could not be explained by differences in design of this study since it was similar to other studies. A sensitivity analysis excluding this study found low heterogeneity I² = 6% (RR 1.38, 95% CI 1.08 to 1.78). ⁸ Downgraded by two levels. Half of the included studies were assessed at high risk of bias; there was high risk for attrition bias in three studies and high risk for reporting bias in one study. ⁹ Rated down for imprecision. Optimal information size criterion was not met. The 95% CI is too wide. | ||||||
| Zoledronate versus pamidronate or risedronate for Paget's disease of bone | ||||||
| Patient or population: Paget's disease of bone | ||||||
| Outcomes | Anticipated absolute effects* (95% CI) | Relative effect | № of participants | Quality of the evidence | Comments | |
| Risk with pamidronate or risedronate | Risk with zoledronate | |||||
| Number of participants with change in bone pain¹ | Study population | RR 1.31 | 436 | ⊕⊝⊝⊝ | NNTB: 7 (4 to 14) Absolute risk difference: 17% (8% to 26%) Relative percent change: 31% (15% to 51%) (improvement) Not pooled effects: Zoledronate vs. pamidronate (89 participants); RR 1.30 (1.10 to 1.53), NNTB 4 (3 to 13). Zoledronate vs. risedronate (347 participants); RR 1.36 (1.06 to 1.74), NNTB 8 (4 to 45). | |
| 465 per 1000 | 609 per 1000 | |||||
| Number of participants who experienced fractures (not measured) | See comments | See comments | Not estimable | 0 (0 RCTs) | See comments | Outcome not reported in the included studies |
| Number of participants who needed orthopaedic surgery (not measured) | See comments | See comments | Not estimable | 0 (0 RCTs) | See comments | Outcome not reported in the included studies |
| Number of participants with change in quality of life measures (not measured) | See comments | See comments | Not estimable | 0 (0 RCTs) | See comments | Effect is uncertain. Zoledronate showed a marginal improvement at 6 months in QoL when compared with risedronate. The physical component summary score of SF‐36 improved with zoledronate compared to risedronate (1.6 vs. 0.3 change from baseline score, on a 0 to 100 scale). This result is unlikely to be of clinical importance |
| Number of participants with change in hearing thresholds (not measured) | See comments | See comments | Not estimable | 0 (0 RCTs) | See comments | Outcome not reported in the included studies |
| Number of participants who experienced side effects related to use of bisphosphonates. | Study population | RR 1.05 | 437 | ⊕⊕⊝⊝ | Absolute risk difference: 4% (‐4% to 12%) Relative percent change: 5% (‐5% to 16%) (worsening) | |
| 745 per 1000 | 782 per 1000 | |||||
| Number of participants who withdrew due to adverse events (withdrawals) | Study population | RR 2.04 | 437 | ⊕⊝⊝⊝ | Absolute risk difference: 1% (‐2% to 3%) Relative percent change: 104% (‐57% to 859%) (worsening) | |
| 9 per 1000 | 18 per 1000 | |||||
| *The risk in the intervention group (and its 95% CI) is based on the assumed risk in the comparison group and the relative effect of the intervention (and its 95% CI). | ||||||
| GRADE Working Group grades of evidence | ||||||
| ¹Unlike summary of findings Table for the main comparison (comparing bisphosphonates vs. placebo) when compared zoledronate vs pamidronate or risedronate we used any change of pain instead of disappearance of pain because data were not available. However, readers could find data on disappearance of pain in the original zoledronate vs. pamidronate manuscript (Merlotti 2007) [10/47 vs. 6/60, RR 2.12 95% IC 0.83‐5.43]. We did not include these data because we think they are misleading. They come from accumulate zoledronate effects in two different study phases (30 zoledronate patients from phase 1 + 17 patients no responders to pamidronate in phase 1 treated with zoledronate in phase 2) vs. pamidronate in only one study phase (60 patients). ² Downgraded by two levels (limitation of studies). Information is from studies at high risk of bias. High risk for performance bias in 1 study and high risk for reporting bias in 1 study. ³ Downgraded by one level (indirectness). In the risedronate study, the author assessed bodily pain but not bone pain associated directly with Paget's bone lesions (Change in bone pain was defined as"5‐point improvement from baseline" in SF‐36 bodily pain item). In the pamidronate study change in bone pain was defined as "subjects reported disappearance or decrease in pain". ⁴Downgraded by one level (imprecision). There were few events, resulting in wide CI, | ||||||
Background
Description of the condition
Paget's disease of bone is a common disorder characterised by focal areas of increased and disorganised bone remodeling affecting one or more bones throughout the skeleton. Paget's disease preferentially targets the axial skeleton, most frequently affecting the pelvis (70% of cases), femur (55%), lumbar spine (53%), skull (42%) and tibia (32%) (Ralston 2013). Paget's disease of bone is rare before the age of 55 years, but increases in prevalence thereafter, affecting about 5% of women and 8% of men by the eighth decade of life in the United Kingdom (Van Staa 2002). The incidence and prevalence rates of Paget's disease of bone vary widely, but both have decreased in most regions over recent years. The changes are heterogeneous among and within countries; the largest changes have occurred in areas that previously had high prevalence (Corral‐Gudino 2013).
Paget's disease of bone is a cause of substantial morbidity in people who come to medical attention. Up to 50% of these people experience complications such as bone pain, bone deformity, pathologic fracture, deafness and secondary osteoarthritis that adversely affect quality of life (Tan 2014; Van Staa 2002). People with Paget's disease of bone run a significantly increased risk of developing osteoarthritis (Van Staa 2002) and their need for hip replacement is substantially higher than among age‐matched controls (Van Staa 2002). Osteosarcoma (malignant bone tumour) is a rare complication; however, virtually all osteosarcomas found in adults aged over 60 years occur in people with Paget's disease of bone (Sandberg 2003). Other uncommon complications of Paget's disease of bone include spinal stenosis (narrowing of the spinal canal), internal hydrocephalus (raised pressure within the brain), basilar impression (compression at the base of the skull affecting the spinal cord and blood flow to the brain) or cranial nerve deficits and other nerve compression syndromes (Selby 2002).
Description of the intervention
Medical therapy is based on drugs that inhibit the increased osteoclastic bone resorption that characterises Paget's disease of bone. Bisphosphonates are considered to be the treatment of choice for people with Paget's disease of bone because they are highly effective in suppressing elevated bone turnover. The principal indication for anti‐resorptive therapy is localised bone pain thought to be caused by increased metabolic activity (Selby 2002).
How the intervention might work
Bisphosphonates share a common phosphorous‐carbon‐phosphorous core to which various chemical side chains are attached. These side chains have a profound effect on the anti‐resorptive potency of bisphosphonates and on the mechanism by which osteoclast inhibition occurs. Non‐aminobisphosphonates, such as etidronate, clodronate or tiludronate, are relatively weak anti‐resorptive agents; nitrogen‐containing bisphosphonates (aminobisphosphonates) are much more powerful.
Bisphosphonates selectively bind to mineral surfaces in bone. During the process of bone resorption, bisphosphonates are internalised by osteoclasts and interfere with osteoclast survival and bone resorptive function. Non‐aminobisphosphonates are metabolically incorporated into non‐hydrolysable analogues of adenosine triphosphate, which interfere with adenosine triphosphate‐dependent intracellular pathways. These compounds inhibit formation of adenosine triphosphate in the osteoclast, thereby depleting intracellular energy stores and promoting apoptosis (programmed cell death) (Frith 2001). Aminobisphosphonates such as alendronate, neridronate, pamidronate, olpadronate, ibandronate, risedronate, or zoledronate, are much more potent than non‐aminobisphosphonates and act by inhibiting the enzyme farnesyl pyrophosphate synthase. Aminobisphosphonate‐mediated inhibition of this enzyme disrupts signalling pathways in osteoclasts, leading to failure of their resorptive function and cell death.
Aminobisphosphonates have greater inhibitory effects on bone turnover in Paget's disease of bone than non‐aminobisphosphonates and offer the prospect of reducing bone turnover to normal levels in a greater proportion of people than is possible with non‐aminobisphosphonates (Miller 1999; Siris 1996). Bone biopsy studies have shown that aminobisphosphonates therapy can restore the architecture of newly formed bone to normal (Siris 1996b). This raises the possibility that the more potent bisphosphonates, by giving greater inhibitor of bone turnover, may be able to prevent long‐term complications of the disease such as progression of deafness, bone deformity, fractures and progression of osteoarthritis.
Why it is important to do this review
Many experts believe that bisphosphonate therapy should be administered with the aim of normalising bone turnover in the hope this will arrest disease progression and prevent the development of some complications such as facial deformity, deafness when the skull base is affected, and spinal cord dysfunction in people with spinal Paget's disease of bone (Selby 2002). However, there are insufficient data to determine whether maintaining alkaline phosphatase levels within the normal range reduces the risk of complications. There is no evidence that people who are asymptomatic benefit from anti‐resorptive therapy (Langston 2010).
This review aimed to gather published evidence to inform us if bisphosphonate therapy improves clinical outcomes or prevents complications, apart from the known effect, over the biochemical markers of bone turnover.
Objectives
To assess the benefits and harms of bisphosphonates for adult patients with Paget's disease of bone.
Methods
Criteria for considering studies for this review
Types of studies
We included all randomised controlled trials (RCTs) or controlled clinical trials (CCTs) comparing bisphosphonate versus placebo or other active treatment for Paget's disease of bone in adults, including those that compared regimens of bisphosphonates aimed to normalise biochemical markers of bone turnover with those that did not.
Types of participants
Participants aged 18 years and over with Paget's disease of bone confirmed by plain radiographs or isotope bone scintigraphy (Selby 2002).
Types of interventions
The experimental intervention was defined as the use of bisphosphonates including non‐aminobisphosphonates (etidronate, clodronate or tiludronate) or aminobisphosphonates (alendronate, neridronate, pamidronate, olpadronate, ibandronate, risedronate or zoledronate).
The comparators were defined as placebo or other interventions including calcitonin, comparisons between non‐aminobisphosphonates and aminobisphosphonates; comparisons between different aminobisphosphonates, or comparisons among different treatment strategies using bisphosphonates.
We compared:
-
bisphosphonates versus placebo;
-
bisphosphonates versus calcitonin;
-
bisphosphonates versus bisphosphonates:
-
non‐aminobisphosphonates;
-
aminobisphosphonates and non‐aminobisphosphonates;
-
different aminobisphosphonates;
-
-
bisphosphonates regimens that aimed to normalise elevated bone turnover with those that did not (intensive versus non‐intensive treatment); and
-
bisphosphonates versus bisphosphonates plus calcitonin.
We considered calcium, vitamin D supplementation and analgesics as co‐interventions if use was equally available to all treatment groups.
The planned analysis according time points (3 or 6 months from the start of treatment; 1, 2, 3, 4 or more years from the start of treatment; and at the end of the trial) were not performed because nearly all included trials had only six months follow‐up.
Types of outcome measures
Major outcomes
We included assessment of the following patient‐oriented evidence.
-
Change in pain:
-
we included studies reporting any of the following tools for measuring pain: visual analogue scales (VAS), nominal scales or pain domains in generic quality of life measures (e.g. 'bodily pain' in the Short‐Form Health Survey (SF‐36));
-
we included only evaluations of pain rated by the participant and excluded physician‐rated evaluations;
-
we measured change in pain as a continuous variable whenever possible. Whenever pain was assessed as the number of participants with improved bone pain from baseline, we considered the following categories:
-
complete reduction of pain (reduction from baseline is 100%);
-
complete/partial reduction of pain (reduction from baseline ≥ 50%, up to and including complete reduction);
-
any reduction in pain.
-
-
-
Number of participants experiencing radiologically‐confirmed clinical fractures. Pathological fractures are uncommon (5.7%) and need long follow‐up to be assessed adequately (Tan 2014). We considered follow‐up periods longer than one year to properly assess this outcome.
-
Number of participants who underwent orthopaedic surgery.
-
Change in quality of life:
-
we included studies reporting use of tools for measuring generic quality of life including the Medical Outcomes Study (MOS), SF‐36, EuroQoL five dimensions questionnaire (EQ‐5D) and tools for measuring arthritis‐specific quality of life including the arthritis‐specific version of the SF‐36, and Stanford Health Assessment Questionnaire (HAQ) disability Index.
-
we measured change in quality of life as a continuous variable whenever possible. Whenever quality of life was assessed as the number of participants with improved quality of life from baseline, we considered any improvement in quality of life.
-
-
Change in hearing thresholds or degree of deafness:
-
we included studies reporting audiometric assessment and hearing threshold examinations;
-
we measured change in hearing thresholds or degree of deafness measured as a continuous variable whenever possible;
-
we also considered the number of participants who received hearing aids as an assessment of degree of deafness.
-
-
Number of participants experiencing adverse events related to use of bisphosphonates. We considered the following as serious adverse events: symptomatic hypocalcaemia, oesophagitis, oesophageal cancer, osteonecrosis of the jaw, osteonecrosis of the external auditory canal, uveitis, arrhythmias, atypical fracture and renal failure. We considered influenza‐like symptoms as a mild adverse events. Influenza‐like symptoms include myalgia, pyrexia, nausea, diarrhoea, dyspepsia, abdominal pain, headache, bone pain and fatigue.
-
Number of participants who withdrew due to adverse events.
Minor outcomes
For patient‐oriented evidence, we considered numbers of participants who relapsed due to recurrence of bone pain. For disease‐oriented evidence, we included:
-
mean percentage change from baseline in serum total alkaline phosphatase activity. We also recorded the number of participants who achieved normalised alkaline phosphatase levels; and
-
number of participants who relapsed due to recurrence of increased alkaline phosphatase level.
We did not consider data on radiographic changes or microscopic structure changes as outcomes following bisphosphonate therapy.
Search methods for identification of studies
Electronic searches
We searched:
-
MEDLINE (1946 to 3 March 2017) (Appendix 1);
-
Embase (1980 to 3 March 2017) (Appendix 2);
-
Cochrane Central Register of Controlled Trials (CENTRAL) (all issues to 3 March 2017) (Appendix 3);
-
ISI Web of Knowledge (all years to 8 March 2017) (Appendix 4).
We used the 'Cochrane Highly Sensitive Search Strategy for identifying randomised trials in MEDLINE: sensitivity‐maximising version (2008 revision); Ovid format' for identifying randomised trials as proposed in the Cochrane Handbook for Systematic Reviews of Interventions (Higgins 2011). For Embase, we used a combination of the search filters for identifying randomised trials listed in the Cochrane Handbook for Systematic Reviews of Interventions (Higgins 2011). We set no year, language or country of publication restrictions.
Searching other resources
We screened the reference lists of all included articles to identify additional eligible studies. We focused on systematic reviews and meta‐analyses and reference lists from identified RCTs to identify further relevant studies.
We searched the ISRCTN registry on metaRegister of Controlled Trials (mRCT) and ClinicalTrials.gov to identify ongoing trials (Date of last search: 20 February 2017). The mRCT includes the International Clinical Trials Registry Platform (ICTRP) of the World Health Organization (WHO) and the United Kingdom Clinical Trials Gateway (UKCTG).
We also handsearched for abstracts presented from 2010 to 2016 at scientific meetings from the following societies and included those with sufficient information in the body of the abstract:
-
American Society for Bone and Mineral Research;
-
International Bone and Mineral Society;
-
International Osteoporosis Foundation/European Society for Clinical and Economic Aspects of Osteoporosis and Osteoarthritis; and
-
European Calcified Tissue Society.
In accordance with Cochrane Musculoskeletal Group recommendations we searched the websites of the regulatory agencies to broaden our search for specific and rare adverse events: USA Food and Drug Administration MedWatch (FDA), European Medicines Agency (EMA), and the UK Medicines and Healthcare products Regulatory Agency pharmacovigilance and drug safety updates (MHRA) using the terms 'Paget's' and 'bisphosphonate' (Date of last search for the regulatory agencies websites: 22 February 2017). We also searched in the Australian Adverse Drug Reactions Bulletin (AADRB) [published from 1995 to 2009 and available at https://www.tga.gov.au/publication/australian‐adverse‐drug‐reactions‐bulletin] and in the Australian Therapeutic Goods Administration website (Date of last search: 22 February 2017).
Data collection and analysis
Selection of studies
Three review authors (AT, LCG, JdPM) independently assessed results from searches of electronic databases to identify potentially‐relevant articles based on title or title and abstract. We retrieved the full manuscripts of potentially‐relevant articles for further assessment. Review authors (AT and LCG; JdPM and LCG) screened the selected articles independently against the inclusion criteria. We resolved any differences of opinion during the selection process by discussion and consensus, or by consulting a third review author (SHR) if needed.
Data extraction and management
Two review authors (AT, LCG) extracted relevant data using a pre‐defined data collection form designed according to guidelines from the Cochrane Handbook for Systematic Reviews of Interventions (Higgins 2011). One review author (AT) who was involved in data extraction was also an author of a primary study (PRISM‐EZ trial Tan 2017). Because authors of primary studies should not extract data from their own studies, we recruited an additional reviewer (JdPM) who extracted trial data from Tan 2017.
We extracted the following data:
-
Study identification: author, year of publication, journal.
-
Characteristics of the trial: study design, calculation of sample size before the study, use of intention‐to‐treat analysis, setting or location, number of centres, country, period of study, follow‐up period, outcomes, methods of randomisation, allocation concealment and blinding.
-
Study inclusion and exclusion criteria.
-
Participants' characteristics: age, gender, presence of monostotic disease, whether treated previously for Paget's disease of bone, symptomatic participants, numbers who were randomised and excluded (post‐randomisation), reasons for exclusion, participants assessed, withdrawals and reasons for withdrawals.
-
Characteristics of intervention: drug analysed, comparator, dosage, duration of treatment, co‐interventions.
-
Risk of bias assessment.
-
Outcome data (Types of outcome measures).
-
Source of funding.
-
Conflicts of interest.
We created a specific database to carry out the data extraction process. We resolved any differences of opinion during the data extraction process by discussion and consensus or discussion with a third author (SHR).
When data were neither available from the original manuscript, nor following requests to authors, data were directly extracted from figures in the manuscript using a vector graphics editor.
Assessment of risk of bias in included studies
Two authors (AT, LCG) assessed the risk of bias in included studies independently as recommended by the Cochrane Handbook for Systematic Reviews of Interventions (Higgins 2011).
We assessed the following methodological domains.
-
Adequate sequence generation (checking for possible selection bias): were methods used to generate the allocation sequence for each included study reported in sufficient detail to enable assessment of whether groups were comparable.
-
Adequate measures to conceal allocation (checking for possible selection bias): were methods used to conceal the allocation sequence for each included study reported in sufficient detail and we could determine whether intervention allocation could have been foreseen in advance or during recruitment, or changed after assignment.
-
Blinding of study participants and study researchers (checking for possible performance bias): were methods used to blind participants and study researchers from knowledge of which intervention a participant received for each included study reported.
-
Blinding of outcome assessors (checking for possible detection bias): were methods used to blind outcome assessors from knowledge of which intervention a participant received for each included study reported.
-
Incomplete outcome data (checking for possible attrition bias through withdrawals, dropouts, protocol deviations): the completeness of data including attrition and exclusions from the analysis was assessed. We stated whether attrition and exclusions were reported; the numbers included in the analysis at each stage (compared with the total randomised participants); reasons for attrition or exclusion where reported; and whether missing data were balanced across groups or were related to outcomes. We did not consider that a high attrition rate was a source of bias if an intention‐to‐treat (ITT) analysis was performed. Where sufficient information was reported or could be supplied by the study authors, we re‐included missing data in the analyses which we undertook.
-
Selective outcome reporting (checking for possible reporting bias): differences, if any, between the planned protocol analysis data and the reported data for each included study, to look for unreported findings.
-
Other potential threats to validity (considering external validity, e.g. relevant use of co‐intervention).
Each of these criteria were explicitly judged as 'low risk, 'high risk or 'unclear risk' of bias.
We assessed the likely overall magnitude of the bias for each included study and whether it was likely to impact on the findings. We elaborated a summary assessment of the risk of bias for each outcome. In order to assess the risk of bias within a study, we evaluated adequate sequence generation, allocation sequence concealment and incomplete outcome data as key domains for all the outcomes. We evaluated blinding of study participants and study researchers as key domains for change in pain, reporting of adverse events and change in quality of life. We did not consider blinding as a key domain for assessing the risk of bias for fractures, receiving orthopaedic surgery, change in hearing thresholds and total alkaline phosphate activity. Other potential threats to validity such as the use of analgesics as co‐interventions were considered a key domain for changes in pain and quality of life.
For each outcome, we considered low risk of bias to be present across studies when most information was from studies assessed at low risk. We considered high risk of bias across studies when the proportion of information from studies at high risk of bias was sufficient to affect the interpretation of results. Lastly, we considered unclear risk of bias when most information was from studies at low or unclear risk of bias.
We resolved any difference of opinion during the assessment of risk of bias process by discussion and achieving consensus. For disagreements not resolved by consensus, we consulted a third review author (SHR).
Measures of treatment effect
For dichotomous outcomes, we estimated the effect of treatment across trials using the risk ratios (RRs) with the corresponding 95% confidence intervals (CIs). For significant outcomes, we computed the number needed to treat to benefit (NNTB) one participant or the number needed to treat to harm (NNTH) one participant as the inverse of the pooled risk differences (RDs).
Our dichotomous outcomes were numbers of participants who:
-
experienced adverse events;
-
experienced radiologically‐confirmed clinical fractures;
-
received orthopaedic surgery;
-
withdrew due to adverse events;
-
relapsed due to recurrence of bone pain; and
-
relapsed due to recurrence of increased serum alkaline phosphatase level.
Where continuous scales of measurement were used to assess the effects of treatment, we used the mean difference (MD) with the corresponding 95% CI. If different scales were used to measure an outcome, we calculate the standardised mean difference (SMD).
Our continuous outcomes were:
-
change in pain;
-
change in quality of life;
-
change in hearing thresholds; and
-
mean percentage change from baseline in serum total alkaline phosphatase activity.
Unit of analysis issues
The unit of analysis was individual people undergoing treatment for Paget's disease of bone. We included only RCTs and CCTs, and we were not expecting studies with non‐standard designs such as cross‐over trials.
For studies with more than one intervention group, such as different doses of the same bisphosphonate, we combined data from the experimental intervention groups to create a single pair‐wise comparison versus the control group.
Dealing with missing data
When outcome data were not available from trials, we contacted the primary investigators of the eligible trials. We contacted study authors using email addresses published in the studies. When there was no response from the study author, we analysed the available data only, ignoring missing data, because we assumed that data were missing at random.
We performed a sensitivity analysis according to the missing data to assess the robustness of our assumption that data were missing data at random (Sensitivity analysis). We addressed the potential impact of missing data on findings in the Discussion.
Assessment of heterogeneity
We computed global estimates for each variable effect by meta‐analysing study single effect measures (RR for dichotomous variables and MD or SMD for continuous variables) using Review Manager 2014. Before calculating estimates of effect, we assessed the presence and degree of heterogeneity using the I² statistic to describe the percentage of variability in effect estimates due to heterogeneity rather than chance. We categorised I² values greater than 75% as considerable heterogeneity (Higgins 2011).
We undertook a narrative review of potential heterogeneity according to variability in populations, interventions, outcomes and settings.
Assessment of reporting biases
Because we anticipated inclusion of several studies with small sample sizes, we assessed the likely impact on our findings of small‐study effects (tendency for estimates of the intervention effect to be more beneficial in smaller studies) by using inverted funnel plot techniques. We planned to construct funnel plots when there were at least 10 included studies in comparisons. However, none of the comparisons included 10 studies, so funnel plots could not be constructed. We provided a narrative summary of potential small‐study effect in the Discussion.
Data synthesis
We used Review Manager 2014 for data synthesis. Quantitative synthesis was planned if more than one eligible study was identified. Where appropriate, we calculated a pooled estimate of treatment effect across similar studies for each pre‐specified outcome. We estimated overall effect by meta‐analysis using a random‐effects model. We did not conduct meta‐analysis if there was considerable heterogeneity (I² > 75%) (Higgins 2011). We calculated RRs and 95% CIs for dichotomous data. We calculated the number needed to treat to provide an indication for each dichotomous outcome, reflecting the number of participants required to obtain a beneficial outcome with the intervention. For continuous data measured on the same scale, we calculated MDs. When different scales were used, we calculated SMDs. When possible, we analysed data using an intention‐to‐treat (ITT) model.
We used the mean and standard deviation when available. If only median and interquartile ranges were reported, we followed guidance from the Cochrane Handbook for Systematic Reviews of Interventions (Higgins 2011), where the median was used as the mean and the standard deviation was set as 1.35. If no standard deviation was given at the end of the study, we used the baseline standard deviation at the end as well.
We undertook a narrative review of eligible studies where statistical synthesis of data from more than one study was not possible or appropriate.
Although we included different bisphosphonates whose comparisons against placebo which together create a network (Figure 1), we did not perform a network meta‐analysis. The reason for this was that tor the major outcome of change in pain, heterogeneity within studies in the definition of 'change in pain' did not allow us to conduct a meaningful network meta‐analysis. For the other major outcomes, such as fractures or orthopaedic surgery, there were few comparisons between bisphosphonates.
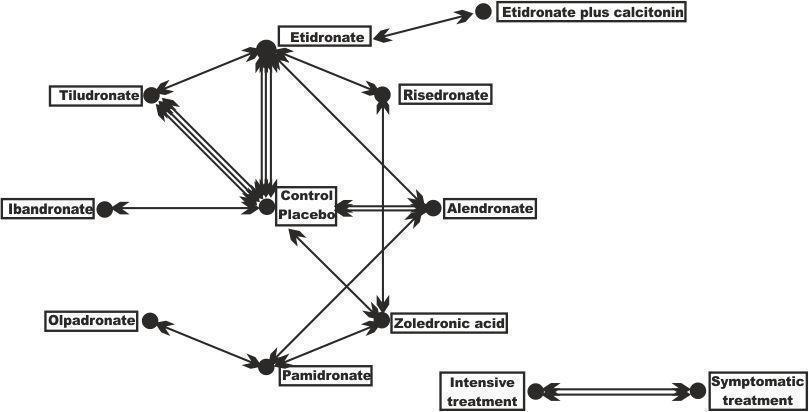
Geometry of the network of randomised trials of bisphosphonates for Paget's disease of bone. The nodes of the network represent the treatments compared. The links reflect comparisons and the number of links is proportional to the number of comparisons
Subgroup analysis and investigation of heterogeneity
Neither of the planned subgroup analyses: symptomatic bone pain versus those who were asymptomatic; and biochemically active (raised alkaline phosphatase) Paget's disease of bone versus non‐biochemically active Paget's disease of bone (normal alkaline phosphatase) were possible.
Sensitivity analysis
We planned to perform the following sensitivity analyses:
-
To determine the robustness of pooled effect estimate in terms of risk of bias by including or excluding studies with high or unclear risk of bias from the comparative analysis.
-
To determine the robustness of the pooled effect estimate in terms of missing data by including or excluding studies with high levels of missing data, more than 20% of missing data for the overall trial population, or for any of the trial arms from the comparative analysis.
-
To determine the robustness of the pooled effect estimate in terms of withdrawals by performing either worst‐case scenario sensitivity analysis (all withdrawal data treated as negative events) or the same‐as‐control scenario sensitivity analysis, where the rate of negative events in the withdrawal data were the same as in the control group.
'Summary of findings' table
We evaluated the quality of the evidence using the GRADE approach and developed 'Summary of findings' tables (Guyatt 2008). These tables have the following three elements:
-
the outcomes most relevant to people (critical and important outcomes according to GRADE);
-
a summary measure for the quality of the evidence (confidence in estimate of a treatment effect); and
-
a summary estimate for the RR and absolute effect for the interventions of interest.
The seven important outcomes that we considered for the 'Summary of findings' tables were numbers of participants:
-
with change in bone pain;
-
who experienced severe side effects related to use of aminobisphosphonates;
-
who experienced fractures;
-
who needed orthopaedic surgery;
-
with change in quality of life measures including bodily pain;
-
with change in hearing thresholds; and
-
who withdrew due to adverse events.
We used GRADEpro GDT 2015 to create 'Summary of findings' tables.
Results
Description of studies
See: Characteristics of included studies; Characteristics of excluded studies; Characteristics of ongoing studies.
Results of the search
Quantity of research available
The literature search identified 2781 potentially‐relevant records (Figure 2). Of these, 63 full text articles were retrieved for further assessment for inclusion.
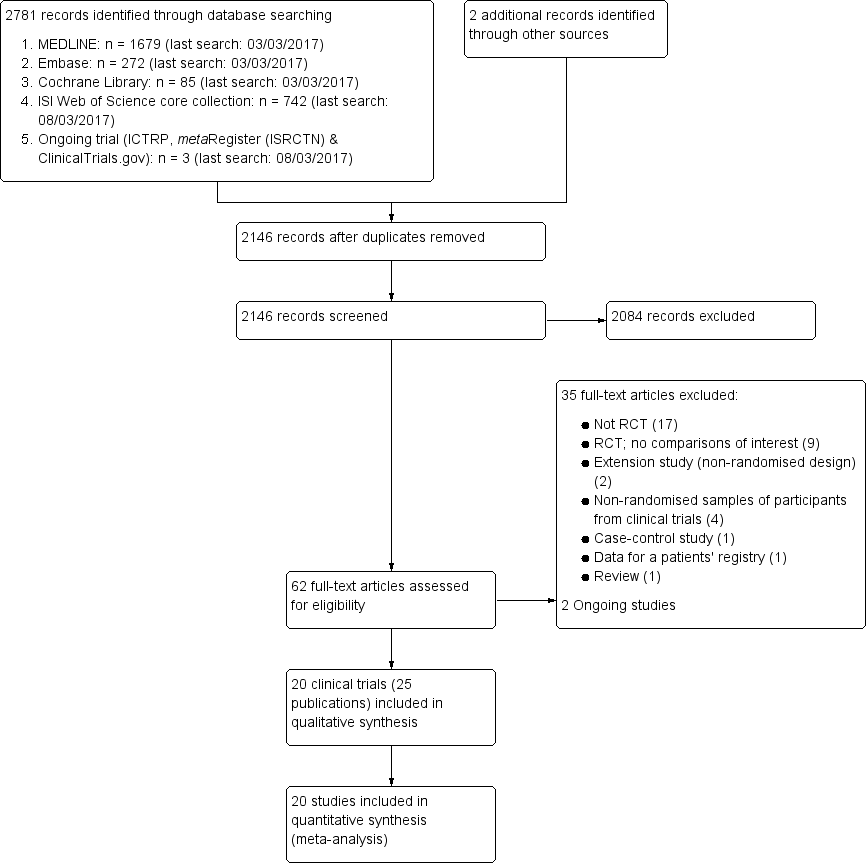
Study flow diagram
Inconsistent or missing information
We attempted to contact most study authors to request additional information or to clarify inconsistencies. Appendix 5 presents the status of requests to study authors for further information or clarification.
Included studies
We included 20 trials (25 references) that met our selection criteria. Sixteen individual studies with a single reference, (Altman 1973; Canfield 1977; Fraser 1997; Langston 2010; McClung 1995; Merlotti 2007; Miller 1999; O'Doherty 1992; O'Donoghue 1987; Ralston 1987; Reginster 1992; Reid 1996; Roux 1995; Siris 1996; Tan 2017Walsh 2004) 3 studies with two references (Barreira 2009; Buckler 1999; Reid 2004) and 1 study with 3 references (Reid 2005).
The trials involved a total of 3168 participants. All included studies were published in English language. One trial was published only as an abstract (Barreira 2009).
Characteristics of included studies
See Characteristics of included studies.
We included 10 studies (801 participants) that compared bisphosphonates and placebo (Altman 1973; Buckler 1999; Canfield 1977; Fraser 1997; McClung 1995; O'Doherty 1992; Ralston 1987; Reginster 1992; Reid 1996; Reid 2004). One study (234 participants) compared two non‐aminobisphosphonates (Roux 1995). Two studies (212 participants) compared non‐aminobisphosphonates and aminobisphosphonates (Miller 1999; Siris 1996). Four studies (546 participants) compared two aminobisphosphonates (Barreira 2009; Merlotti 2007; Reid 2005; Walsh 2004). One study (44 participants) compared etidronate and etidronate plus calcitonin (O'Donoghue 1987). One study compared intensive treatment (aimed at normalising alkaline phosphatase) and symptomatic treatment (aimed at treating bone pain) (PRISM trial Langston 2010; 1331 participants). An extension of Langston 2010 (PRISM‐EZ trial Tan 2017; 502 participants) investigated the effects of these treatment strategies for up to 7.3 years. PRISM‐EZ is described separately in Characteristics of included studies because although the study was defined by the authors as an extension study, it was an interventional extension study (rather than an observational extension study) where the researchers continued intensive or symptomatic treatment as in the core study. In this case, zoledronate was used as the treatment of first choice in the extension as compared with risedronate in the PRISM study.
None of the included studies used a run in period.
The different comparisons investigated by the studies are represented in Figure 1. The sample sizes ranged from 15 to 1331 participants; 11 studies included fewer than 100 participants. Only Langston 2010 included more than 1000 participants. Sample size calculations were performed in advance of the study for only five trials (Fraser 1997; Langston 2010; Reid 2005; Roux 1995; Walsh 2004).
The study populations were reasonably homogeneous in terms of participants' age and gender. A summary of the principal characteristics of trial samples is provided in Table 1. Participants' mean age ranged from 66 years to 74 years, the percentage of males ranged from 51% to 74%, and the percentage of symptomatic participants ranged from 63% to 100%. Nearly all participants had raised serum total alkaline phosphatase, but one study (Langston 2010) included participants with normal alkaline phosphatase at baseline (707/1324; 53%). Alkaline phosphatase was normal at baseline in participants who were enrolled into an extension of the Langston 2010 study (Tan 2017) (355/502; 71%). The percentage of symptomatic participants (defined as those with pain due to Pagetic bone lesions) ranged from 66% to 100%; this information was not recorded for about half the included studies.
| Study ID | Intervention | Comparator | Alkaline phosphatase | Follow‐up | N | Age | Male | Symptomatic | Previously treated |
| Etidronate | Placebo | Yes | 6 m | 50 | 67 y | 60% | NA | NA | |
| Etidronate | Placebo | Yes | 6 m | 48 | NA | 58% | NA | NA | |
| Etidronate | Placebo | No | 3 m | 32 | NA | NA | 100% | 38% | |
| Tiludronate | Placebo | Yes | 6 m | 112 | 70 y | 54% | 63% | NA | |
| Tiludronate | Placebo | Yes | 6 m | 139 | 70 y | 54% | NA | NA | |
| Tiludronate | Placebo | Yes | 6 m | 149 | 69 y | 54% | NA | 82% | |
| Alendronate | Placebo | Yes | 6 m | 15 | 67 y | 60% | 87% | 66% | |
| Alendronate | Placebo | Yes | 6 m | 55 | 70 y | 56% | NA | 35% | |
| Zoledronate | Placebo | Yes | 3 m | 176 | 71 y | 61% | NA | NA | |
| Ibandronate | Placebo | Yes | 6 m | 25 | 73 y | 74% | NA | 64% | |
| Tiludronate | Etidronate | Yes | 6m | 234 | 69y | 59% | 74% | 71% | |
| Alendronate | Etidronate | Yes | 6m | 89 | 69y | 67% | NA | 25% | |
| Risedronate | Etidronate | Yes | 12 m | 123 | 66 y | 69% | 91% | 72% | |
| Alendronate | Pamidronate | Yes | 12 m | 72 | 70 y | 58% | 94% | 39% | |
| Olpadronate | Pamidronate | Yes | 6 m | 27 | NA | NA | NA | NA | |
| Zoledronate | Pamidronate | Yes | 6 m | 90 | 70 y | 69% | 99% | 67% | |
| Zoledronate | Risedronate | Yes | 6 m | 357 | 70 y | 68% | NA | 54% | |
| Etidronate + calcitonin | Etidronate | Yes | 12 m | 44 | NA | NA | 100% | 10% | |
| Intensive | Symptomatic | No | 3 y | 1331 | 74 y | 51% | 69% | NA | |
| Intensive | Symptomatic | No | 3 y | 502 | 76 y | 55% | 63% | 70% |
Alkaline phosphatase: Serum total alkaline phosphatase above the upper limit of normal as an inclusion criterion. Follow‐up: Extended follow‐up periods are shown in parentheses. N: Number of randomised participants. NA: Not available. SC: Sample size calculated before study.
For all but one study (Langston 2010) and its extension (Tan 2017) the primary outcome was change in serum total alkaline phosphatase activity. Most studies did not include the major outcomes (bone fracture, need for orthopaedic surgery, change in quality of life or hearing thresholds) of primary interest in this review.
Thirteen studies had six months of follow‐up; two studies (Buckler 1999; Ralston 1987) had only three months follow‐up. Another three studies (Miller 1999; O'Donoghue 1987; Walsh 2004) had 12 months of follow up. The authors of the Reid 2004 study published long‐term follow‐up data (nearly 10 years), but analysis of these data was limited due to change in the initial randomisation allocation (see Characteristics of included studies). The PRISM study (intensive versus symptomatic treatment, Langston 2010) was an event‐driven trial with an average of three years follow‐up (range 2 years to 5 years). In PRISM‐EZ, Tan 2017 followed up participants for an additional three years (total of 7.3 years follow‐up). An extension to the comparison of zoledronate and risedronate followed up participants for up to 6.5 years but these were a select group who had normalised alkaline phosphatase during the core study (Reid 2005).
Study funding sources
Eleven included studies were funded by drug manufacturers. Of these, four were co‐funded by government agencies or charities. Although a further three studies reported funding by government agencies or charities, the study drugs were supplied by drug manufacturers. One article was funded only by government agencies. Funding sources were not mentioned or unclear in five studies.
Excluded studies
We excluded 35 studies: 17 were non‐randomised clinical trials (Adami 1994; Altman 1985; Arlot 1981; Atkins 1987; Cundy 2016; Dewis 1985; Filipponi 1994; Gallacher 1991; Grauer 1999; Gutteridge 1996; Hosking 1976; Khairi 1977; Mazeries 1996; O'Doherty 1995; Pepersack 1994; Russell 1974; Stone 1990); nine were RCTs that lacked comparisons of interest for this review (Adami 2002; Buckler 1998; Delmas 1982; Hooper 2009; Khan 1997; Merlotti 2011; Reginster 1988; Reginster 1993; Vega 1994); two were non‐randomised extension studies (Khairi 1974; Siris 1980); four were non‐randomised samples of participants from clinical trials (Devogelaer 1997; Garnero 1998; Garnero 2001; Goldman 1975); one was a case control study (Donáth 2004); one provided data for a patient registry (Devogelaer 2014); and one was a review (Lombardi 1999).
Ongoing studies
We identified two ongoing studies (NCT02106455; ISRCTN11616770). These studies will be assessed for inclusion in a future update of this review.
Risk of bias in included studies
For details on the risk of bias of included studies see Characteristics of included studies. For an overview of review authors' judgements about each risk of bias item for individual and across all studies see Figure 3 and Figure 4.
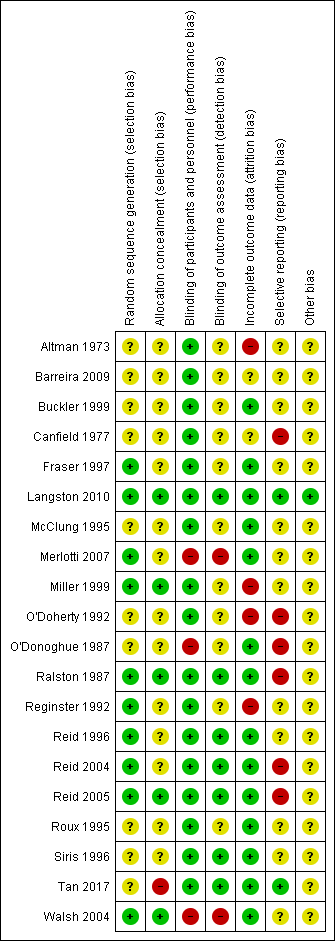
Risk of bias summary: review authors' judgements about each risk of bias item for each included study
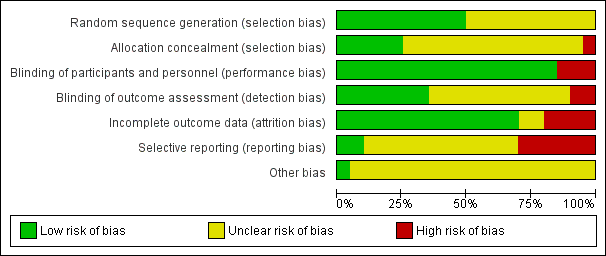
Risk of bias graph: review authors' judgements about each risk of bias item presented as percentages across all included studies
Allocation
The generation of the random sequence for allocation was considered to be adequate in 10 studies (low risk of bias; Fraser 1997; Langston 2010; Merlotti 2007; Miller 1999; Ralston 1987; Reginster 1992; Reid 1996; Reid 2004; Reid 2005; Walsh 2004). Risk of bias was judged as unclear in the remainder (Altman 1973; Barreira 2009; Buckler 1999; Canfield 1977; McClung 1995; O'Doherty 1992; O'Donoghue 1987; Roux 1995; Siris 1996; Tan 2017). Allocation concealment was considered adequate in only six studies (low risk of bias; Langston 2010; Miller 1999; Ralston 1987; Reid 2005; Tan 2017; Walsh 2004) and judged as unclear in the remainder (Altman 1973; Barreira 2009; Buckler 1999; Canfield 1977; Fraser 1997; McClung 1995; Merlotti 2007; O'Doherty 1992; O'Donoghue 1987; Reginster 1992; Reid 1996; Reid 2004; Roux 1995; Siris 1996). No included studies were considered to be at high risk of bias for this domain.
Blinding
Fifteen studies were double‐blinded (Altman 1973; Barreira 2009; Buckler 1999; Canfield 1977; Fraser 1997; McClung 1995; Miller 1999; O'Doherty 1992; Ralston 1987; Reginster 1992; Reid 1996; Reid 2004; Reid 2005; Roux 1995; Siris 1996) and their risk of bias was judged as low. Five studies were open‐label (Langston 2010; Merlotti 2007; O'Donoghue 1987; Walsh 2004; Tan 2017). The performance risk of bias was considered as high for subjective outcomes as pain or quality of life for all of them. The performance risk of bias was considered low for two of the open‐label studies (Langston 2010; Tan 2017) because the main outcome (radiologically‐confirmed clinical fracture) was not likely to be influenced by lack of blinding. The outcome assessment was not blinded in another study (Miller 1999).
Incomplete outcome data
The risk of bias due to incomplete outcome data was considered to be low in fourteen studies (Buckler 1999; Fraser 1997; Langston 2010; McClung 1995; Merlotti 2007; O'Donoghue 1987; Ralston 1987; Reid 1996; Reid 2004; Reid 2005; Roux 1995; Siris 1996; Tan 2017; Walsh 2004). Four studies were judged at high risk of bias because of significant missing data (Reginster 1992), differences between the follow‐up of the different control and experimental group (O'Doherty 1992) or data inconsistencies in the manuscript (Altman 1973; Miller 1999). Risk of bias was unclear in two studies (Barreira 2009; Canfield 1977).
Selective reporting
Selective reporting bias was difficult to evaluate because study protocols were available for only four studies (Langston 2010; Reid 2004; Reid 2005; Tan 2017). Five studies were judged at high risk of bias due to selective reporting because data on adverse events were not clearly detailed (Canfield 1977); there were no data on adverse events (O'Doherty 1992; O'Donoghue 1987); or because adverse events were not systematically recorded in the trials (Ralston 1987; Reid 2004). Two studies were judged at high risk of bias due to selective reporting because details of assessment for some outcomes included in the results sections (pain, fractures) were not detailed in methods sections (O'Doherty 1992; O'Donoghue 1987). Conversely in another study, some outcomes mentioned in the methods section (pain, fractures) were not provided in the results section (high risk of bias) (Reid 2005). Risk of bias was judged as unclear for the remainder of the included studies. No studies were assessed as at low risk of bias.
Other potential sources of bias
Langston 2010 and its extension study (Tan 2017) were assessed with potential risk of bias for subjective outcomes due to their open‐label designs. In these studies, the attending clinician was able to choose which bisphosphonate should be prescribed, resulting in heterogeneity between groups in numbers and types of bisphosphonate used. However, adherence to the randomised treatment strategy was confirmed by the fact that alkaline phosphatase values were significantly lower in the intensive group as compared with the symptomatic group for both trials.
Effects of interventions
See: Summary of findings for the main comparison Bisphosphonates versus placebo for Paget's disease of bone; Summary of findings 2 Zoledronate versus pamidronate or risedronate for Paget's disease of bone
summary of findings Table for the main comparison presents findings for bisphosphonates versus placebo; summary of findings Table 2 presents findings for bisphosphonates versus bisphosphonates.
Major outcomes
Effect on bone pain
Bone pain was not considered as a primary outcome by any of the included studies, although 15 reported change in bone pain as secondary outcomes. Eight studies assessed pain on visual analogue scales (VAS; range 0 to 10) (Fraser 1997; McClung 1995; Ralston 1987; Reid 2005; Reginster 1992; Roux 1995; Siris 1996; Walsh 2004).
Studies classified pain using different categories. Merlotti 2007 classified pain as: never in pain, pain disappeared, pain decreased or no change in pain. Altman 1973 applied three categories: mild pain, moderate pain or severe pain. Langston 2010 and Tan 2017 categorised pain according to whether or not participants had bone pain. Three studies measured bone pain using the SF‐36 bodily pain domain (Langston 2010; Miller 1999; Tan 2017). Three studies did not report the tool used for pain assessment (Canfield 1977; O'Doherty 1992; O'Donoghue 1987). Analyses were based on any bone pain reduction and disappearance of bone pain to assess changes in bone pain.
Bisphosphonates versus placebo
Two studies (Fraser 1997; Reginster 1992) compared tiludronate versus placebo. The overall effect on disappearance of pain (defined as complete reduction of pain) favoured bisphosphonates (RR 3.42, 95% CI 1.31 to 8.90; NNTB 5, 95% CI 1 to 35; absolute risk of event 31% versus 9%; Analysis 1.1).
When effect on bone pain was defined as any reduction in pain, the overall effect favoured bisphosphonates (RR 1.97, 95% CI 1.29 to 3.01; RD 0.33, 95% CI 0.18 to 0.49; NNTB 4, 95% CI 2 to 13; absolute risk of event 45% versus 23%). Results were consistent across the trials; all studies included in the meta‐analysis showed a favourable effect (RR range from 1.20 to 10.00; Analysis 1.2; Figure 5).
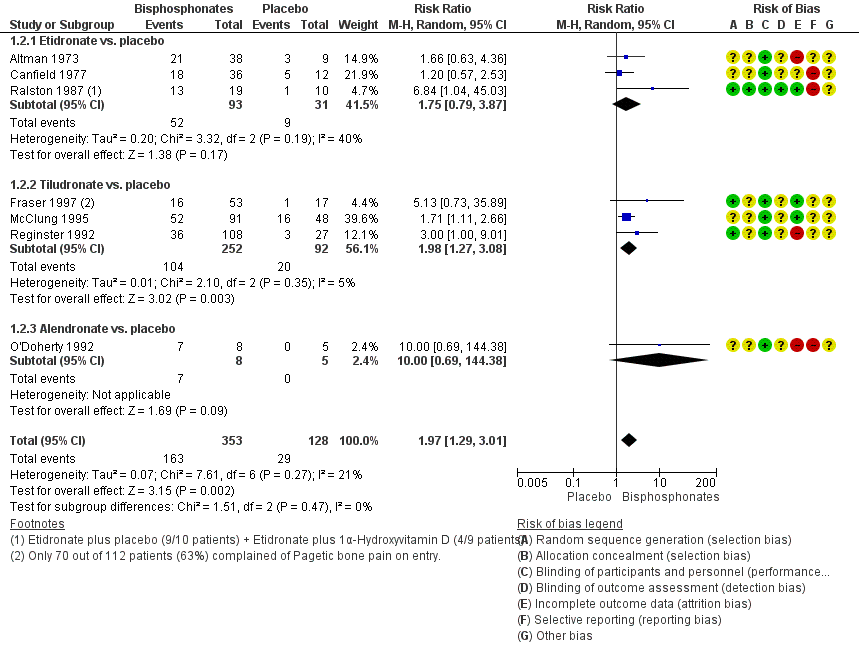
Forest plot of comparison: 1 Bisphosphonates versus placebo, outcome: 1.2 Number of participants with change in bone pain
Results for effect on bone pain (defined as pain disappearance or any reduction in pain) were consistent.
When change in bone pain was assessed as a continuous variable, data were heterogeneous. Ralston 1987 used a linear analogue scale and reported that etidronate was better than placebo. McClung 1995 measured bone pain using the Huskisson pain severity score instrument and reported no detectable difference between bisphosphonates and placebo in average pain scores. Reid 1996 used the Brief Pain Inventory and reported detectable differences favouring placebo when compared with alendronate (placebo ‐1.4 ± 0.3 versus alendronate ‐0.7 ± 0.5, difference favoured placebo ‐0.7, 95% CI 0.41 to 0.99).
Bisphosphonates versus active comparator
There was insufficient evidence to confirm or exclude an important difference (MD ‐2.60, 95% CI ‐5.03 to ‐0.17) in pain scores (0 to 100) when etidronate was compared with risedronate (measured on SF‐36) (Miller 1999) or alendronate (measured on the Brief Pain Inventory slightly modified for use in Paget's disease of bone) (Siris 1996) (Analysis 2.1). Pain assessment as a dichotomous variable was not made for this comparison.
Zoledronate showed a statistically‐ and clinically‐significantly greater effect on partial or total pain relief (binary outcome) when compared with the aminobisphosphonates pamidronate (RR 1.30, 95% CI 1.10 to 1.53; Merlotti 2007; 89 participants; NNTB 4, 95% CI 3 to 13; absolute risk of event 97% versus 75%) and risedronate (RR 1.36 95% CI 1.06 to 1.74; Reid 2005; 347 participants; NNTB 8, 95% CI 4 to 45, absolute risk of event 50% versus 37%; Analysis 3.1). However, there was no evidence of an effect when bone pain was assessed as a continuous outcome (scores) between zoledronate and risedronate (Reid 2005) (Table 2). Results were inconclusive between treatments for Pagetic bone pain, Pagetic joint pain, or non‐Pagetic pain when alendronate was compared with pamidronate (Walsh 2004). Scores for bone pain, joint pain and non‐Pagetic pain all fell significantly (P < 0.05) from baseline during the first 12 months of the study in both treatment groups (Walsh 2004). Between‐group numerical results were not provided in Walsh 2004.
| Study ID | Outcome | Zoledronate | Risedronate | RR (95% IC) | ||
| Events | N | Events | N | |||
| Radiologically‐confirmed clinical fracture | 2 | 177 | 2 | 172 | 0.97 (0.14 to 6.82) | |
| Reid 2011 (extension) | Radiologically‐confirmed clinical fracture | 3 | 152 | 1 | 115 | 2.30 (0.24 to 22.36) |
| Quality of life change from baseline | 48 | 176 | 36 | 171 | 1.30 (0.89 to 1.89) | |
| Reid 2011 (extension) | Clinical relapse | 14 | 152 | 29 | 115 | 0.30 (0.15 to 0.60) |
| Study ID | Outcome | Mean (SD) | N | Mean (SD) | N | Mean difference |
| Mean change from baseline in pain | ‐0.5 (1.75) | 101 | ‐0.4 (2.13) | 92 | ‐0.10 (‐0.65 to 0.45) | |
| Mean change from baseline in quality of life¹ | 1.5 (0.5) | 176 | 0.2 (0.6) | 171 | 1.30 (1.18 to 1.42) | |
| Reid 2011 (extension) | Mean change from baseline in total SF‐36 score² | 1.3 (3.1) | 152 | ‐2.5 (2.6) | 115 | 3.8 (3.12 to 4.49) |
¹Physical‐component summary (data extracted from Figure 4 in Reid 2005).
²Total SF‐36 scores to 54 months (data extracted from Figure 6 in Reid 2011 extension) (+1.3 ± 3.1 versus ‐2.5 ± 2.6) [D]
Adding calcitonin to etidronate (O'Donoghue 1987) reduced the proportion of participants experiencing partial or total pain relief as compared with etidronate alone (RR 0.73, 95% CI 0.43 to 1.25; Table 3).
| Ouctome | Etidronate plus calcitonin | Etidronate | RR (95% IC) | ||
| Events | N | Events | N | ||
| Change in bone pain | 10 | 21 | 15 | 23 | 0.73 (0.43 to 1.25) |
Intensive versus symptomatic treatment
In Langston 2010 and the extension study Tan 2017, there was insufficient evidence to confirm or exclude a important difference for partial or total pain relief or change in bodily pain measured using the SF‐36 between symptomatic and intensive treatment groups (improvement in bone pain RR 0.86, 95% CI 0.67 to 1.10) (Table 4).
| Study ID | Outcome | Intensive | Symptomatic | RR (95% IC) | ||
| Events | N | Events | N | |||
| Improvement in bone pain | 78 | 295 | 96 | 311 | 0.86 (0.67 to 1.10) | |
| Radiologically‐confirmed fractures | 46 | 661 | 49 | 663 | 0.94 (0.64 to 1.39) | |
| Radiologically‐confirmed fractures*¹ | 22 | 270 | 12 | 232 | 1.58 (0.80 to 3.11) | |
| Radiologically‐confirmed fractures (pagetic bone) | 8 | 661 | 13 | 663 | 0.62 (0.25 to 1.49) | |
| Radiologically‐confirmed fractures (pagetic bone)¹ | 5 | 270 | 2 | 232 | 2.15 (0.42 to 10.96) | |
| Number of orthopaedic surgeries | 48 | 661 | 55 | 663 | 0.88 (0.60 to 1.27) | |
| Number of orthopaedic surgeries¹ | 15 | 270 | 7 | 232 | 1.84 (0.76 to 4.44) | |
| Number of orthopaedic procedures | 50 | 661 | 63 | 663 | 0.78 (0.53 to 1.15) | |
| Number of orthopaedic procedures | 16 | 270 | 9 | 232 | 1.52 (0.69 to 3.39) | |
| Change in hearing thresholds² | 134 | 505 | 133 | 486 | 0.97 (0.79 to 1.19) | |
| Hearing classification worse at study end (left ear)³ | 6 | 50 | 8 | 63 | 0.95 (0.35 to 2.55) | |
| Hearing classification worse at study end (right ear)³ | 4 | 51 | 8 | 60 | 0.58 (0.19 to 1.84) | |
| Serious adverse events | 345 | 661 | 359 | 663 | 0.96 (0.87 to 1.07) | |
| Serious adverse events | 87 | 270 | 66 | 232 | 1.13 (0.87 to 1.48) | |
| Withdrawal due to adverse events⁴ | 83 | 661 | 79 | 663 | 1.05 (0.79 to 1.41) | |
| Normalised alkaline phosphatase levels | 512 | 661 | 406 | 663 | 1.26 (1.18 to 1.36) | |
| Study ID | Outcome | Mean (SD) | N | Mean (SD) | N | Mean difference |
| Mean change from baseline in quality of life (bodily pain SF‐36)⁵ | ‐0.4 (8.9) | 479 | 0.3 (9.4) | 477 | ‐0.7 (‐1.8 to 0.5) | |
| Mean change from baseline in quality of life (bodily pain SF‐36)⁶ | 0.1 (9.3) | 149 | ‐1.0 (9.1) | 138 | ‐1.0 (‐3.0 to 1.1) | |
| Mean change from baseline in quality of life (physical summary SF‐36)*⁵ | ‐1.2 (8.1) | 408 | ‐1.1 (8.2) | 396 | ‐0.1 (‐1.3 to 1.0) | |
| Mean change from baseline in quality of life (physical summary SF‐36)⁶ | ‐1.0 (7.7) | 144 | ‐2.7 (7.7) | 126 | ‐1.6 (‐3.4 to 0.3) | |
| Mean change from baseline in quality of life (mental summary SF‐36)*⁵ | ‐1.7 (10.2) | 408 | ‐2.6 (10.9) | 396 | 0.9 (‐0.6 to 2.3) | |
| Mean change from baseline in quality of life (mental summary SF‐36)⁶ | ‐1.0 (10.0) | 144 | ‐0.4 (9.9) | 126 | ‐0.6 (‐1.7 to 3.1) | |
| Mean hearing loss (left ear)³ | 1.8 (14.6) | 50 | 0.0 (12.6) | 63 | 1.8 (‐3.4 to 7.0) | |
| Mean hearing loss (right ear)³ | 2.5 (5.7) | 51 | 2.1 (9.4) | 60 | 0.5 (‐2.4 to 3.3) | |
| Mean percentage change from baseline in serum total alkaline phosphatase activity | ‐40.5 (23.7) | 430 | ‐18 (71.2) | 424 | ‐22.5 (‐29.6 to ‐15.4) | |
| Mean percentage change from baseline in adjusted serum total alkaline phosphatase activity | ‐0.15 (0.72) | 203 | ‐0.05 (0.75) | 181 | ‐0.11 (‐0.03 to 0.25) | |
Data at 24 months for Langston 2010.
¹Data shown for these outcomes are number of events, patient years of follow up, rate ratios and 95% CI calculated using the method described by Cohen 2011.
²Number of participants using hearing aids at the end of the study.
³Patients with baseline and end of the trial measurements.
⁴Serious adverse event: any untoward medical occurrence that: 1) results in death, 2) is life‐threatening, 3) requires inpatient hospitalisation or prolongation of existing hospitalisation, 4) results in persistent or significant disability/incapacity, or 5) is a congenital anomaly/birth defect.
⁵Data at 24 months.
⁶Difference between baseline and 36 months.
Effect on fractures
Radiologically‐confirmed clinical fracture was the primary outcome in Langston 2010 and its extension study Tan 2017, and a secondary outcome in six studies (Altman 1973; Canfield 1977; Fraser 1997; Reid 2005; Reginster 1992; Roux 1995). The number of new fractures were extremely low in all studies except Langston 2010 and its extension Tan 2017.
Bisphosphonates versus placebo
We could not determine whether the intervention had an important effect on fractures because the sample size was small and the long‐term impact on fractures was not assessed. Etidronate (Altman 1973; Canfield 1977) and tiludronate (Fraser 1997; Reginster 1992) were compared to placebo (pooled RR, 0.89 95% CI 0.18 to 4.31; 0 fractures in the placebo group; Analysis 1.3). The mean follow‐up period was six months (Altman 1973; Canfield 1977; Fraser 1997; Reginster 1992).
Bisphosphonates versus active comparator
Tiludronate was compared to etidronate (Roux 1995) and zoledronate to risedronate (Reid 2005) with no evidence of a difference between these bisphosphonates (Table 5; Table 2). The results were inconclusive because long‐term impact on fractures was not assessed and samples sizes were small.
| Outcome | Tiludronate | Etidronate | RR (95% IC) | ||
| Events | N | Events | N | ||
| Number of participants with change in bone pain | 32 | 120 | 10 | 52 | 1.39 (0.74 to 2.61) |
| Number of participants with radiologically‐confirmed fractures | 1 | 155 | 2 | 79 | 0.25 (0.02 to 2.77) |
| Number of participants with severe side effects | 75 | 155 | 27 | 79 | 1.42 (1.00 to 2.00) |
| Number of participants who withdrew due to adverse events | 10 | 155 | 2 | 79 | 2.55 (0.57 to 11.35) |
| Number of participants who normalised alkaline phosphatase levels | 40 | 155 | 9 | 79 | 2.27 (1.16 to 4.43) |
Intensive versus symptomatic treatment
The Langston 2010 study of intensive bisphosphonate treatment versus symptomatic treatment showed no evidence of an effect in the number of new fractures between treatment approaches (6.7% versus 7.4%, RR 0.94, 95% CI 0.64 to 1.39; Table 4). Follow‐up was long enough duration to assess long‐term impact on fractures (3 years mean follow‐up). In the extension study by Tan 2017, all fractures and fractures in Pagetic bone were more common in the intensive treatment group (8.1% versus 5.2%, RR 1.58, 95% CI 0.80 to 3.11; 1.9% versus 0.9%, RR 2.15, 95% CI 0.42 to 10.96 respectively). However, the confidence intervals were wide. It should be noted that Tan 2017 reported hazard ratio for fractures in the intensive versus symptomatic group when corrected for baseline differences between groups using propensity scoring. This showed a hazard ratio for fracture in the intensive versus symptomatic group of 1.90 (95% CI 0.91 to 3.98).
Effect on need for orthopaedic surgery
The need for orthopaedic surgery was not considered as a primary outcome by any of the included studies; only Langston 2010 and Tan 2017 included this outcome.
Bisphosphonates versus placebo
No included studies addressed need for orthopaedic surgery for bisphosphonates versus placebo.
Bisphosphonates versus active comparator
No included studies addressed need for orthopaedic surgery for comparison between bisphosphonates.
Intensive versus symptomatic treatment
There was no evidence of a difference between intensive and symptomatic treatment; 7.3% of participants in the intensive treatment group and 8.3% participants in the symptomatic treatment group needed orthopaedic surgery (RR 0.88, 95% CI 0.60 to 1.27; Table 4). In Tan 2017, all orthopaedic procedures were more common in intensive group participants (5.6% versus 3.0%, RR 1.84, 95% CI 0.76 to 4.44) as were procedures in Pagetic bone; 2.6% versus 1.7% (RR 1.50, 95% CI 0.45 to 5.07). However, the confidence intervals were wide. It should be noted that Tan 2017 reported hazard ratio for orthopaedic procedures in the intensive versus symptomatic group when corrected for baseline differences between groups using propensity scoring. This showed a hazard ratio for orthopaedic procedures in the intensive versus symptomatic group of 1.81 (95% CI 0.71 to 4.61).
Effect on quality of life
The impact of bisphosphonates on quality of life was included as a secondary outcome by six studies (Langston 2010; Merlotti 2007; Miller 1999; Reid 2005; Tan 2017; Walsh 2004).
Bisphosphonates versus placebo
No studies addressed effects on quality of life for the comparison of bisphosphonates versus placebo.
Bisphosphonates versus active comparator
There was no evidence of an effect on quality of life when zoledronate was compared with risedronate (Reid 2005), although zoledronate showed a marginal improvement at six months, with a mean difference in change on the physical component summary score of 1.30 (95% CI 1.18 to 1.42: Table 2). Furthermore, in the extension study (Reid 2011), participants who attained normal alkaline phosphatase levels following zoledronate maintained lower levels of total SF‐36 score when compared with risedronate for a period of up to 54 months (Table 2). For the pain domain of the SF‐36, changes from baseline were significant in the zoledronate group at 24 months (7.5 ± 2.6) and 36 months (5.6 ± 2.4); whereas no significant changes were observed for the risedronate group at any time point.
General health score on the SF‐36 was higher when alendronate was compared to pamidronate according to Walsh 2004. There was no evidence of a difference between treatments in the other seven domains of the SF‐36 or in the mental and physical component summary scores. Numeric data were not provided in the study report (Walsh 2004). Merlotti 2007 did not detect a difference when zoledronate was compared to pamidronate. The authors of both Walsh 2004 and Merlotti 2007 reported there were no differences, but numeric data were not provided.
Intensive versus symptomatic treatment
A comparison of intensive and symptomatic treatment did not detect a difference in quality of life between treatment groups (Langston 2010). Mean changes in bodily pain, physical and mental summaries of SF‐36 are shown in Table 4. In the extension study to Langston 2010, Tan 2017 reported small differences between groups at Year 1 (physical component summary scores and arthritis‐specific health index) which favoured the intensive treatment group. However, there was no sustained difference in quality of life at Year 2 or Year 3.
Effect on deafness and hearing thresholds
Deafness and hearing thresholds were not considered as a primary outcome by any of the included studies; only Langston 2010 included data on these outcomes.
Bisphosphonates versus placebo
No included studies addressed effects on deafness and hearing thresholds for the comparison of bisphosphonates versus placebo.
Bisphosphonates versus active comparator
No included studies addressed effects on deafness and hearing thresholds for the comparison of bisphosphonates with an active comparator.
Intensive versus symptomatic treatment
A comparison of intensive and symptomatic treatment did not detect a difference between groups in deafness or hearing thresholds. Changes in hearing thresholds were recorded in 26.7% of participants in the intensive treatment group versus 27.4% of participants in the symptomatic group (RR 0.97, 95% CI 0.79 to 1.19). Changes in hearing loss and hearing classification data are provided in Table 4.
Adverse events
Four trials (Canfield 1977; O'Doherty 1992; O'Donoghue 1987; Ralston 1987) did not report on adverse events related to bisphosphonates. Data from other trials on adverse events were heterogeneous; adverse events reporting was not comprehensive. Furthermore, assessment of adverse events severity varied among studies. Adverse events reported in trials comparing bisphosphonates versus placebo (Altman 1973; Buckler 1999; Fraser 1997; McClung 1995; Reginster 1992; Reid 1996), bisphosphonates versus bisphosphonates (Barreira 2009; Merlotti 2007; Miller 1999; Reid 2005; Roux 1995; Siris 1996; Walsh 2004) or intensive versus symptomatic treatment (Langston 2010) are provided in Table 6, Table 7 and Table 8 respectively.
| Study ID | Comparison | Side effect | Bisphosphonate | Placebo | RR (95% CI) |
| Etidronate (38) vs. placebo (9) | Diarrhoea | 5 (13%) | 1 (11%) | 1.18 (0.16 to 8.93) | |
| Zoledronate (141) vs. placebo (35) | Fatigue Fever Arthralgia Pain, back Pain, skeletal Hypocalcaemia | 12 (9%) 7 (5%) 15 (11%) 14 (10%) 11 (8%) 3 (2%) | 0 (0%) 0 (0%) 3 (9%) 1 (3%) 2 (6%) 0 (0%) | 6.34 (0.38 to 104.5) 3.80 (0.50 to 28.88) 1.24 (0.89 to 1.77) 3.47 (0.53 to 23.02) 1.37 (0.85 to 2.19) 1.78 (0.74 to 4.24) | |
| Tiludronate (86) vs. placebo (26) | Nausea Vomiting Dyspepsia Diarrhoea Arthralgia Skeletal pain Raised liver enzymes Eosinophilia | 15 (17%) 7 (7%) 9 (10%) 14 (16%) 8 (9%) 5 (6%) 1 (1%) 0 (0%) | 2 (8%) 0 (0%) 0 (0%) 0 (0%) 2 (8%) 3 (12%) 0 (0%) 1 (4%) | 2.27 (0.65 to 7.86) 4.66 (0.45 to 48.06) 5.90 (0.40 to 87.16) 9.00 (0.32 to 252.8) 1.21 (0.91 to 1.61) 0.50 (0.13 to 1.97) 0.93 (0.04 to 22.20) 0.10 (0.01 to 2.47) | |
| Tiludronate (91) vs. placebo (48) | Gastrointestinal | 31 (34%) | 15 (31%) | 1.09 (0.66 to 1.81) | |
| Tiludronate (117) vs. placebo (32) | Gastralgia Nausea | 20 (17.1%) 11 (9.4%) | 5 (16.1%) 3 (9.6%) | 1.09 (0.45 to 2.69) 1.00 (0.30 to 3.38) | |
| Alendronate (27) vs. placebo (28) | Gastrointestinal Gastritis Duodenal ulcer Oesophagitis | 2 (7%) 0 (0%) 0 (0%) 1 (4%) | 5 (18%) 1 (4%) 1 (4%) 0 (0%) | 0.42 (0.09 to 2.00) 0.35 (0.02 to 8.13) 0.35 (0.02 to 8.13) 3.10 (0.13 to 73.10) |
| Study ID | Comparison | Adverse effect | Bisphosphonate 1 | Bisphosphonate 2 | RR (95% CI) |
| Tiludronate (155) vs. etidronate (79) | Gastrointestinal | 32 (20.8%) | 10 (12.7%) | 1.63 (0.85 to 3.14) | |
| Abdominal pain | 10 (6.5%) | 2 (2.5%) | 2.55 (0.57 to 11.35) | ||
| Nausea, vomiting | 8 (5.2%) | 2 (2.5%) | 2.04 (0.44 to 9.37) | ||
| Fracture | 1 (1%) | 2 (3%) | 0.25 (0.02 to 2.77) | ||
| Alendronate (42) vs. etidronate (47) | Gastrointestinal | 11 (26%) | 10 (21%) | 1.23 (0.58 to 2.60) | |
| Abdominal distention | 0 (%) | 1 (2%) | 0.37 (0.02 to 8.90) | ||
| Abdominal pain | 3 (7%) | 4 (9%) | 0.84 (0.2 to 3.54) | ||
| Acid regurgitation | 1 (2%) | 1 (2%) | 1.12 (0.07 to 17.34) | ||
| Dyspepsia | 0 (0%) | 1 (2%) | 0.37 (0.02 to 8.90) | ||
| Melena | 1 (2%) | 0 (0%) | 3.35 (0.14 to 80.05) | ||
| Nausea | 2 (5%) | 3 (6%) | 0.75 (0.13 to 4.25) | ||
| Leg pain | 1 (2%) | 9 (19%) | 0.12 (0.02 to 0.94) | ||
| Laboratory adverse experiences | 9 (21%) | 6 (13%) | 1.68 (0.65 to 4.32) | ||
| Risedronate (62) vs. etidronate (61) | Upper gastrointestinal | 12 (19%) | 12 (20%) | 0.98 (0.48 to 2.02) | |
| Olpadronate (14) vs. pamidronate (7) | Digestive | 9 (64%) | 7 (100%) | 0.68 (0.44 to 1.03) | |
| Zoledronate (47)* vs. pamidronate (60) | Influenza‐like illness | 4 (9%) | 5 (8%) | 1.02 (0.29 to 3.59) | |
| Myalgia | 3 (6%) | 4 (7%) | 0.96 (0.23 to 4.07) | ||
| Pyrexia | 3 (6%) | 4 (7%) | 0.96 (0.23 to 4.07) | ||
| Fatigue | 3 (6%) | 8 (13%) | 0.48 (0.13 to 1.71) | ||
| Headache | 4 (9%) | 5 (8%) | 1.02 (0.29 to 3.59) | ||
| Diarrhoea | 1 (2%) | 2 (3%) | 0.64 (0.06 to 6.83) | ||
| Bone pain | 3 (6%) | 6 (10%) | 0.64 (0.17 to 2.42) | ||
| Pain in arm or leg | 3 (6%) | 4 (7%) | 0.96 (0.23 to 4.07) | ||
| Hypocalcaemia | 3 (6%) | 1 (2%) | 3.83 (0.41 to 35.64) | ||
| Dermatitis | 1 (2%) | 0 (0%) | 0.42 (0.02 to 10.17) | ||
| Zoledronate (177) vs. risedronate (172) | Study days 1 to 3 | ||||
| Influenza‐like illness | 17 (9.6%) | 7 (4.1%) | 2.36 (1 to 5.55) | ||
| Myalgia | 13 (7.3%) | 6 (3.5%) | 2.11 (0.82 to 5.41) | ||
| Pyrexia | 13 (7.3%) | 1 (0.6%) | 12.63 (1.67 to 95.53) | ||
| Fatigue | 12 (6.8%) | 4 (2.3%) | 2.92 (0.96 to 8.86) | ||
| Headache | 12 (6.8%) | 7 (4.1%) | 1.67 (0.67 to 4.13) | ||
| Rigor | 12 (6.8%) | 1 (0.6%) | 11.66 (1.53 to 88.72) | ||
| Nausea | 11 (6.2%) | 3 (1.7%) | 3.56 (1.01 to 12.55) | ||
| Bone pain | 9 (5.1%) | 2 (1.2%) | 4.37 (0.96 to 19.95) | ||
| After study day 3 | |||||
| Pain in an arm or leg | 13 (7.3%) | 12 (7%) | 1.05 (0.49 to 2.24) | ||
| Arthralgia | 9 (5.1%) | 19 (11%) | 0.46 (0.21 to 0.99) | ||
| Dizziness | 9 (5.1%) | 5 (2.9%) | 1.75 (0.6 to 5.11) | ||
| Nasopharyngitis | 9 (5.1%) | 14 (8.1%) | 0.62 (0.28 to 1.41) | ||
| Diarrhoea | 8 (4.5%) | 9 (5.2%) | 0.86 (0.34 to 2.19) | ||
| Headache | 7 (4%) | 10 (5.8%) | 0.68 (0.26 to 1.75) | ||
| Back pain | 4 (2.3%) | 12 (7.0%) | 0.32 (0.11 to 0.98) | ||
| Symptomatic hypocalcaemia | 2 (1.1%) | 1 (0.6%) | 1.94 (0.18 to 21.24) | ||
| Reid 2011 (extension) | Zoledronate (152) vs. risedronate (115) | Atrial fibrillation | 1 (0.7%) | 1 (0.9%) | 0.76 (0.05 to 12.20) |
| Atrial flutter | 0 (0%) | 2 (1.7%) | 0.15 (0.01 to 3.13) | ||
| Osteonecrosis jaw | 0 (0%) | 0 (0%) | ‐ | ||
| Alendronate (36) vs. pamidronate (36) | Gastrointestinal | 16 (44%) | 4 (11%) | 4 (1.48 to 10.80) | |
| Fatigue | 0 (0%) | 23 (64%) | 0.02 (0.00 to 0.34) | ||
| General aches/pain | 4 (11%) | 16 (44%) | 0.25 (0.09 to 0.68) | ||
| Deteriorating kidney failure | 1 (3%) | 0 (0%) | 3.00 (0.12 to 71.28) | ||
*Zoledronate group data were extracted from Table 3 in Merlotti 2007. In this table, the authors presented data from 30 participants who took part in the first part of the study (which was included in our systematic review) plus 17 participants from the second part of the study (which was not included in our systematic review).
| Study ID | Comparison | Side effect | Intensive | Symptomatic | RR (95% CI) |
| Intensive (661) vs. symptomatic (663) | All adverse events Serious adverse events Musculoskeletal Sensory Gastrointestinal Cardiovascular Arrythmia Cancer Renal Other | 3429 345 691 203 172 360 13 (1.9%) 55 98 1850 | 3471 359 734 196 157 327 7 (1%) 47 78 1932 | ‐ ‐ ‐ ‐ ‐ ‐ 1.86 (0.75 to 4.64) ‐ ‐ ‐ | |
| Intensive (270) vs. symptomatic (232) | All adverse events Serious adverse events Musculoskeletal Osteonecrosis of the jaw Delayed union of fracture Ophthalmic Uveitis Gastrointestinal Cardiovascular Arrythmia Cerebrovascular Central nervous system Endocrine Ear, nose or throat Genitourinary Haematological Respiratory Skin Miscellaneous | 226 87 123 1 2 34 1 54 67 14 4 28 28 28 41 10 48 41 33 | 196 66 104 0 1 41 0 46 49 8 3 28 21 26 39 9 43 33 32 | 0.99 (0.91 to 1.07) 1.13 (0.87 to 1.48) 1.02 (0.84 to 1.23) 2.58 (0.11 to 63.01) 1.72 (0.16 to 18.83) 0.71 (0.47 to 1.08) 2.58 (0.11 to 63.01) 1.01 (0.71 to 1.43) 1.18 (0.85 to 1.62) 1.50 (0.64 to 3.52) 1.14 (0.26 to 5.07) 0.86 (0.52 to 1.41) 1.15 (0.68 to 1.96) 0.93 (0.56 to 1.53) 0.90 (0.61 to 1.35) 0.96 (0.40 to 2.31) 0.95 (0.66 to 1.39) 1.07 (0.70 to 1.63) 0.89 (0.56 to 1.40) |
* Data represent total numbers of reported side effects regardless of numbers of participants who experienced them. The authors reported numbers of participants only for arrhythmia.
Bisphosphonates versus placebo
When we considered studies of all bisphosphates versus placebo we did not detect a difference in adverse events although the RR was not equal to one (RR 1.32, 95% CI 0.91 to 1.92; Analysis 1.4; Figure 6). When we considered studies of zoledronate we found that this bisphosphonate had a significantly increased risk of adverse events when compared with placebo (RR 2.57, 95% CI 1.21 to 5.44). Gastrointestinal side effects were common for oral bisphosphonates and fatigue or fever for intravenous bisphosphonates (Table 6).
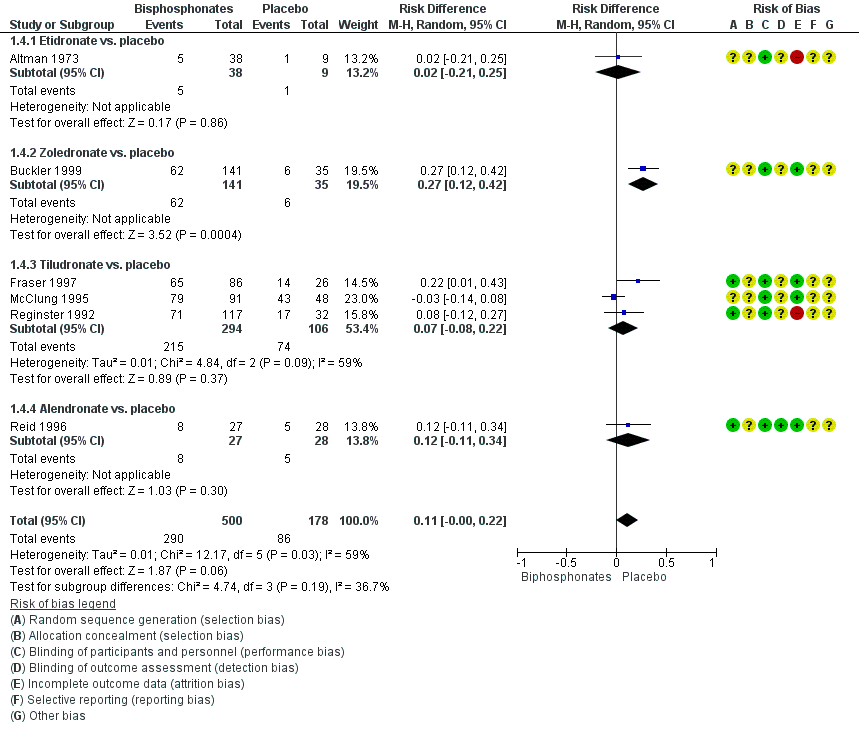
Forest plot of comparison: 1 Bisphosphonates versus placebo, outcome: 1.4 Number of participants who experienced adverse events related to use of bisphosphonates
Bisphosphonates versus active comparator
We did not detect a difference in occurrence of adverse events among bisphosphonates, nor when compared risedronate or alendronate was compared to etidronate (RR 0.98, 95% CI 0.72 to 1.35; Analysis 2.2). There was no evidence of a difference when newer aminobisphosphonates (zoledronate, olpadronate) were compared to older aminobisphosphonates (pamidronate, risedronate) (RR 0.93, 95% CI 0.73 to 1.19; Analysis 3.2). Influenza‐like illnesses were common among participants who received intravenous bisphosphonates. Symptomatic hypocalcaemia was uncommon (< 1%).
Intensive versus symptomatic treatment
No difference was detected for total number of adverse effects when intensive treatment was compared with symptomatic treatment (RR 1.05, 95% CI 0.79 to 1.41; Table 4). Serious adverse effects were more frequent with intensive treatment; 32.2% versus 28.4%, (RR 1.28, 95% CI 0.96 to 1.72). One case each of osteonecrosis of the jaw and uveitis (both in intensive group participants) and three delayed unions of fracture (2 in the intensive group, 1 in the symptomatic group) were recorded in the PRISM‐EZ trial (Tan 2017).
Rare adverse events
In addition to data from the included trials, we reviewed data on six specific rare events obtained from the websites of three regulatory agencies (FDA, EMA, and MHRA) and the AADRB / Australian TGA.
Osteonecrosis of the jaw
The risk of developing osteonecrosis of the jaw is substantially greater for people receiving intravenous bisphosphonates for cancer indications (metastatic cancer of bone, tumour‐associated hypercalcaemia and multiple myeloma) than for those with Paget’s disease of bone or osteoporosis. According to the EMA 2009 Committee for Medicinal Products for Human Use (CHMP) assessment report on bisphosphonates and osteonecrosis of the jaw, people receiving oral bisphosphonates for Paget’s disease of bone are considered to be at much lower risk for developing osteonecrosis of the jaw. Reported incidence ranged from 0.0004% to 0.06%. There is no clear evidence regarding the risk of osteonecrosis of the jaw following use of intravenous bisphosphonates for Paget's disease of bone. The evidence further suggests that the cumulative dose is a risk factor for osteonecrosis of the jaw, so the very low number of reports of osteonecrosis of the jaw in people with Paget’s disease could be explained by the short courses of bisphosphonates used (EMA, FDA, MHRA, TGA).
Osteonecrosis of the external auditory canal
Oseonecrosis of the external auditory canal has been reported with use of bisphosphonates both for cancer‐related bone disease and osteoporosis, but not for Paget’s disease of bone (MHRA).
Ocular inflammation
A small number of reports describe inflammatory eye disorders such as uveitis, iritis, scleritis/episcleritis, haemorrhage and optic neuritis. Inflammatory ocular disorders appear to be a rare effect of all bisphosphonates. There is no specific evidence about the risk of ocular inflammation in people with Paget’s disease of bone after bisphosphonate use (AADRB).
Atrial fibrillation
Evidence regarding atrial fibrillation suggests an increased risk of atrial fibrillation for zoledronate, pamidronate and possibly for alendronate in people treated for osteoporosis and cancer‐related bone disease. There is no specific evidence about the risk of atrial fibrillation in Paget’s disease of bone following bisphosphonate treatment (EMA, MHRA).
Atypical femoral fracture
Atypical femoral fracture is considered to be a class effect of bisphosphonates. These fractures have been seldom reported and mainly among those receiving long‐term treatment for osteoporosis. Only one post‐marketing report of possible atypical femoral fracture with zoledronate in a patient with Paget’s disease has been received according EMA (Assessment report for bisphosphonates containing medicinal products 2011). The very low number of reports of atypical fractures in Paget’s disease of bone patients could be explained by the short bisphosphonates regimens used for this disease compared osteoporosis (EMA, MHRA).
Oesophageal cancer risk
There was insufficient evidence of a link between the risk of oesophageal cancer and the use of oral bisphosphonates. This suggested association has been proposed for people taking oral bisphosphonate for more than five years, a therapeutic schedule that is not used for people with Paget’s disease of bone (EMA, MHRA).
Withdrawals due to adverse events
Discontinuations due to adverse events were reported and analysed for 13 trials.
Bisphosphonates versus placebo
The pooled estimate for the comparison between bisphosphonates and placebo demonstrated no evidence of effect in the risk of discontinuing medication due to adverse events (RR 1.01, 95% CI 0.41 to 2.52; 6 studies, 517 participants; Analysis 1.5). The results were consistent among trials, with low rates of withdrawals in both treatment groups.
Bisphosphonates versus active comparator
Results were inconclusive for the comparison between two non‐aminobisphosphonates (Roux 1995) (RR 2.55, 95% CI 0.57 to 11.35; Table 5). There was no evidence of a difference between aminobisphosphonates and non‐aminobisphosphonates (RR 0.69, 95% CI 0.25 to 1.89; 2 studies, 212 participants; Analysis 2.3) or between aminobisphosphonates (RR 0.93, 95% CI 0.37 to 2.35; 3 studies; Analysis 3.3).
Intensive versus symptomatic treatment
No difference was detected in the risk of discontinuing medication due to adverse events between intensive and symptomatic treatment (Langston 2010) (RR 1.05, 95% CI 0.79 to 1.41; Table 4).
Minor outcomes
Relapses due to recurrence of bone pain
Relapses due to recurrence of bone pain were analysed only by Fraser 1997. When compared to placebo, tiludronate achieved a significant reduction in the number of participants who relapsed due to bone pain (RR 0.51, 95% CI 0.32 to 0.80; Table 9).
| Study ID | Outcome | Tiludronate | Placebo | RR (95% IC) | ||
| Events | N | Events | N | |||
| Number of participants who relapsed due to bone pain recurrence | 23 | 66 | 13 | 19 | 0.51 (0.32 to 0.80) | |
Effect on serum total alkaline phosphatase activity
Changes in serum bone markers, especially changes in serum total alkaline phosphatase activity, was considered as the primary outcome in all but two included trials (Langston 2010; Tan 2017).
Bisphosphonates versus placebo
Bisphosphonates achieved a significantly greater reduction in serum total alkaline phosphatase activity when compared to placebo (MD 50.1%, 95% CI 32.5 to 67.7; Analysis 1.6). In line with the greater reduction in serum alkaline phosphatase activity, a high proportion of participants normalised their alkaline phosphatase levels (RR 9.96, 95% CI 3.74 to 26.58; Analysis 1.7).
Bisphosphonates versus active comparator
Among non‐aminobisphosphonates, tiludronate was more effective than etidronate (Roux 1995) (RR 2.27, 95% CI 1.16 to 4.43; Table 5) for normalisation of alkaline phosphatase levels.
Aminobisphosphonates had greater effect on serum biochemical markers of bone turnover than non‐aminobisphosphonates. This was shown in the comparisons between risedronate and etidronate (Miller 1999) or alendronate and etidronate (Siris 1996). The pooled mean difference in the reduction in alkaline phosphatase activity was 41.0% (95% CI 32.8 to 49.1; Analysis 2.4). The pooled RR for normalisation of alkaline phosphatase levels was 4.30 (95% CI 2.72 to 6.79; NNTB 2, 1 to 4; Analysis 2.5).
Zoledronate was the most effective of the aminobisphosphonates. The mean difference in reduction of alkaline phosphatase activity for zoledronate compared to risedronate was 22.7% (95% CI 19.3 to 26.1; Analysis 3.4); RR for normalisation of alkaline phosphatase levels was 1.53 (95% CI 1.33 to 1.76; NNTB 3, 3 to 5). Alendronate was more effective than pamidronate (Walsh 2004) in normalising alkaline phosphatase levels (RR 1.48, 95% CI 1.09 to 2.00; Analysis 3.5).
When etidronate was compared with etidronate plus calcitonin, the combination showed a greater reduction in alkaline phosphatase than etidronate alone: 71% at 6 months versus 56% (CI not reported) (O'Donoghue 1987).
Intensive versus symptomatic treatment
Intensive treatment had a greater effect than symptomatic treatment (Langston 2010) in reducing mean alkaline phosphatase level (22.5%, 95% CI 15.4 to 29.6) and in the percentage of participants whose alkaline phosphatase level was normalised (RR 1.26, 95% CI 1.18 to 1.36; Table 4).
Relapse due to recurrence of increased serum alkaline phosphatase level
Bisphosphonates versus placebo
No included studies evaluated the recurrence of increased serum alkaline phosphatase level following treatment for bisphosphonates versus placebo.
Bisphosphonates versus active comparator
Three trials evaluated relapse due to recurrence of increased serum alkaline phosphatase level following treatment. Miller 1999 compared aminobisphosphonates and non‐aminobisphosphonates and reported that risedronate was more effective than etidronate (RR 0.25, 95% CI 0.05 to 1.11; Table 10). Among aminobisphosphonates, zoledronate was more effective than pamidronate (Merlotti 2007) or risedronate (Reid 2005) (RR 0.06, 95% CI 0.01 to 0.42; NNTB 3, 95% CI 3 to 5; Analysis 3.6).
| Study ID | Outcome | Risedronate | Tiludronate | RR (95% IC) | ||
| Events | N | Events | N | |||
| Number of participants who relapsed due to recurrence of increased serum alkaline phosphatase level | 2 | 62 | 8 | 61 | 0.25 (0.05 to 1.11) | |
Discussion
Summary of main results
Evidence from two studies (205 participants) indicated that compared with placebo bisphosphonates helped to relieve bone pain (disappearance of pain) (RR 3.42 95% CI 1.31 to 8.90, NNTB 5 95% CI 1 to 35%; moderate‐quality evidence). Data on any pain reduction were in accordance with complete disappearance of pain (RR 1.97, 95% CI 1.29 to 3.01; 7 studies, 481 participants; NNTB 5 95% CI 2 to 15; moderate‐quality evidence). Zoledronate provided better pain relief than pamidronate (RR 1.30, 95% CI 1.10 to 1.53) or risedronate (RR 1.36, 95% CI 1.06 to 1.74; very low‐quality evidence).
There was insufficient evidence to evaluate whether bisphosphonate therapy prevented fractures compared with placebo; few studies were designed to study the effects of treatment on the occurrence of fractures (bisphosphonates versus placebo: RR 0.89, 95% CI 0.18 to 4.3; very low‐quality evidence).
There was limited evidence to make firm conclusions about the impact of bisphosphonate on hearing thresholds, deafness, bone deformity, fractures or need for orthopaedic surgery. When zoledronate was compared with risedronate, a marginal improvement in some aspects of quality of life were reported. Differences were also observed in quality of life with long‐term follow‐up but this was restricted to the subgroup of participants who had normal levels of alkaline phosphatase after the original study comparing zoledronate with risedronate.
Bisphosphonates were highly effective in reducing biochemical markers of bone turnover. Bisphosphonates achieved a greater reduction in alkaline phosphatase values compared with placebo (50.1%, 95% CI 32.5 to 67.7; moderate‐quality evidence). Aminobisphosphonates were more effective than non‐aminobisphosphonates in reducing alkaline phosphatase (RR 4.3, 95% CI 2.72 to 6.79, moderate‐quality evidence). Among aminobisphosphonates, zoledronate was more effective than pamidronate (RR 2.57, 95% CI 1.79 to 3.70; moderate‐quality evidence) and risedronate (RR 1.53, 95% CI 1.33 to 1.76; moderate‐quality evidence) in normalising alkaline phosphatase levels.
Adverse events were numerically more common with bisphosphonate treatment than placebo, but differences were not significant, yielding results that were inconclusive (RR 1.32, 95% CI 0.91 to 1.92; risk of event 64% versus 48%; low‐quality evidence). Zoledronate had a significantly increased risk of adverse events than placebo (RR 2.57, 95% CI 1.21 to 5.44). Results were inconclusive for other bisphosphonates. Gastrointestinal side effects were common among participants in oral bisphosphonates trials, whereas transitory influenza‐like illness or pyrexia (3 days or fewer) were common with intravenous bisphosphonates. Serious adverse events attributable to bisphosphonates were rare. The rate of withdrawals due to serious adverse events was low. There were no clinically significant differences in adverse events when different bisphosphonates were compared.
The PRISM trial, which involved 1331 participants, addressed the issue of a 'treat to target' design using bisphosphonates in participants with Paget's disease of bone with fractures as the primary endpoint (Langston 2010). Langston 2010 compared two strategies; in the symptomatic group, bisphosphonates and other treatments were administered with the aim of treating bone pain. In the intensive group, bisphosphonates were administered with the aim of normalising alkaline phosphatase levels. Langston 2010 reported no differences in fractures between treatment groups, or for secondary outcomes, including pain relief, hearing thresholds, need for orthopaedic surgery or quality of life. An extension study by Tan 2017, which involved 502 participants, reported no benefits from intensive treatment on quality of life. There was a non‐significant trend for increased risk of fractures and need for orthopaedic procedures in the intensive treatment group (low‐quality evidence).
Overall completeness and applicability of evidence
The review process included an extensive and systematic literature search that included articles published in all languages. We also searched trials registers to identify potentially relevant, but not yet published, studies.
The included trials covered the usual spectrum of older people diagnosed with Paget's disease of bone. Many studies focused on participants with raised serum biochemical markers of bone turnover, but the PRISM (Langston 2010) and PRISM‐EZ (Tan 2017) studies also included participants with normal serum biomarkers, some with no bone pain. Therefore, the included trials included covered a wide range of participants with differing degrees of metabolic activity and symptoms.
We found no evidence that bisphosphonates could prevent bone deformity or long‐term complications such as bone fractures, need for orthopaedic surgery or progression of deafness in participants with skull involvement. However, few studies were conducted that evaluated effects on these outcomes.
Most studies planned to analyse change in serum bone turnover markers as the primary outcome. While the treatment group always achieved a reduction on serum bone turnover markers compared to control groups, it is noteworthy that the biochemical improvements were not necessarily associated with similar improvements in patient‐oriented outcomes. Only pain relief, as a short‐term patient‐oriented outcome, was addressed in most trials.
Based on available data, there was no clinical benefit from adopting a strategy of administering bisphosphonates with the aim of normalising alkaline phosphatase in people with Paget's disease of bone. A long‐term study of intensive bisphosphonate treatment reported no benefit in quality of life compared with symptomatic treatment and a trend toward increased risk of fractures with intensive treatment, although the difference between groups was not significant.
Quality of the evidence
The review includes 20 trials (3168 participants). Of these, ten trials (801 participants) compared bisphosphonates versus placebo. Seven trials compared two bisphosphonates (992 participants). One trial compared a bisphosphonates with a bisphosphonate plus calcitonin (44 participants). One trial (1331 participants) and its interventional extension study (502 participants) compared symptomatic treatment and intensive treatment where the goal was to normalise alkaline phosphatase.
'Summary of findings' tables are presented that compare bisphosphonates and placebo (summary of findings Table for the main comparison) and zoledronate and risedronate or pamidronate (summary of findings Table 2). Evidence quality for effects on seven patient‐relevant outcomes ranged from very low to moderate (4 outcomes); several outcomes could not be assessed because of lack of reporting in the included studies.
Evidence quality was assessed as moderate for bone pain relief (7 studies, 481 participants). Evidence was downgraded by one level due to high risk for attrition bias in three studies and a high risk for reporting bias in another three studies. None of the included studies were assessed at high risk for performance bias for bisphosphonates compared with placebo. The heterogeneity of methods for assessing and defining Pagetic bone pain and lack of a standard way to assess changes in bone pain made comparisons between studies difficult. Differentiation of the cause of pain was also difficult because pain could be related to increased metabolic activity in Pagetic bone, co‐existing arthritis, nerve compression syndromes from misshapen bones or other causes.
Despite the heterogeneity of definitions, the conclusion regarding the role of bisphosphonates to improve pain in people with Paget's disease of bone is robust. Results were consistent among trials, sensitivity analyses excluding studies at high risk of bias or including only studies that used total disappearance of pain as response definition did not alter findings.
We found low‐quality evidence for effects of bisphosphonates on fractures. Evidence was downgraded by three levels because most data were from studies at risk of bias (2 studies with high risk for attrition bias and 1 study with high risk for reporting bias). The design of most studies was not suitable to study the long‐term impact on fractures because the mean follow‐up period was six months, and there were few events, resulting in wide confidence intervals.
We found low‐quality evidence for adverse events. Evidence was downgraded by one level because two studies were assessed at high risk of attrition bias and downgraded another level because of inconsistency. A potential source of heterogeneity was lack of uniform definitions of adverse events reported in included studies. Adverse events were not assessed as a primary outcome in any included study, and in many studies, was not assessed at all. Furthermore, reporting of adverse events was frequently incomplete and studies were not sufficiently powered to address rare adverse effects. We tried to avoid outcome reporting bias by contacting study authors for additional data on adverse events. However, since the included studies were carried out many years ago, requests for further information frequently remained unanswered, or study authors confirmed that original study data were no longer available. Another limitation of evaluating data on adverse events from summary meta‐analyses is that study participants tend to be healthier, with less comorbid disease. Therefore, the results may not be generalisable to routine clinical practice. Furthermore, five included studies (Fraser 1997; Reid 1996; Reid 2005; Siris 1996; Walsh 2004) excluded participants with pre‐existing gastrointestinal disease. Considerable heterogeneity was found in the meta‐analysis. However, only one study reported more adverse events in placebo than bisphosphonates group participants. A sensitivity analysis excluding this study had no heterogeneity.
The quality of the evidence for withdrawals due to adverse events was assessed as moderate. Evidence was downgraded by one level because four of the studies were assessed at high risk of bias: three for attrition bias (Altman 1973; O'Doherty 1992; Reginster 1992); and one for reporting bias in (O'Doherty 1992). Although there was a wide confidence interval due to few events, this outcome was not downgraded because the relative risk was close to one.
Another methodological limitation concerned concealment of treatment allocation methods which were unclear in 15 of 20 included studies.
Another limitation was the length of follow‐up. Most studies were short‐term with duration of six months or fewer. It was difficult to extrapolate beyond the duration of follow‐up studies in this review with respect to long‐term impact on fractures and other complications of Paget's disease of bone.
Only a few included studies provided data for comparisons between bisphosphonates. The quality of evidence for comparisons between two non‐aminobisphosphonates was low; only one trial compared tiludronate versus etidronate. The quality of evidence for aminobisphosphonates versus non‐aminobisphosphonates was low; only two small trials provided data. Evidence for comparison among aminobisphosphonates was also low because only four studies provided data; of these two were open label, and one was published only in abstract form. The quality of evidence for the comparison between zoledronate and risedronate was drawn from a trial that compared these bisphosphonates (357 participants), with a low risk of bias for most of the endpoints assessed.
Evidence from PRISM trial (Langston 2010), and its extension study which compared two treatment strategies (Tan 2017), was limited by assessment of high risk of bias for patient‐reported outcomes due to its open‐label design. However the PRISM and PRISM‐EZ studies were the only trials that collected data on fractures and need for orthopaedic procedures.
Potential biases in the review process
The principal limitation of this review was the limited evidence provided by the included studies and low‐quality evidence for patient‐related outcomes that were the focus of the review, such as fractures, need for orthopaedic procedures, bone deformity and progression of deafness. Many included studies were assessed at high risk of bias or were relatively small and underpowered. Reporting of study design and methods was generally poor, especially among the older trials. We found protocols or trial registration records for four included studies (Langston 2010; Reid 2004; Reid 2005; Tan 2017).
Reporting bias was difficult to evaluate since the planned funnel plots for all analysed outcomes could not be constructed due to there being few included studies for each outcome. We made attempts to reduce reporting bias and to find unpublished studies by gathering information in clinical trial registers, contacting experts in the field and checking for abstracts presented at scientific meetings. It is therefore unlikely that reporting was high for aminobisphosphonates since these drugs' trials were performed from the 1990s to the first decade of the 21st century when nearly all studies should be registered. Nonetheless, it is possible that we have missed some old studies from the 1970s to the 1990s when there were no systematic registers of clinical trials.
We conducted an extensive search of the literature in all relevant databases and identified two ongoing trials. For rare adverse events we searched in the websites of four regulatory agencies (FDA, EMA, AADRB and MHRA). We attempted to obtain missing data by contacting study authors or to extract data from figures in reports. However, few data were obtained from attempts to contact study authors.
Agreements and disagreements with other studies or reviews
We summarised the evidence from randomised controlled trials designed to test bisphosphonates as a treatment for people with Paget's disease of bone. We did not find any other systematic reviews that analysed bisphosphonates in Paget's disease of bone. We found four relevant clinical guidelines: the Bone and Tooth Society of Great Britain and the National Association for the Relief of Paget’s Disease guideline (Selby 2002), the Belgian guideline (Devogelaer 2008); the Japanese guideline (Takata 2006) and the Endocrine Society Clinical Practice Guideline (Singer 2015).
Findings from our review agree with the British guideline (Selby 2002) which stated that "...bone pain is the only complication of Paget's disease of bone for which there is firm evidence that specific anti pagetic therapy is associated with clinical benefit". Four of the five studies cited in support of this statement were included in our review (Altman 1973; Ralston 1987; Reginster 1992; Reid 1996); one was excluded (Khairi 1974; Characteristics of excluded studies). Selby 2002 also stated there was no evidence to support the use of specific treatment to prevent deafness, fractures, osteoarthritis, progression of bone deformity or spinal cord compression.
Other guidelines support pain as the only evidence‐based indication for the treatment of Paget's disease of bone.
Ralston 2013 highlighted inclusion of zoledronate versus risedronate trials (Reid 2005) which reported a better profile for zoledronate for normalising alkaline phosphatase and evidence for benefit in some aspects of quality of life.
Our review findings disagreed with certain aspects of the Endocrine Society guideline which suggested that bisphosphonate therapy should be given to normalise biochemical markers of bone turnover with the aim of preventing complications (Singer 2015). We found no evidence of benefit for this strategy in participants with established Paget's disease of bone and there was some evidence that it may even be harmful (Tan 2017).

Geometry of the network of randomised trials of bisphosphonates for Paget's disease of bone. The nodes of the network represent the treatments compared. The links reflect comparisons and the number of links is proportional to the number of comparisons

Study flow diagram

Risk of bias summary: review authors' judgements about each risk of bias item for each included study

Risk of bias graph: review authors' judgements about each risk of bias item presented as percentages across all included studies

Forest plot of comparison: 1 Bisphosphonates versus placebo, outcome: 1.2 Number of participants with change in bone pain

Forest plot of comparison: 1 Bisphosphonates versus placebo, outcome: 1.4 Number of participants who experienced adverse events related to use of bisphosphonates

Comparison 1 Bisphosphonates versus placebo, Outcome 1 Number of participants whose bone pain disappeared completely.
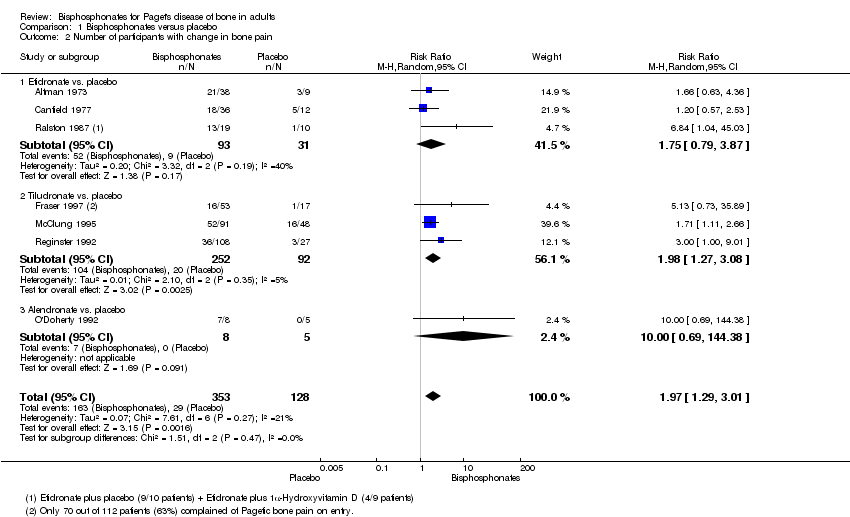
Comparison 1 Bisphosphonates versus placebo, Outcome 2 Number of participants with change in bone pain.

Comparison 1 Bisphosphonates versus placebo, Outcome 3 Number of participants experiencing radiologically‐confirmed clinical fractures.

Comparison 1 Bisphosphonates versus placebo, Outcome 4 Number of participants who experienced adverse events related to use of bisphosphonates.

Comparison 1 Bisphosphonates versus placebo, Outcome 5 Number of participants who withdrew due to adverse events.

Comparison 1 Bisphosphonates versus placebo, Outcome 6 Mean percentage change from baseline in serum total alkaline phosphatase level.

Comparison 1 Bisphosphonates versus placebo, Outcome 7 Number of participants who achieved normalised alkaline phosphatase level.

Comparison 2 Aminobisphosphonates versus non‐aminobisphosphonates, Outcome 1 Mean change from baseline in pain.

Comparison 2 Aminobisphosphonates versus non‐aminobisphosphonates, Outcome 2 Number of participants who experienced adverse events related to use of bisphosphonates.

Comparison 2 Aminobisphosphonates versus non‐aminobisphosphonates, Outcome 3 Number of participants who withdrew due to adverse events.

Comparison 2 Aminobisphosphonates versus non‐aminobisphosphonates, Outcome 4 Mean percentage change from baseline in serum total alkaline phosphatase level.

Comparison 2 Aminobisphosphonates versus non‐aminobisphosphonates, Outcome 5 Number of participants who achieved normalised alkaline phosphatase level.
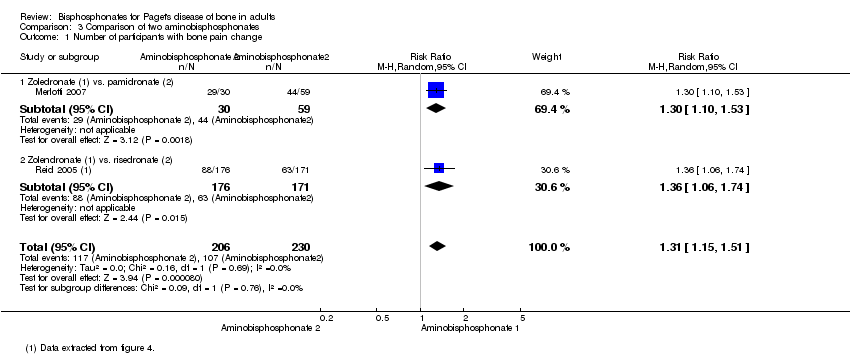
Comparison 3 Comparison of two aminobisphosphonates, Outcome 1 Number of participants with bone pain change.

Comparison 3 Comparison of two aminobisphosphonates, Outcome 2 Number of participants who experienced adverse events related to use of bisphosphonates.
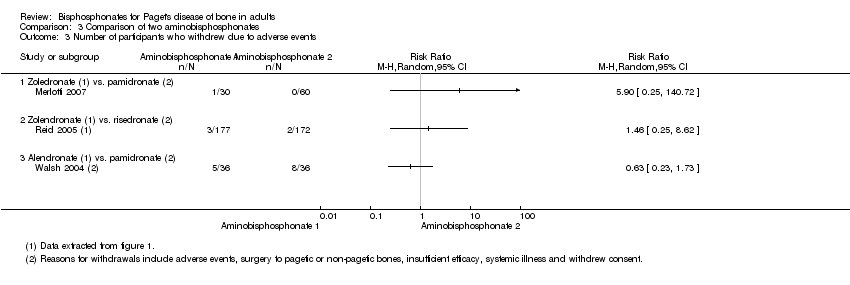
Comparison 3 Comparison of two aminobisphosphonates, Outcome 3 Number of participants who withdrew due to adverse events.

Comparison 3 Comparison of two aminobisphosphonates, Outcome 4 Mean percentage change from baseline in serum total alkaline phosphatase level.

Comparison 3 Comparison of two aminobisphosphonates, Outcome 5 Number of participants who achieved normalised alkaline phosphatase level.

Comparison 3 Comparison of two aminobisphosphonates, Outcome 6 Number of participants who experienced biochemical relapse with increased alkaline phosphatase level.
| Bisphosphonates versus placebo for Paget's disease of bone | ||||||
| Patient or population: Paget's disease of bone Comparison: Placebo | ||||||
| Outcomes | Anticipated absolute effects* (95% CI) | Relative effect | № of participants | Quality of the evidence | Comments | |
| Risk with placebo | Risk with bisphosphonates | |||||
| Number of participants with change in bone pain (disappearance of pain)¹ | Study population | RR 3.42 | 205 | ⊕⊕⊕⊝ | NNTB 5 (1 to 35) Absolute risk difference: 23% more (12% to 34%) Relative percent change: 242 % (31% to 790%) (Improvement) | |
| 91 per 1000 | 311 per 1000 | |||||
| Number of participants who experienced radiologically‐confirmed fractures | Low (study population)³ | RR 0.89 | 356 | ⊕⊝⊝⊝ | Absolute risk difference: 1% more (‐2% to 5%) Relative percentage change: 11% (‐82% to 331%) (improvement) Effect is uncertain due to very low quality evidence | |
| 0 per 1000 | 0 per 1000 | |||||
| Moderate³ | ||||||
| 9 per 1000 | 8 per 1000 (2 to 39) | |||||
| High³ | ||||||
| 52 per 1000 | 46 per 1000 (9 to 224) | |||||
| Number of participants who needed orthopaedic surgery (not measured) | See comments | See comments | Not estimable | 0 (0 RCTs) | See comments | Outcome not reported in the included studies |
| Number of participants with change in quality of life measures (not measured) | See comments | See comments | Not estimable | 0 (0 RCTs) | See comments | Outcome not reported in the included studies |
| Number of participants with change in hearing thresholds (not measured) | See comments | See comments | Not estimable | 0 (0 RCTs) | See comments | Outcome not reported in the included studies |
| Number of participants who experienced side effects related to use of bisphosphonates | Study population | RR 1.32 | 678 | ⊕⊕⊝⊝ | Absolute risk difference: 11% more (0% to 22%) Relative percent change: 32 % (‐10% to 92%) (worsening) Gastrointestinal side effects (diarrhoea, dyspepsia, vomiting, nausea, oesophagitis or gastritis) were the most common | |
| 483 per 1000 | 638 per 1000 | |||||
| Number of participants who withdrew due to adverse events | Study population | RR 1.01 | 517 | ⊕⊕⊝⊝ | Absolute risk difference: 0% (‐4% to 3%) Relative percent change: 1% (‐59% to 152%) (worsening) | |
| 41 per 1000 | 41 per 1000 | |||||
| *The risk in the intervention group (and its 95% CI) is based on the assumed risk in the comparison group and the relative effect of the intervention (and its 95% CI). | ||||||
| GRADE Working Group grades of evidence | ||||||
| ¹ When pain was assessed as any pain reduction instead of disappearance of pain, the outcomes were consistent: 227 per 1000 in placebo vs. 446 per 1000 (292 to 682) in bisphosphonates group (RR 1.97, 95% CI 1.29 to 3.01), NNTD 4 (2 to 13), absolute risk difference 33% more (18% to 49%), relative percentage change 97% (29% to 201% improvement), based on results from seven RCTs (481 participants). Visual analogue scale ranging from 0 to 10 was used in four of the seven studies. One study classified pain in three groups; the tool used for pain assessment was not detailed in the other two studies. Moderate quality evidence: downgraded by one level; there was high risk for attrition bias in three studies and high risk for reporting bias in three studies. The outcome did not change in a sensitive analysis excluding high risk of bias studies. ² Downgraded by one level (imprecision). Few events, resulting in wide CI. ³ The 0% calculated assumed risk in the control group (no fractures in placebo group) is misleading. This outcome is likely due to the short follow‐up period of the studies. To give a more accurate data we have added two scenarios of moderate and high prevalence using data from a study with a longest follow‐up period, the PRISM‐EZ trial (Tan 2017). In summary there are three scenarios to calculate the assumed risk in the control group: 1) To calculate low prevalence we used data from the included studies (placebo groups). 2) To calculate moderate prevalence we used the percentage of fractures in bones affected by Paget's disease of bone in the symptomatic treatment arm of the PRISM‐EZ trial. 3) To calculate high prevalence we used the percentage of fractures in both affected and unaffected bones in the symptomatic treatment arm of the PRISM‐EZ trial. ⁴ Downgraded by two levels (limitation of studies). Most data were from studies assessed at high risk of bias; there was high risk for attrition bias in two studies and high risk for reporting bias in one study. ⁵ Downgraded by one level (indirectness). Long‐term impact on fractures was not assessed. ⁶ Downgraded by one level (limitation of studies). High risk for attrition bias in two studies. ⁷ Downgraded by one level (inconsistency). The side effects considered in the studies were heterogeneous. In addition, considerable heterogeneity was found when the six studies were meta‐analysed (I² = 75%, P = 0.001). However, only one study (McClung 1995) showed more adverse events in the placebo group than the bisphosphonates group. The heterogeneity could not be explained by differences in design of this study since it was similar to other studies. A sensitivity analysis excluding this study found low heterogeneity I² = 6% (RR 1.38, 95% CI 1.08 to 1.78). ⁸ Downgraded by two levels. Half of the included studies were assessed at high risk of bias; there was high risk for attrition bias in three studies and high risk for reporting bias in one study. ⁹ Rated down for imprecision. Optimal information size criterion was not met. The 95% CI is too wide. | ||||||
| Zoledronate versus pamidronate or risedronate for Paget's disease of bone | ||||||
| Patient or population: Paget's disease of bone | ||||||
| Outcomes | Anticipated absolute effects* (95% CI) | Relative effect | № of participants | Quality of the evidence | Comments | |
| Risk with pamidronate or risedronate | Risk with zoledronate | |||||
| Number of participants with change in bone pain¹ | Study population | RR 1.31 | 436 | ⊕⊝⊝⊝ | NNTB: 7 (4 to 14) Absolute risk difference: 17% (8% to 26%) Relative percent change: 31% (15% to 51%) (improvement) Not pooled effects: Zoledronate vs. pamidronate (89 participants); RR 1.30 (1.10 to 1.53), NNTB 4 (3 to 13). Zoledronate vs. risedronate (347 participants); RR 1.36 (1.06 to 1.74), NNTB 8 (4 to 45). | |
| 465 per 1000 | 609 per 1000 | |||||
| Number of participants who experienced fractures (not measured) | See comments | See comments | Not estimable | 0 (0 RCTs) | See comments | Outcome not reported in the included studies |
| Number of participants who needed orthopaedic surgery (not measured) | See comments | See comments | Not estimable | 0 (0 RCTs) | See comments | Outcome not reported in the included studies |
| Number of participants with change in quality of life measures (not measured) | See comments | See comments | Not estimable | 0 (0 RCTs) | See comments | Effect is uncertain. Zoledronate showed a marginal improvement at 6 months in QoL when compared with risedronate. The physical component summary score of SF‐36 improved with zoledronate compared to risedronate (1.6 vs. 0.3 change from baseline score, on a 0 to 100 scale). This result is unlikely to be of clinical importance |
| Number of participants with change in hearing thresholds (not measured) | See comments | See comments | Not estimable | 0 (0 RCTs) | See comments | Outcome not reported in the included studies |
| Number of participants who experienced side effects related to use of bisphosphonates. | Study population | RR 1.05 | 437 | ⊕⊕⊝⊝ | Absolute risk difference: 4% (‐4% to 12%) Relative percent change: 5% (‐5% to 16%) (worsening) | |
| 745 per 1000 | 782 per 1000 | |||||
| Number of participants who withdrew due to adverse events (withdrawals) | Study population | RR 2.04 | 437 | ⊕⊝⊝⊝ | Absolute risk difference: 1% (‐2% to 3%) Relative percent change: 104% (‐57% to 859%) (worsening) | |
| 9 per 1000 | 18 per 1000 | |||||
| *The risk in the intervention group (and its 95% CI) is based on the assumed risk in the comparison group and the relative effect of the intervention (and its 95% CI). | ||||||
| GRADE Working Group grades of evidence | ||||||
| ¹Unlike summary of findings Table for the main comparison (comparing bisphosphonates vs. placebo) when compared zoledronate vs pamidronate or risedronate we used any change of pain instead of disappearance of pain because data were not available. However, readers could find data on disappearance of pain in the original zoledronate vs. pamidronate manuscript (Merlotti 2007) [10/47 vs. 6/60, RR 2.12 95% IC 0.83‐5.43]. We did not include these data because we think they are misleading. They come from accumulate zoledronate effects in two different study phases (30 zoledronate patients from phase 1 + 17 patients no responders to pamidronate in phase 1 treated with zoledronate in phase 2) vs. pamidronate in only one study phase (60 patients). ² Downgraded by two levels (limitation of studies). Information is from studies at high risk of bias. High risk for performance bias in 1 study and high risk for reporting bias in 1 study. ³ Downgraded by one level (indirectness). In the risedronate study, the author assessed bodily pain but not bone pain associated directly with Paget's bone lesions (Change in bone pain was defined as"5‐point improvement from baseline" in SF‐36 bodily pain item). In the pamidronate study change in bone pain was defined as "subjects reported disappearance or decrease in pain". ⁴Downgraded by one level (imprecision). There were few events, resulting in wide CI, | ||||||
| Study ID | Intervention | Comparator | Alkaline phosphatase | Follow‐up | N | Age | Male | Symptomatic | Previously treated |
| Etidronate | Placebo | Yes | 6 m | 50 | 67 y | 60% | NA | NA | |
| Etidronate | Placebo | Yes | 6 m | 48 | NA | 58% | NA | NA | |
| Etidronate | Placebo | No | 3 m | 32 | NA | NA | 100% | 38% | |
| Tiludronate | Placebo | Yes | 6 m | 112 | 70 y | 54% | 63% | NA | |
| Tiludronate | Placebo | Yes | 6 m | 139 | 70 y | 54% | NA | NA | |
| Tiludronate | Placebo | Yes | 6 m | 149 | 69 y | 54% | NA | 82% | |
| Alendronate | Placebo | Yes | 6 m | 15 | 67 y | 60% | 87% | 66% | |
| Alendronate | Placebo | Yes | 6 m | 55 | 70 y | 56% | NA | 35% | |
| Zoledronate | Placebo | Yes | 3 m | 176 | 71 y | 61% | NA | NA | |
| Ibandronate | Placebo | Yes | 6 m | 25 | 73 y | 74% | NA | 64% | |
| Tiludronate | Etidronate | Yes | 6m | 234 | 69y | 59% | 74% | 71% | |
| Alendronate | Etidronate | Yes | 6m | 89 | 69y | 67% | NA | 25% | |
| Risedronate | Etidronate | Yes | 12 m | 123 | 66 y | 69% | 91% | 72% | |
| Alendronate | Pamidronate | Yes | 12 m | 72 | 70 y | 58% | 94% | 39% | |
| Olpadronate | Pamidronate | Yes | 6 m | 27 | NA | NA | NA | NA | |
| Zoledronate | Pamidronate | Yes | 6 m | 90 | 70 y | 69% | 99% | 67% | |
| Zoledronate | Risedronate | Yes | 6 m | 357 | 70 y | 68% | NA | 54% | |
| Etidronate + calcitonin | Etidronate | Yes | 12 m | 44 | NA | NA | 100% | 10% | |
| Intensive | Symptomatic | No | 3 y | 1331 | 74 y | 51% | 69% | NA | |
| Intensive | Symptomatic | No | 3 y | 502 | 76 y | 55% | 63% | 70% | |
| Alkaline phosphatase: Serum total alkaline phosphatase above the upper limit of normal as an inclusion criterion. Follow‐up: Extended follow‐up periods are shown in parentheses. N: Number of randomised participants. NA: Not available. SC: Sample size calculated before study. | |||||||||
| Study ID | Outcome | Zoledronate | Risedronate | RR (95% IC) | ||
| Events | N | Events | N | |||
| Radiologically‐confirmed clinical fracture | 2 | 177 | 2 | 172 | 0.97 (0.14 to 6.82) | |
| Reid 2011 (extension) | Radiologically‐confirmed clinical fracture | 3 | 152 | 1 | 115 | 2.30 (0.24 to 22.36) |
| Quality of life change from baseline | 48 | 176 | 36 | 171 | 1.30 (0.89 to 1.89) | |
| Reid 2011 (extension) | Clinical relapse | 14 | 152 | 29 | 115 | 0.30 (0.15 to 0.60) |
| Study ID | Outcome | Mean (SD) | N | Mean (SD) | N | Mean difference |
| Mean change from baseline in pain | ‐0.5 (1.75) | 101 | ‐0.4 (2.13) | 92 | ‐0.10 (‐0.65 to 0.45) | |
| Mean change from baseline in quality of life¹ | 1.5 (0.5) | 176 | 0.2 (0.6) | 171 | 1.30 (1.18 to 1.42) | |
| Reid 2011 (extension) | Mean change from baseline in total SF‐36 score² | 1.3 (3.1) | 152 | ‐2.5 (2.6) | 115 | 3.8 (3.12 to 4.49) |
| ¹Physical‐component summary (data extracted from Figure 4 in Reid 2005). ²Total SF‐36 scores to 54 months (data extracted from Figure 6 in Reid 2011 extension) (+1.3 ± 3.1 versus ‐2.5 ± 2.6) [D] | ||||||
| Ouctome | Etidronate plus calcitonin | Etidronate | RR (95% IC) | ||
| Events | N | Events | N | ||
| Change in bone pain | 10 | 21 | 15 | 23 | 0.73 (0.43 to 1.25) |
| Study ID | Outcome | Intensive | Symptomatic | RR (95% IC) | ||
| Events | N | Events | N | |||
| Improvement in bone pain | 78 | 295 | 96 | 311 | 0.86 (0.67 to 1.10) | |
| Radiologically‐confirmed fractures | 46 | 661 | 49 | 663 | 0.94 (0.64 to 1.39) | |
| Radiologically‐confirmed fractures*¹ | 22 | 270 | 12 | 232 | 1.58 (0.80 to 3.11) | |
| Radiologically‐confirmed fractures (pagetic bone) | 8 | 661 | 13 | 663 | 0.62 (0.25 to 1.49) | |
| Radiologically‐confirmed fractures (pagetic bone)¹ | 5 | 270 | 2 | 232 | 2.15 (0.42 to 10.96) | |
| Number of orthopaedic surgeries | 48 | 661 | 55 | 663 | 0.88 (0.60 to 1.27) | |
| Number of orthopaedic surgeries¹ | 15 | 270 | 7 | 232 | 1.84 (0.76 to 4.44) | |
| Number of orthopaedic procedures | 50 | 661 | 63 | 663 | 0.78 (0.53 to 1.15) | |
| Number of orthopaedic procedures | 16 | 270 | 9 | 232 | 1.52 (0.69 to 3.39) | |
| Change in hearing thresholds² | 134 | 505 | 133 | 486 | 0.97 (0.79 to 1.19) | |
| Hearing classification worse at study end (left ear)³ | 6 | 50 | 8 | 63 | 0.95 (0.35 to 2.55) | |
| Hearing classification worse at study end (right ear)³ | 4 | 51 | 8 | 60 | 0.58 (0.19 to 1.84) | |
| Serious adverse events | 345 | 661 | 359 | 663 | 0.96 (0.87 to 1.07) | |
| Serious adverse events | 87 | 270 | 66 | 232 | 1.13 (0.87 to 1.48) | |
| Withdrawal due to adverse events⁴ | 83 | 661 | 79 | 663 | 1.05 (0.79 to 1.41) | |
| Normalised alkaline phosphatase levels | 512 | 661 | 406 | 663 | 1.26 (1.18 to 1.36) | |
| Study ID | Outcome | Mean (SD) | N | Mean (SD) | N | Mean difference |
| Mean change from baseline in quality of life (bodily pain SF‐36)⁵ | ‐0.4 (8.9) | 479 | 0.3 (9.4) | 477 | ‐0.7 (‐1.8 to 0.5) | |
| Mean change from baseline in quality of life (bodily pain SF‐36)⁶ | 0.1 (9.3) | 149 | ‐1.0 (9.1) | 138 | ‐1.0 (‐3.0 to 1.1) | |
| Mean change from baseline in quality of life (physical summary SF‐36)*⁵ | ‐1.2 (8.1) | 408 | ‐1.1 (8.2) | 396 | ‐0.1 (‐1.3 to 1.0) | |
| Mean change from baseline in quality of life (physical summary SF‐36)⁶ | ‐1.0 (7.7) | 144 | ‐2.7 (7.7) | 126 | ‐1.6 (‐3.4 to 0.3) | |
| Mean change from baseline in quality of life (mental summary SF‐36)*⁵ | ‐1.7 (10.2) | 408 | ‐2.6 (10.9) | 396 | 0.9 (‐0.6 to 2.3) | |
| Mean change from baseline in quality of life (mental summary SF‐36)⁶ | ‐1.0 (10.0) | 144 | ‐0.4 (9.9) | 126 | ‐0.6 (‐1.7 to 3.1) | |
| Mean hearing loss (left ear)³ | 1.8 (14.6) | 50 | 0.0 (12.6) | 63 | 1.8 (‐3.4 to 7.0) | |
| Mean hearing loss (right ear)³ | 2.5 (5.7) | 51 | 2.1 (9.4) | 60 | 0.5 (‐2.4 to 3.3) | |
| Mean percentage change from baseline in serum total alkaline phosphatase activity | ‐40.5 (23.7) | 430 | ‐18 (71.2) | 424 | ‐22.5 (‐29.6 to ‐15.4) | |
| Mean percentage change from baseline in adjusted serum total alkaline phosphatase activity | ‐0.15 (0.72) | 203 | ‐0.05 (0.75) | 181 | ‐0.11 (‐0.03 to 0.25) | |
| Data at 24 months for Langston 2010. ¹Data shown for these outcomes are number of events, patient years of follow up, rate ratios and 95% CI calculated using the method described by Cohen 2011. ²Number of participants using hearing aids at the end of the study. ³Patients with baseline and end of the trial measurements. ⁴Serious adverse event: any untoward medical occurrence that: 1) results in death, 2) is life‐threatening, 3) requires inpatient hospitalisation or prolongation of existing hospitalisation, 4) results in persistent or significant disability/incapacity, or 5) is a congenital anomaly/birth defect. ⁵Data at 24 months. ⁶Difference between baseline and 36 months. | ||||||
| Outcome | Tiludronate | Etidronate | RR (95% IC) | ||
| Events | N | Events | N | ||
| Number of participants with change in bone pain | 32 | 120 | 10 | 52 | 1.39 (0.74 to 2.61) |
| Number of participants with radiologically‐confirmed fractures | 1 | 155 | 2 | 79 | 0.25 (0.02 to 2.77) |
| Number of participants with severe side effects | 75 | 155 | 27 | 79 | 1.42 (1.00 to 2.00) |
| Number of participants who withdrew due to adverse events | 10 | 155 | 2 | 79 | 2.55 (0.57 to 11.35) |
| Number of participants who normalised alkaline phosphatase levels | 40 | 155 | 9 | 79 | 2.27 (1.16 to 4.43) |
| Study ID | Comparison | Side effect | Bisphosphonate | Placebo | RR (95% CI) |
| Etidronate (38) vs. placebo (9) | Diarrhoea | 5 (13%) | 1 (11%) | 1.18 (0.16 to 8.93) | |
| Zoledronate (141) vs. placebo (35) | Fatigue Fever Arthralgia Pain, back Pain, skeletal Hypocalcaemia | 12 (9%) 7 (5%) 15 (11%) 14 (10%) 11 (8%) 3 (2%) | 0 (0%) 0 (0%) 3 (9%) 1 (3%) 2 (6%) 0 (0%) | 6.34 (0.38 to 104.5) 3.80 (0.50 to 28.88) 1.24 (0.89 to 1.77) 3.47 (0.53 to 23.02) 1.37 (0.85 to 2.19) 1.78 (0.74 to 4.24) | |
| Tiludronate (86) vs. placebo (26) | Nausea Vomiting Dyspepsia Diarrhoea Arthralgia Skeletal pain Raised liver enzymes Eosinophilia | 15 (17%) 7 (7%) 9 (10%) 14 (16%) 8 (9%) 5 (6%) 1 (1%) 0 (0%) | 2 (8%) 0 (0%) 0 (0%) 0 (0%) 2 (8%) 3 (12%) 0 (0%) 1 (4%) | 2.27 (0.65 to 7.86) 4.66 (0.45 to 48.06) 5.90 (0.40 to 87.16) 9.00 (0.32 to 252.8) 1.21 (0.91 to 1.61) 0.50 (0.13 to 1.97) 0.93 (0.04 to 22.20) 0.10 (0.01 to 2.47) | |
| Tiludronate (91) vs. placebo (48) | Gastrointestinal | 31 (34%) | 15 (31%) | 1.09 (0.66 to 1.81) | |
| Tiludronate (117) vs. placebo (32) | Gastralgia Nausea | 20 (17.1%) 11 (9.4%) | 5 (16.1%) 3 (9.6%) | 1.09 (0.45 to 2.69) 1.00 (0.30 to 3.38) | |
| Alendronate (27) vs. placebo (28) | Gastrointestinal Gastritis Duodenal ulcer Oesophagitis | 2 (7%) 0 (0%) 0 (0%) 1 (4%) | 5 (18%) 1 (4%) 1 (4%) 0 (0%) | 0.42 (0.09 to 2.00) 0.35 (0.02 to 8.13) 0.35 (0.02 to 8.13) 3.10 (0.13 to 73.10) |
| Study ID | Comparison | Adverse effect | Bisphosphonate 1 | Bisphosphonate 2 | RR (95% CI) |
| Tiludronate (155) vs. etidronate (79) | Gastrointestinal | 32 (20.8%) | 10 (12.7%) | 1.63 (0.85 to 3.14) | |
| Abdominal pain | 10 (6.5%) | 2 (2.5%) | 2.55 (0.57 to 11.35) | ||
| Nausea, vomiting | 8 (5.2%) | 2 (2.5%) | 2.04 (0.44 to 9.37) | ||
| Fracture | 1 (1%) | 2 (3%) | 0.25 (0.02 to 2.77) | ||
| Alendronate (42) vs. etidronate (47) | Gastrointestinal | 11 (26%) | 10 (21%) | 1.23 (0.58 to 2.60) | |
| Abdominal distention | 0 (%) | 1 (2%) | 0.37 (0.02 to 8.90) | ||
| Abdominal pain | 3 (7%) | 4 (9%) | 0.84 (0.2 to 3.54) | ||
| Acid regurgitation | 1 (2%) | 1 (2%) | 1.12 (0.07 to 17.34) | ||
| Dyspepsia | 0 (0%) | 1 (2%) | 0.37 (0.02 to 8.90) | ||
| Melena | 1 (2%) | 0 (0%) | 3.35 (0.14 to 80.05) | ||
| Nausea | 2 (5%) | 3 (6%) | 0.75 (0.13 to 4.25) | ||
| Leg pain | 1 (2%) | 9 (19%) | 0.12 (0.02 to 0.94) | ||
| Laboratory adverse experiences | 9 (21%) | 6 (13%) | 1.68 (0.65 to 4.32) | ||
| Risedronate (62) vs. etidronate (61) | Upper gastrointestinal | 12 (19%) | 12 (20%) | 0.98 (0.48 to 2.02) | |
| Olpadronate (14) vs. pamidronate (7) | Digestive | 9 (64%) | 7 (100%) | 0.68 (0.44 to 1.03) | |
| Zoledronate (47)* vs. pamidronate (60) | Influenza‐like illness | 4 (9%) | 5 (8%) | 1.02 (0.29 to 3.59) | |
| Myalgia | 3 (6%) | 4 (7%) | 0.96 (0.23 to 4.07) | ||
| Pyrexia | 3 (6%) | 4 (7%) | 0.96 (0.23 to 4.07) | ||
| Fatigue | 3 (6%) | 8 (13%) | 0.48 (0.13 to 1.71) | ||
| Headache | 4 (9%) | 5 (8%) | 1.02 (0.29 to 3.59) | ||
| Diarrhoea | 1 (2%) | 2 (3%) | 0.64 (0.06 to 6.83) | ||
| Bone pain | 3 (6%) | 6 (10%) | 0.64 (0.17 to 2.42) | ||
| Pain in arm or leg | 3 (6%) | 4 (7%) | 0.96 (0.23 to 4.07) | ||
| Hypocalcaemia | 3 (6%) | 1 (2%) | 3.83 (0.41 to 35.64) | ||
| Dermatitis | 1 (2%) | 0 (0%) | 0.42 (0.02 to 10.17) | ||
| Zoledronate (177) vs. risedronate (172) | Study days 1 to 3 | ||||
| Influenza‐like illness | 17 (9.6%) | 7 (4.1%) | 2.36 (1 to 5.55) | ||
| Myalgia | 13 (7.3%) | 6 (3.5%) | 2.11 (0.82 to 5.41) | ||
| Pyrexia | 13 (7.3%) | 1 (0.6%) | 12.63 (1.67 to 95.53) | ||
| Fatigue | 12 (6.8%) | 4 (2.3%) | 2.92 (0.96 to 8.86) | ||
| Headache | 12 (6.8%) | 7 (4.1%) | 1.67 (0.67 to 4.13) | ||
| Rigor | 12 (6.8%) | 1 (0.6%) | 11.66 (1.53 to 88.72) | ||
| Nausea | 11 (6.2%) | 3 (1.7%) | 3.56 (1.01 to 12.55) | ||
| Bone pain | 9 (5.1%) | 2 (1.2%) | 4.37 (0.96 to 19.95) | ||
| After study day 3 | |||||
| Pain in an arm or leg | 13 (7.3%) | 12 (7%) | 1.05 (0.49 to 2.24) | ||
| Arthralgia | 9 (5.1%) | 19 (11%) | 0.46 (0.21 to 0.99) | ||
| Dizziness | 9 (5.1%) | 5 (2.9%) | 1.75 (0.6 to 5.11) | ||
| Nasopharyngitis | 9 (5.1%) | 14 (8.1%) | 0.62 (0.28 to 1.41) | ||
| Diarrhoea | 8 (4.5%) | 9 (5.2%) | 0.86 (0.34 to 2.19) | ||
| Headache | 7 (4%) | 10 (5.8%) | 0.68 (0.26 to 1.75) | ||
| Back pain | 4 (2.3%) | 12 (7.0%) | 0.32 (0.11 to 0.98) | ||
| Symptomatic hypocalcaemia | 2 (1.1%) | 1 (0.6%) | 1.94 (0.18 to 21.24) | ||
| Reid 2011 (extension) | Zoledronate (152) vs. risedronate (115) | Atrial fibrillation | 1 (0.7%) | 1 (0.9%) | 0.76 (0.05 to 12.20) |
| Atrial flutter | 0 (0%) | 2 (1.7%) | 0.15 (0.01 to 3.13) | ||
| Osteonecrosis jaw | 0 (0%) | 0 (0%) | ‐ | ||
| Alendronate (36) vs. pamidronate (36) | Gastrointestinal | 16 (44%) | 4 (11%) | 4 (1.48 to 10.80) | |
| Fatigue | 0 (0%) | 23 (64%) | 0.02 (0.00 to 0.34) | ||
| General aches/pain | 4 (11%) | 16 (44%) | 0.25 (0.09 to 0.68) | ||
| Deteriorating kidney failure | 1 (3%) | 0 (0%) | 3.00 (0.12 to 71.28) | ||
| *Zoledronate group data were extracted from Table 3 in Merlotti 2007. In this table, the authors presented data from 30 participants who took part in the first part of the study (which was included in our systematic review) plus 17 participants from the second part of the study (which was not included in our systematic review). | |||||
| Study ID | Comparison | Side effect | Intensive | Symptomatic | RR (95% CI) |
| Intensive (661) vs. symptomatic (663) | All adverse events Serious adverse events Musculoskeletal Sensory Gastrointestinal Cardiovascular Arrythmia Cancer Renal Other | 3429 345 691 203 172 360 13 (1.9%) 55 98 1850 | 3471 359 734 196 157 327 7 (1%) 47 78 1932 | ‐ ‐ ‐ ‐ ‐ ‐ 1.86 (0.75 to 4.64) ‐ ‐ ‐ | |
| Intensive (270) vs. symptomatic (232) | All adverse events Serious adverse events Musculoskeletal Osteonecrosis of the jaw Delayed union of fracture Ophthalmic Uveitis Gastrointestinal Cardiovascular Arrythmia Cerebrovascular Central nervous system Endocrine Ear, nose or throat Genitourinary Haematological Respiratory Skin Miscellaneous | 226 87 123 1 2 34 1 54 67 14 4 28 28 28 41 10 48 41 33 | 196 66 104 0 1 41 0 46 49 8 3 28 21 26 39 9 43 33 32 | 0.99 (0.91 to 1.07) 1.13 (0.87 to 1.48) 1.02 (0.84 to 1.23) 2.58 (0.11 to 63.01) 1.72 (0.16 to 18.83) 0.71 (0.47 to 1.08) 2.58 (0.11 to 63.01) 1.01 (0.71 to 1.43) 1.18 (0.85 to 1.62) 1.50 (0.64 to 3.52) 1.14 (0.26 to 5.07) 0.86 (0.52 to 1.41) 1.15 (0.68 to 1.96) 0.93 (0.56 to 1.53) 0.90 (0.61 to 1.35) 0.96 (0.40 to 2.31) 0.95 (0.66 to 1.39) 1.07 (0.70 to 1.63) 0.89 (0.56 to 1.40) | |
| * Data represent total numbers of reported side effects regardless of numbers of participants who experienced them. The authors reported numbers of participants only for arrhythmia. | |||||
| Study ID | Outcome | Tiludronate | Placebo | RR (95% IC) | ||
| Events | N | Events | N | |||
| Number of participants who relapsed due to bone pain recurrence | 23 | 66 | 13 | 19 | 0.51 (0.32 to 0.80) | |
| Study ID | Outcome | Risedronate | Tiludronate | RR (95% IC) | ||
| Events | N | Events | N | |||
| Number of participants who relapsed due to recurrence of increased serum alkaline phosphatase level | 2 | 62 | 8 | 61 | 0.25 (0.05 to 1.11) | |
| Outcome or subgroup title | No. of studies | No. of participants | Statistical method | Effect size |
| 1 Number of participants whose bone pain disappeared completely Show forest plot | 2 | 205 | Risk Ratio (M‐H, Random, 95% CI) | 3.42 [1.31, 8.90] |
| 2 Number of participants with change in bone pain Show forest plot | 7 | 481 | Risk Ratio (M‐H, Random, 95% CI) | 1.97 [1.29, 3.01] |
| 2.1 Etidronate vs. placebo | 3 | 124 | Risk Ratio (M‐H, Random, 95% CI) | 1.75 [0.79, 3.87] |
| 2.2 Tiludronate vs. placebo | 3 | 344 | Risk Ratio (M‐H, Random, 95% CI) | 1.98 [1.27, 3.08] |
| 2.3 Alendronate vs. placebo | 1 | 13 | Risk Ratio (M‐H, Random, 95% CI) | 10.00 [0.69, 144.38] |
| 3 Number of participants experiencing radiologically‐confirmed clinical fractures Show forest plot | 4 | 356 | Odds Ratio (M‐H, Random, 95% CI) | 0.89 [0.18, 4.51] |
| 3.1 Etidronate vs. placebo | 2 | 95 | Odds Ratio (M‐H, Random, 95% CI) | 0.90 [0.09, 9.06] |
| 3.2 Tiludronate vs. placebo | 2 | 261 | Odds Ratio (M‐H, Random, 95% CI) | 0.88 [0.09, 8.64] |
| 4 Number of participants who experienced adverse events related to use of bisphosphonates Show forest plot | 6 | 678 | Risk Difference (M‐H, Random, 95% CI) | 0.11 [‐0.00, 0.22] |
| 4.1 Etidronate vs. placebo | 1 | 47 | Risk Difference (M‐H, Random, 95% CI) | 0.02 [‐0.21, 0.25] |
| 4.2 Zoledronate vs. placebo | 1 | 176 | Risk Difference (M‐H, Random, 95% CI) | 0.27 [0.12, 0.42] |
| 4.3 Tiludronate vs. placebo | 3 | 400 | Risk Difference (M‐H, Random, 95% CI) | 0.07 [‐0.08, 0.22] |
| 4.4 Alendronate vs. placebo | 1 | 55 | Risk Difference (M‐H, Random, 95% CI) | 0.12 [‐0.11, 0.34] |
| 5 Number of participants who withdrew due to adverse events Show forest plot | 6 | 517 | Odds Ratio (M‐H, Random, 95% CI) | 1.01 [0.38, 2.69] |
| 5.1 Etidronate vs. placebo | 1 | 47 | Odds Ratio (M‐H, Random, 95% CI) | 0.0 [0.0, 0.0] |
| 5.2 Tiludronate vs. placebo | 3 | 400 | Odds Ratio (M‐H, Random, 95% CI) | 0.96 [0.34, 2.67] |
| 5.3 Alendronate vs. placebo | 2 | 70 | Odds Ratio (M‐H, Random, 95% CI) | 1.74 [0.06, 50.43] |
| 6 Mean percentage change from baseline in serum total alkaline phosphatase level Show forest plot | 8 | 592 | Mean Difference (IV, Random, 95% CI) | ‐50.09 [‐67.72, ‐32.46] |
| 6.1 Etidronate vs. placebo | 3 | 122 | Mean Difference (IV, Random, 95% CI) | ‐55.85 [‐66.50, ‐45.20] |
| 6.2 Zoledronate vs. placebo | 1 | 176 | Mean Difference (IV, Random, 95% CI) | ‐22.26 [‐27.99, ‐16.53] |
| 6.3 Tiludronate vs. placebo | 2 | 256 | Mean Difference (IV, Random, 95% CI) | ‐58.0 [‐64.25, ‐51.75] |
| 6.4 Alendronate vs. placebo | 1 | 15 | Mean Difference (IV, Random, 95% CI) | ‐39.9 [‐51.28, ‐28.52] |
| 6.5 Ibandronate vs. placebo | 1 | 23 | Mean Difference (IV, Random, 95% CI) | ‐96.1 [‐147.01, ‐45.19] |
| 7 Number of participants who achieved normalised alkaline phosphatase level Show forest plot | 8 | 580 | Risk Ratio (M‐H, Random, 95% CI) | 9.96 [3.74, 26.58] |
| 7.1 Etidronate vs. placebo | 3 | 121 | Risk Ratio (M‐H, Random, 95% CI) | 4.51 [0.90, 22.55] |
| 7.2 Tiludronate vs. placebo | 3 | 381 | Risk Ratio (M‐H, Random, 95% CI) | 13.79 [2.77, 68.61] |
| 7.3 Alendronate vs. placebo | 1 | 55 | Risk Ratio (M‐H, Random, 95% CI) | 27.96 [1.74, 448.28] |
| 7.4 Ibandronate vs. placebo | 1 | 23 | Risk Ratio (M‐H, Random, 95% CI) | 14.00 [0.92, 212.92] |
| Outcome or subgroup title | No. of studies | No. of participants | Statistical method | Effect size |
| 1 Mean change from baseline in pain Show forest plot | 1 | Mean Difference (IV, Random, 95% CI) | Totals not selected | |
| 1.1 Risedronate vs. etidronate | 1 | Mean Difference (IV, Random, 95% CI) | 0.0 [0.0, 0.0] | |
| 2 Number of participants who experienced adverse events related to use of bisphosphonates Show forest plot | 2 | 212 | Risk Ratio (M‐H, Random, 95% CI) | 0.98 [0.72, 1.35] |
| 2.1 Risedronate vs. etidronate | 1 | 123 | Risk Ratio (M‐H, Random, 95% CI) | 0.98 [0.68, 1.43] |
| 2.2 Alendronate vs. etidronate | 1 | 89 | Risk Ratio (M‐H, Random, 95% CI) | 0.98 [0.55, 1.76] |
| 3 Number of participants who withdrew due to adverse events Show forest plot | 2 | 212 | Risk Ratio (M‐H, Random, 95% CI) | 0.69 [0.25, 1.89] |
| 3.1 Risedronate vs. etidronate | 1 | 123 | Risk Ratio (M‐H, Random, 95% CI) | 0.79 [0.22, 2.79] |
| 3.2 Alendronate vs. etidronate | 1 | 89 | Risk Ratio (M‐H, Random, 95% CI) | 0.56 [0.11, 2.90] |
| 4 Mean percentage change from baseline in serum total alkaline phosphatase level Show forest plot | 2 | 212 | Mean Difference (IV, Random, 95% CI) | ‐40.95 [‐49.09, ‐32.81] |
| 4.1 Risedronate vs. etidronate | 1 | 123 | Mean Difference (IV, Random, 95% CI) | ‐43.9 [‐48.06, ‐39.74] |
| 4.2 Alendronate vs. etidronate | 1 | 89 | Mean Difference (IV, Random, 95% CI) | ‐35.1 [‐45.85, ‐24.35] |
| 5 Number of participants who achieved normalised alkaline phosphatase level Show forest plot | 2 | 212 | Risk Ratio (M‐H, Random, 95% CI) | 4.30 [2.72, 6.79] |
| 5.1 Risedronate vs. etidronate | 1 | 123 | Risk Ratio (M‐H, Random, 95% CI) | 4.81 [2.58, 8.98] |
| 5.2 Alendronate vs. etidronate | 1 | 89 | Risk Ratio (M‐H, Random, 95% CI) | 3.78 [1.93, 7.38] |
| Outcome or subgroup title | No. of studies | No. of participants | Statistical method | Effect size |
| 1 Number of participants with bone pain change Show forest plot | 2 | 436 | Risk Ratio (M‐H, Random, 95% CI) | 1.31 [1.15, 1.51] |
| 1.1 Zoledronate (1) vs. pamidronate (2) | 1 | 89 | Risk Ratio (M‐H, Random, 95% CI) | 1.30 [1.10, 1.53] |
| 1.2 Zolendronate (1) vs. risedronate (2) | 1 | 347 | Risk Ratio (M‐H, Random, 95% CI) | 1.36 [1.06, 1.74] |
| 2 Number of participants who experienced adverse events related to use of bisphosphonates Show forest plot | 3 | Risk Difference (M‐H, Random, 95% CI) | Totals not selected | |
| 2.1 Olpadronate (1) vs. pamidronate (2) | 1 | Risk Difference (M‐H, Random, 95% CI) | 0.0 [0.0, 0.0] | |
| 2.2 Zoledronate (1) vs. pamidronate (2) | 1 | Risk Difference (M‐H, Random, 95% CI) | 0.0 [0.0, 0.0] | |
| 2.3 Zolendronate (1) vs. risedronate (2) | 1 | Risk Difference (M‐H, Random, 95% CI) | 0.0 [0.0, 0.0] | |
| 3 Number of participants who withdrew due to adverse events Show forest plot | 3 | Risk Ratio (M‐H, Random, 95% CI) | Totals not selected | |
| 3.1 Zoledronate (1) vs. pamidronate (2) | 1 | Risk Ratio (M‐H, Random, 95% CI) | 0.0 [0.0, 0.0] | |
| 3.2 Zolendronate (1) vs. risedronate (2) | 1 | Risk Ratio (M‐H, Random, 95% CI) | 0.0 [0.0, 0.0] | |
| 3.3 Alendronate (1) vs. pamidronate (2) | 1 | Risk Ratio (M‐H, Random, 95% CI) | 0.0 [0.0, 0.0] | |
| 4 Mean percentage change from baseline in serum total alkaline phosphatase level Show forest plot | 3 | Mean Difference (IV, Fixed, 95% CI) | Totals not selected | |
| 4.1 Olpadronate (1) vs. pamidronate (2) | 1 | Mean Difference (IV, Fixed, 95% CI) | 0.0 [0.0, 0.0] | |
| 4.2 Zolendronate (1) vs. risedronate (2) | 1 | Mean Difference (IV, Fixed, 95% CI) | 0.0 [0.0, 0.0] | |
| 4.3 Alendronate (1) vs. pamidronate (2) | 1 | Mean Difference (IV, Fixed, 95% CI) | 0.0 [0.0, 0.0] | |
| 5 Number of participants who achieved normalised alkaline phosphatase level Show forest plot | 4 | Risk Ratio (M‐H, Random, 95% CI) | Totals not selected | |
| 5.1 Olpadronate (1) vs. pamidronate (2) | 1 | Risk Ratio (M‐H, Random, 95% CI) | 0.0 [0.0, 0.0] | |
| 5.2 Zoledronate (1) vs. pamidronate (2) | 1 | Risk Ratio (M‐H, Random, 95% CI) | 0.0 [0.0, 0.0] | |
| 5.3 Zolendronate (1) vs. risedronate (2) | 1 | Risk Ratio (M‐H, Random, 95% CI) | 0.0 [0.0, 0.0] | |
| 5.4 Alendronate (1) vs. pamidronate (2) | 1 | Risk Ratio (M‐H, Random, 95% CI) | 0.0 [0.0, 0.0] | |
| 6 Number of participants who experienced biochemical relapse with increased alkaline phosphatase level Show forest plot | 2 | Risk Ratio (M‐H, Random, 95% CI) | Totals not selected | |
| 6.1 Zoledronate (1) vs. pamidronate (2) | 1 | Risk Ratio (M‐H, Random, 95% CI) | 0.0 [0.0, 0.0] | |
| 6.2 Zoledronate (1) vs. risedronate (2) | 0 | Risk Ratio (M‐H, Random, 95% CI) | 0.0 [0.0, 0.0] | |
| 6.3 Alendronate (1) vs. pamidronate (2) | 1 | Risk Ratio (M‐H, Random, 95% CI) | 0.0 [0.0, 0.0] | |