Bisphosphonates for Paget's disease of bone in adults
Information
- DOI:
- https://doi.org/10.1002/14651858.CD004956.pub3Copy DOI

- Database:
-
- Cochrane Database of Systematic Reviews
- Version published:
-
- 01 December 2017see what's new
- Type:
-
- Intervention
- Stage:
-
- Review
- Cochrane Editorial Group:
-
Cochrane Musculoskeletal Group
- Copyright:
-
- Copyright © 2017 The Cochrane Collaboration. Published by John Wiley & Sons, Ltd.
Article metrics
Altmetric:
Cited by:
Authors
Contributions of authors
Draft the protocol: LCG, SHR
Study selection: LCG, AT, JdPM
Extract data from studies: LCG, AT, JdPM
Enter data into Review Manager 2014: LCG
Carry out the analysis: LCG
Interpret the analysis: LCG, AT, SHR, JdPM
Draft the final review: LCG, AT, SHR, JdPM
Disagreement resolution: SHR
Update the review: LCG, AT, SHR, JdPM
Sources of support
Internal sources
-
No sources of support supplied
External sources
-
Arthritis Research, UK.
The review was supported in part by a grant from Arthritis Research UK to SHR (18304)
-
Instituto de Salud Carlos III, Spain.
The review was supported in part by a grant from Carlos III
Declarations of interest
Luis Corral‐Gudino: none known.
Adrian JH Tan: was co‐investigator on the PRISM‐EZ study (Tan 2017).
Javier del Pino‐Montes: was co‐investigator on zoledronate versus risedronate trial (Reid 2005). He has received grants from the research Spanish agencies SACYL and Institute of Health Carlos III and payment for lectures and meeting expenses from Merck Sharp Dohme.
Stuart H Ralston: previously acted as a consultant for Novartis and Merck on behalf of his institution (the University of Edinburgh) and was the principal investigator on three included primary studies (Langston 2010; Ralston 1987; Tan 2017).
Acknowledgements
We wish to acknowledge the hard work that went into the protocol by AL Langston, MK Campbell and C Roberston (Langston 2004).
Version history
| Published | Title | Stage | Authors | Version |
| 2017 Dec 01 | Bisphosphonates for Paget's disease of bone in adults | Review | Luis Corral‐Gudino, Adrian JH Tan, Javier del Pino‐Montes, Stuart H Ralston | |
| 2014 Oct 10 | Bisphosphonates for Paget's disease of bone in adults | Protocol | Luis Corral‐Gudino, Adrian JH Tan, Stuart Ralston | |
| 2004 Oct 18 | Aminobisphosphonates versus other active treatment for Paget's disease of the bone in adults | Protocol | Anne L Langston, Marion K Campbell, Stuart Ralston, Clare Robertson | |
Differences between protocol and review
There are nine differences between protocol and review:
-
The objective in the original protocol: "To assess the benefits to improve clinical outcomes or prevent complications and the harms of bisphosphonate therapy on patients with Paget's disease of bone in adults", was rewritten as "To assess the benefits and harms of bisphosphonates for adult patients with Paget's disease of bone" according to Cochrane Musculoskeletal Group recommendation.
-
Comparison between bisphosphonates was subdivided. In addition, two comparisons were added: comparison of two non‐aminobisphosphonates and bisphosphonates versus bisphosphonates plus calcitonin.
-
A minor outcome (mean reduction in serum total alkaline phosphatase activity) was renamed: mean percentage change from baseline in serum total alkaline phosphatase activity. A sub outcome: number of participants who achieved normalised alkaline phosphatase level, was added.
-
For trials where there were multiple arms with several doses of the same bisphosphonates, we combined the experimental intervention groups to create a single pair‐wise comparison versus the control group. Experimental group data were combined as a single group, instead of the planned high dose and low dose groups.
-
We estimated overall effect by performing meta‐analyses using a random‐effect model in all cases. The fixed‐effect model was not performed when I² < 40% as planned.
-
Some data were extracted directly from figures. (See last paragraph in Data extraction and management).
-
We added a specific search for specific rare events found from searches of websites of four regulatory agencies.
-
We added a new co‐author in March 2017. JdPM was recruited to assess results from the most recent search and analyse the PRISM‐EZ trial (Tan 2017).
-
We considered one year of follow‐up to properly assess the outcome "Number of participants experiencing radiologically‐confirmed clinical fractures" that does not have a predefined follow‐up period in the protocol.
Keywords
MeSH
Medical Subject Headings (MeSH) Keywords
- Alkaline Phosphatase [blood];
- Bone Density Conservation Agents [adverse effects, *therapeutic use];
- Calcitonin [therapeutic use];
- Diphosphonates [adverse effects, *therapeutic use];
- Musculoskeletal Pain [drug therapy];
- Osteitis Deformans [*drug therapy, enzymology];
- Patient Dropouts [statistics & numerical data];
- Randomized Controlled Trials as Topic;
Medical Subject Headings Check Words
Aged; Female; Humans; Male;
PICOs
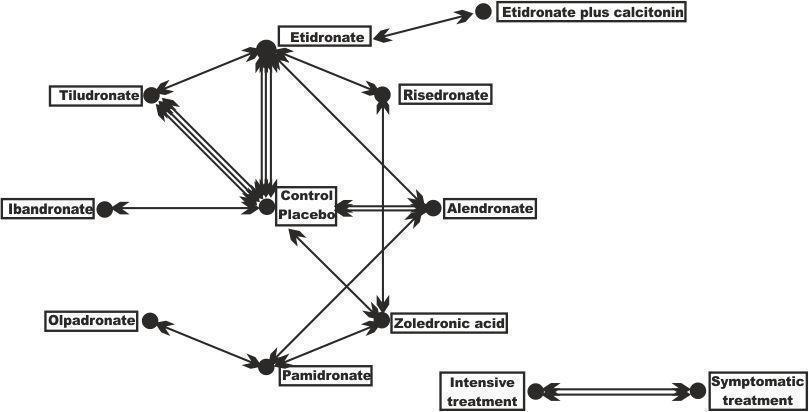
Geometry of the network of randomised trials of bisphosphonates for Paget's disease of bone. The nodes of the network represent the treatments compared. The links reflect comparisons and the number of links is proportional to the number of comparisons
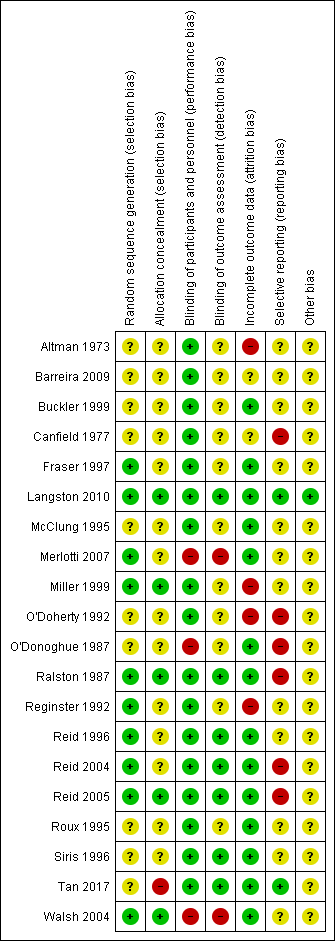
Risk of bias summary: review authors' judgements about each risk of bias item for each included study
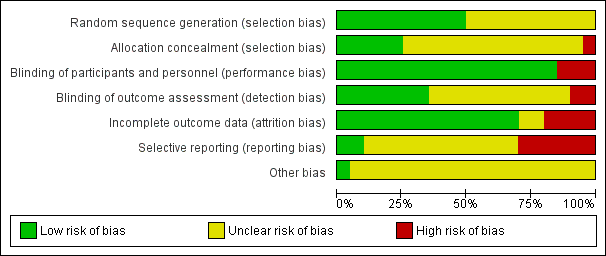
Risk of bias graph: review authors' judgements about each risk of bias item presented as percentages across all included studies
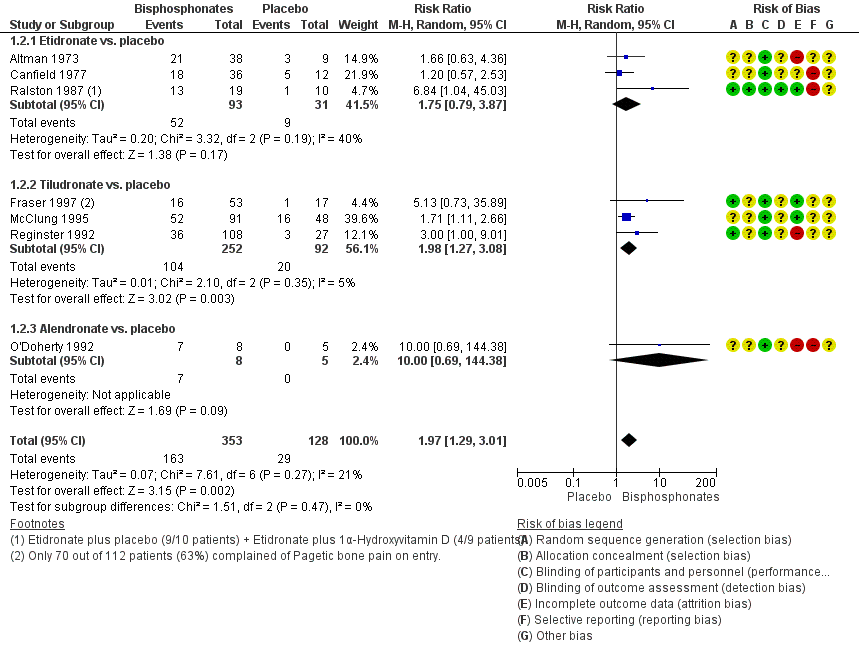
Forest plot of comparison: 1 Bisphosphonates versus placebo, outcome: 1.2 Number of participants with change in bone pain
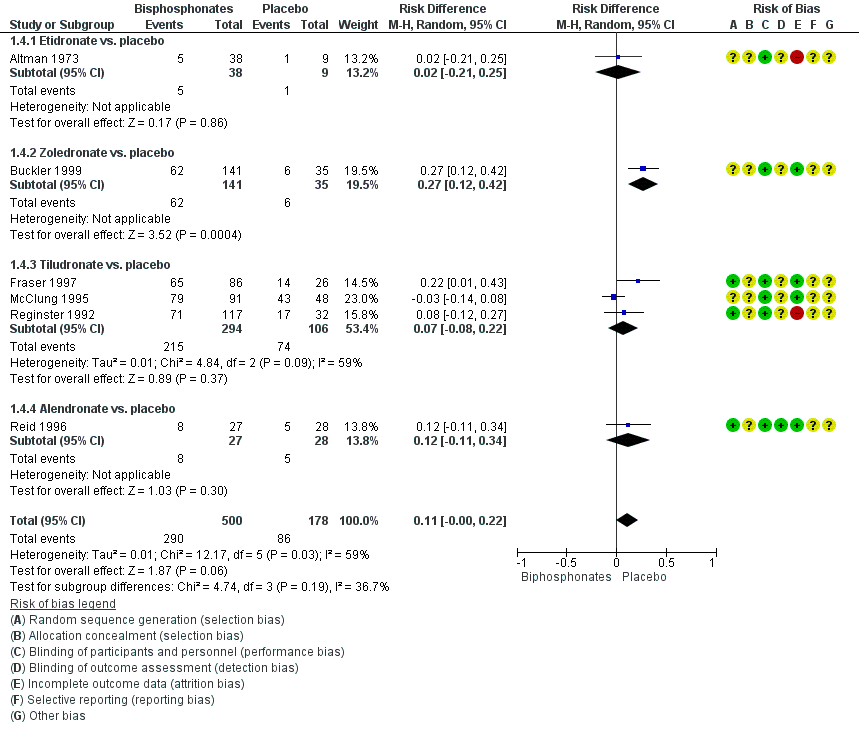
Forest plot of comparison: 1 Bisphosphonates versus placebo, outcome: 1.4 Number of participants who experienced adverse events related to use of bisphosphonates

Comparison 1 Bisphosphonates versus placebo, Outcome 1 Number of participants whose bone pain disappeared completely.

Comparison 1 Bisphosphonates versus placebo, Outcome 2 Number of participants with change in bone pain.

Comparison 1 Bisphosphonates versus placebo, Outcome 3 Number of participants experiencing radiologically‐confirmed clinical fractures.

Comparison 1 Bisphosphonates versus placebo, Outcome 4 Number of participants who experienced adverse events related to use of bisphosphonates.

Comparison 1 Bisphosphonates versus placebo, Outcome 5 Number of participants who withdrew due to adverse events.

Comparison 1 Bisphosphonates versus placebo, Outcome 6 Mean percentage change from baseline in serum total alkaline phosphatase level.

Comparison 1 Bisphosphonates versus placebo, Outcome 7 Number of participants who achieved normalised alkaline phosphatase level.

Comparison 2 Aminobisphosphonates versus non‐aminobisphosphonates, Outcome 1 Mean change from baseline in pain.

Comparison 2 Aminobisphosphonates versus non‐aminobisphosphonates, Outcome 2 Number of participants who experienced adverse events related to use of bisphosphonates.

Comparison 2 Aminobisphosphonates versus non‐aminobisphosphonates, Outcome 3 Number of participants who withdrew due to adverse events.

Comparison 2 Aminobisphosphonates versus non‐aminobisphosphonates, Outcome 4 Mean percentage change from baseline in serum total alkaline phosphatase level.

Comparison 2 Aminobisphosphonates versus non‐aminobisphosphonates, Outcome 5 Number of participants who achieved normalised alkaline phosphatase level.

Comparison 3 Comparison of two aminobisphosphonates, Outcome 1 Number of participants with bone pain change.

Comparison 3 Comparison of two aminobisphosphonates, Outcome 2 Number of participants who experienced adverse events related to use of bisphosphonates.

Comparison 3 Comparison of two aminobisphosphonates, Outcome 3 Number of participants who withdrew due to adverse events.

Comparison 3 Comparison of two aminobisphosphonates, Outcome 4 Mean percentage change from baseline in serum total alkaline phosphatase level.

Comparison 3 Comparison of two aminobisphosphonates, Outcome 5 Number of participants who achieved normalised alkaline phosphatase level.

Comparison 3 Comparison of two aminobisphosphonates, Outcome 6 Number of participants who experienced biochemical relapse with increased alkaline phosphatase level.
| Bisphosphonates versus placebo for Paget's disease of bone | ||||||
| Patient or population: Paget's disease of bone Comparison: Placebo | ||||||
| Outcomes | Anticipated absolute effects* (95% CI) | Relative effect | № of participants | Quality of the evidence | Comments | |
| Risk with placebo | Risk with bisphosphonates | |||||
| Number of participants with change in bone pain (disappearance of pain)¹ | Study population | RR 3.42 | 205 | ⊕⊕⊕⊝ | NNTB 5 (1 to 35) Absolute risk difference: 23% more (12% to 34%) Relative percent change: 242 % (31% to 790%) (Improvement) | |
| 91 per 1000 | 311 per 1000 | |||||
| Number of participants who experienced radiologically‐confirmed fractures | Low (study population)³ | RR 0.89 | 356 | ⊕⊝⊝⊝ | Absolute risk difference: 1% more (‐2% to 5%) Relative percentage change: 11% (‐82% to 331%) (improvement) Effect is uncertain due to very low quality evidence | |
| 0 per 1000 | 0 per 1000 | |||||
| Moderate³ | ||||||
| 9 per 1000 | 8 per 1000 (2 to 39) | |||||
| High³ | ||||||
| 52 per 1000 | 46 per 1000 (9 to 224) | |||||
| Number of participants who needed orthopaedic surgery (not measured) | See comments | See comments | Not estimable | 0 (0 RCTs) | See comments | Outcome not reported in the included studies |
| Number of participants with change in quality of life measures (not measured) | See comments | See comments | Not estimable | 0 (0 RCTs) | See comments | Outcome not reported in the included studies |
| Number of participants with change in hearing thresholds (not measured) | See comments | See comments | Not estimable | 0 (0 RCTs) | See comments | Outcome not reported in the included studies |
| Number of participants who experienced side effects related to use of bisphosphonates | Study population | RR 1.32 | 678 | ⊕⊕⊝⊝ | Absolute risk difference: 11% more (0% to 22%) Relative percent change: 32 % (‐10% to 92%) (worsening) Gastrointestinal side effects (diarrhoea, dyspepsia, vomiting, nausea, oesophagitis or gastritis) were the most common | |
| 483 per 1000 | 638 per 1000 | |||||
| Number of participants who withdrew due to adverse events | Study population | RR 1.01 | 517 | ⊕⊕⊝⊝ | Absolute risk difference: 0% (‐4% to 3%) Relative percent change: 1% (‐59% to 152%) (worsening) | |
| 41 per 1000 | 41 per 1000 | |||||
| *The risk in the intervention group (and its 95% CI) is based on the assumed risk in the comparison group and the relative effect of the intervention (and its 95% CI). | ||||||
| GRADE Working Group grades of evidence | ||||||
| ¹ When pain was assessed as any pain reduction instead of disappearance of pain, the outcomes were consistent: 227 per 1000 in placebo vs. 446 per 1000 (292 to 682) in bisphosphonates group (RR 1.97, 95% CI 1.29 to 3.01), NNTD 4 (2 to 13), absolute risk difference 33% more (18% to 49%), relative percentage change 97% (29% to 201% improvement), based on results from seven RCTs (481 participants). Visual analogue scale ranging from 0 to 10 was used in four of the seven studies. One study classified pain in three groups; the tool used for pain assessment was not detailed in the other two studies. Moderate quality evidence: downgraded by one level; there was high risk for attrition bias in three studies and high risk for reporting bias in three studies. The outcome did not change in a sensitive analysis excluding high risk of bias studies. ² Downgraded by one level (imprecision). Few events, resulting in wide CI. ³ The 0% calculated assumed risk in the control group (no fractures in placebo group) is misleading. This outcome is likely due to the short follow‐up period of the studies. To give a more accurate data we have added two scenarios of moderate and high prevalence using data from a study with a longest follow‐up period, the PRISM‐EZ trial (Tan 2017). In summary there are three scenarios to calculate the assumed risk in the control group: 1) To calculate low prevalence we used data from the included studies (placebo groups). 2) To calculate moderate prevalence we used the percentage of fractures in bones affected by Paget's disease of bone in the symptomatic treatment arm of the PRISM‐EZ trial. 3) To calculate high prevalence we used the percentage of fractures in both affected and unaffected bones in the symptomatic treatment arm of the PRISM‐EZ trial. ⁴ Downgraded by two levels (limitation of studies). Most data were from studies assessed at high risk of bias; there was high risk for attrition bias in two studies and high risk for reporting bias in one study. ⁵ Downgraded by one level (indirectness). Long‐term impact on fractures was not assessed. ⁶ Downgraded by one level (limitation of studies). High risk for attrition bias in two studies. ⁷ Downgraded by one level (inconsistency). The side effects considered in the studies were heterogeneous. In addition, considerable heterogeneity was found when the six studies were meta‐analysed (I² = 75%, P = 0.001). However, only one study (McClung 1995) showed more adverse events in the placebo group than the bisphosphonates group. The heterogeneity could not be explained by differences in design of this study since it was similar to other studies. A sensitivity analysis excluding this study found low heterogeneity I² = 6% (RR 1.38, 95% CI 1.08 to 1.78). ⁸ Downgraded by two levels. Half of the included studies were assessed at high risk of bias; there was high risk for attrition bias in three studies and high risk for reporting bias in one study. ⁹ Rated down for imprecision. Optimal information size criterion was not met. The 95% CI is too wide. | ||||||
| Zoledronate versus pamidronate or risedronate for Paget's disease of bone | ||||||
| Patient or population: Paget's disease of bone | ||||||
| Outcomes | Anticipated absolute effects* (95% CI) | Relative effect | № of participants | Quality of the evidence | Comments | |
| Risk with pamidronate or risedronate | Risk with zoledronate | |||||
| Number of participants with change in bone pain¹ | Study population | RR 1.31 | 436 | ⊕⊝⊝⊝ | NNTB: 7 (4 to 14) Absolute risk difference: 17% (8% to 26%) Relative percent change: 31% (15% to 51%) (improvement) Not pooled effects: Zoledronate vs. pamidronate (89 participants); RR 1.30 (1.10 to 1.53), NNTB 4 (3 to 13). Zoledronate vs. risedronate (347 participants); RR 1.36 (1.06 to 1.74), NNTB 8 (4 to 45). | |
| 465 per 1000 | 609 per 1000 | |||||
| Number of participants who experienced fractures (not measured) | See comments | See comments | Not estimable | 0 (0 RCTs) | See comments | Outcome not reported in the included studies |
| Number of participants who needed orthopaedic surgery (not measured) | See comments | See comments | Not estimable | 0 (0 RCTs) | See comments | Outcome not reported in the included studies |
| Number of participants with change in quality of life measures (not measured) | See comments | See comments | Not estimable | 0 (0 RCTs) | See comments | Effect is uncertain. Zoledronate showed a marginal improvement at 6 months in QoL when compared with risedronate. The physical component summary score of SF‐36 improved with zoledronate compared to risedronate (1.6 vs. 0.3 change from baseline score, on a 0 to 100 scale). This result is unlikely to be of clinical importance |
| Number of participants with change in hearing thresholds (not measured) | See comments | See comments | Not estimable | 0 (0 RCTs) | See comments | Outcome not reported in the included studies |
| Number of participants who experienced side effects related to use of bisphosphonates. | Study population | RR 1.05 | 437 | ⊕⊕⊝⊝ | Absolute risk difference: 4% (‐4% to 12%) Relative percent change: 5% (‐5% to 16%) (worsening) | |
| 745 per 1000 | 782 per 1000 | |||||
| Number of participants who withdrew due to adverse events (withdrawals) | Study population | RR 2.04 | 437 | ⊕⊝⊝⊝ | Absolute risk difference: 1% (‐2% to 3%) Relative percent change: 104% (‐57% to 859%) (worsening) | |
| 9 per 1000 | 18 per 1000 | |||||
| *The risk in the intervention group (and its 95% CI) is based on the assumed risk in the comparison group and the relative effect of the intervention (and its 95% CI). | ||||||
| GRADE Working Group grades of evidence | ||||||
| ¹Unlike summary of findings Table for the main comparison (comparing bisphosphonates vs. placebo) when compared zoledronate vs pamidronate or risedronate we used any change of pain instead of disappearance of pain because data were not available. However, readers could find data on disappearance of pain in the original zoledronate vs. pamidronate manuscript (Merlotti 2007) [10/47 vs. 6/60, RR 2.12 95% IC 0.83‐5.43]. We did not include these data because we think they are misleading. They come from accumulate zoledronate effects in two different study phases (30 zoledronate patients from phase 1 + 17 patients no responders to pamidronate in phase 1 treated with zoledronate in phase 2) vs. pamidronate in only one study phase (60 patients). ² Downgraded by two levels (limitation of studies). Information is from studies at high risk of bias. High risk for performance bias in 1 study and high risk for reporting bias in 1 study. ³ Downgraded by one level (indirectness). In the risedronate study, the author assessed bodily pain but not bone pain associated directly with Paget's bone lesions (Change in bone pain was defined as"5‐point improvement from baseline" in SF‐36 bodily pain item). In the pamidronate study change in bone pain was defined as "subjects reported disappearance or decrease in pain". ⁴Downgraded by one level (imprecision). There were few events, resulting in wide CI, | ||||||
| Study ID | Intervention | Comparator | Alkaline phosphatase | Follow‐up | N | Age | Male | Symptomatic | Previously treated |
| Etidronate | Placebo | Yes | 6 m | 50 | 67 y | 60% | NA | NA | |
| Etidronate | Placebo | Yes | 6 m | 48 | NA | 58% | NA | NA | |
| Etidronate | Placebo | No | 3 m | 32 | NA | NA | 100% | 38% | |
| Tiludronate | Placebo | Yes | 6 m | 112 | 70 y | 54% | 63% | NA | |
| Tiludronate | Placebo | Yes | 6 m | 139 | 70 y | 54% | NA | NA | |
| Tiludronate | Placebo | Yes | 6 m | 149 | 69 y | 54% | NA | 82% | |
| Alendronate | Placebo | Yes | 6 m | 15 | 67 y | 60% | 87% | 66% | |
| Alendronate | Placebo | Yes | 6 m | 55 | 70 y | 56% | NA | 35% | |
| Zoledronate | Placebo | Yes | 3 m | 176 | 71 y | 61% | NA | NA | |
| Ibandronate | Placebo | Yes | 6 m | 25 | 73 y | 74% | NA | 64% | |
| Tiludronate | Etidronate | Yes | 6m | 234 | 69y | 59% | 74% | 71% | |
| Alendronate | Etidronate | Yes | 6m | 89 | 69y | 67% | NA | 25% | |
| Risedronate | Etidronate | Yes | 12 m | 123 | 66 y | 69% | 91% | 72% | |
| Alendronate | Pamidronate | Yes | 12 m | 72 | 70 y | 58% | 94% | 39% | |
| Olpadronate | Pamidronate | Yes | 6 m | 27 | NA | NA | NA | NA | |
| Zoledronate | Pamidronate | Yes | 6 m | 90 | 70 y | 69% | 99% | 67% | |
| Zoledronate | Risedronate | Yes | 6 m | 357 | 70 y | 68% | NA | 54% | |
| Etidronate + calcitonin | Etidronate | Yes | 12 m | 44 | NA | NA | 100% | 10% | |
| Intensive | Symptomatic | No | 3 y | 1331 | 74 y | 51% | 69% | NA | |
| Intensive | Symptomatic | No | 3 y | 502 | 76 y | 55% | 63% | 70% | |
| Alkaline phosphatase: Serum total alkaline phosphatase above the upper limit of normal as an inclusion criterion. Follow‐up: Extended follow‐up periods are shown in parentheses. N: Number of randomised participants. NA: Not available. SC: Sample size calculated before study. | |||||||||
| Study ID | Outcome | Zoledronate | Risedronate | RR (95% IC) | ||
| Events | N | Events | N | |||
| Radiologically‐confirmed clinical fracture | 2 | 177 | 2 | 172 | 0.97 (0.14 to 6.82) | |
| Reid 2011 (extension) | Radiologically‐confirmed clinical fracture | 3 | 152 | 1 | 115 | 2.30 (0.24 to 22.36) |
| Quality of life change from baseline | 48 | 176 | 36 | 171 | 1.30 (0.89 to 1.89) | |
| Reid 2011 (extension) | Clinical relapse | 14 | 152 | 29 | 115 | 0.30 (0.15 to 0.60) |
| Study ID | Outcome | Mean (SD) | N | Mean (SD) | N | Mean difference |
| Mean change from baseline in pain | ‐0.5 (1.75) | 101 | ‐0.4 (2.13) | 92 | ‐0.10 (‐0.65 to 0.45) | |
| Mean change from baseline in quality of life¹ | 1.5 (0.5) | 176 | 0.2 (0.6) | 171 | 1.30 (1.18 to 1.42) | |
| Reid 2011 (extension) | Mean change from baseline in total SF‐36 score² | 1.3 (3.1) | 152 | ‐2.5 (2.6) | 115 | 3.8 (3.12 to 4.49) |
| ¹Physical‐component summary (data extracted from Figure 4 in Reid 2005). ²Total SF‐36 scores to 54 months (data extracted from Figure 6 in Reid 2011 extension) (+1.3 ± 3.1 versus ‐2.5 ± 2.6) [D] | ||||||
| Ouctome | Etidronate plus calcitonin | Etidronate | RR (95% IC) | ||
| Events | N | Events | N | ||
| Change in bone pain | 10 | 21 | 15 | 23 | 0.73 (0.43 to 1.25) |
| Study ID | Outcome | Intensive | Symptomatic | RR (95% IC) | ||
| Events | N | Events | N | |||
| Improvement in bone pain | 78 | 295 | 96 | 311 | 0.86 (0.67 to 1.10) | |
| Radiologically‐confirmed fractures | 46 | 661 | 49 | 663 | 0.94 (0.64 to 1.39) | |
| Radiologically‐confirmed fractures*¹ | 22 | 270 | 12 | 232 | 1.58 (0.80 to 3.11) | |
| Radiologically‐confirmed fractures (pagetic bone) | 8 | 661 | 13 | 663 | 0.62 (0.25 to 1.49) | |
| Radiologically‐confirmed fractures (pagetic bone)¹ | 5 | 270 | 2 | 232 | 2.15 (0.42 to 10.96) | |
| Number of orthopaedic surgeries | 48 | 661 | 55 | 663 | 0.88 (0.60 to 1.27) | |
| Number of orthopaedic surgeries¹ | 15 | 270 | 7 | 232 | 1.84 (0.76 to 4.44) | |
| Number of orthopaedic procedures | 50 | 661 | 63 | 663 | 0.78 (0.53 to 1.15) | |
| Number of orthopaedic procedures | 16 | 270 | 9 | 232 | 1.52 (0.69 to 3.39) | |
| Change in hearing thresholds² | 134 | 505 | 133 | 486 | 0.97 (0.79 to 1.19) | |
| Hearing classification worse at study end (left ear)³ | 6 | 50 | 8 | 63 | 0.95 (0.35 to 2.55) | |
| Hearing classification worse at study end (right ear)³ | 4 | 51 | 8 | 60 | 0.58 (0.19 to 1.84) | |
| Serious adverse events | 345 | 661 | 359 | 663 | 0.96 (0.87 to 1.07) | |
| Serious adverse events | 87 | 270 | 66 | 232 | 1.13 (0.87 to 1.48) | |
| Withdrawal due to adverse events⁴ | 83 | 661 | 79 | 663 | 1.05 (0.79 to 1.41) | |
| Normalised alkaline phosphatase levels | 512 | 661 | 406 | 663 | 1.26 (1.18 to 1.36) | |
| Study ID | Outcome | Mean (SD) | N | Mean (SD) | N | Mean difference |
| Mean change from baseline in quality of life (bodily pain SF‐36)⁵ | ‐0.4 (8.9) | 479 | 0.3 (9.4) | 477 | ‐0.7 (‐1.8 to 0.5) | |
| Mean change from baseline in quality of life (bodily pain SF‐36)⁶ | 0.1 (9.3) | 149 | ‐1.0 (9.1) | 138 | ‐1.0 (‐3.0 to 1.1) | |
| Mean change from baseline in quality of life (physical summary SF‐36)*⁵ | ‐1.2 (8.1) | 408 | ‐1.1 (8.2) | 396 | ‐0.1 (‐1.3 to 1.0) | |
| Mean change from baseline in quality of life (physical summary SF‐36)⁶ | ‐1.0 (7.7) | 144 | ‐2.7 (7.7) | 126 | ‐1.6 (‐3.4 to 0.3) | |
| Mean change from baseline in quality of life (mental summary SF‐36)*⁵ | ‐1.7 (10.2) | 408 | ‐2.6 (10.9) | 396 | 0.9 (‐0.6 to 2.3) | |
| Mean change from baseline in quality of life (mental summary SF‐36)⁶ | ‐1.0 (10.0) | 144 | ‐0.4 (9.9) | 126 | ‐0.6 (‐1.7 to 3.1) | |
| Mean hearing loss (left ear)³ | 1.8 (14.6) | 50 | 0.0 (12.6) | 63 | 1.8 (‐3.4 to 7.0) | |
| Mean hearing loss (right ear)³ | 2.5 (5.7) | 51 | 2.1 (9.4) | 60 | 0.5 (‐2.4 to 3.3) | |
| Mean percentage change from baseline in serum total alkaline phosphatase activity | ‐40.5 (23.7) | 430 | ‐18 (71.2) | 424 | ‐22.5 (‐29.6 to ‐15.4) | |
| Mean percentage change from baseline in adjusted serum total alkaline phosphatase activity | ‐0.15 (0.72) | 203 | ‐0.05 (0.75) | 181 | ‐0.11 (‐0.03 to 0.25) | |
| Data at 24 months for Langston 2010. ¹Data shown for these outcomes are number of events, patient years of follow up, rate ratios and 95% CI calculated using the method described by Cohen 2011. ²Number of participants using hearing aids at the end of the study. ³Patients with baseline and end of the trial measurements. ⁴Serious adverse event: any untoward medical occurrence that: 1) results in death, 2) is life‐threatening, 3) requires inpatient hospitalisation or prolongation of existing hospitalisation, 4) results in persistent or significant disability/incapacity, or 5) is a congenital anomaly/birth defect. ⁵Data at 24 months. ⁶Difference between baseline and 36 months. | ||||||
| Outcome | Tiludronate | Etidronate | RR (95% IC) | ||
| Events | N | Events | N | ||
| Number of participants with change in bone pain | 32 | 120 | 10 | 52 | 1.39 (0.74 to 2.61) |
| Number of participants with radiologically‐confirmed fractures | 1 | 155 | 2 | 79 | 0.25 (0.02 to 2.77) |
| Number of participants with severe side effects | 75 | 155 | 27 | 79 | 1.42 (1.00 to 2.00) |
| Number of participants who withdrew due to adverse events | 10 | 155 | 2 | 79 | 2.55 (0.57 to 11.35) |
| Number of participants who normalised alkaline phosphatase levels | 40 | 155 | 9 | 79 | 2.27 (1.16 to 4.43) |
| Study ID | Comparison | Side effect | Bisphosphonate | Placebo | RR (95% CI) |
| Etidronate (38) vs. placebo (9) | Diarrhoea | 5 (13%) | 1 (11%) | 1.18 (0.16 to 8.93) | |
| Zoledronate (141) vs. placebo (35) | Fatigue Fever Arthralgia Pain, back Pain, skeletal Hypocalcaemia | 12 (9%) 7 (5%) 15 (11%) 14 (10%) 11 (8%) 3 (2%) | 0 (0%) 0 (0%) 3 (9%) 1 (3%) 2 (6%) 0 (0%) | 6.34 (0.38 to 104.5) 3.80 (0.50 to 28.88) 1.24 (0.89 to 1.77) 3.47 (0.53 to 23.02) 1.37 (0.85 to 2.19) 1.78 (0.74 to 4.24) | |
| Tiludronate (86) vs. placebo (26) | Nausea Vomiting Dyspepsia Diarrhoea Arthralgia Skeletal pain Raised liver enzymes Eosinophilia | 15 (17%) 7 (7%) 9 (10%) 14 (16%) 8 (9%) 5 (6%) 1 (1%) 0 (0%) | 2 (8%) 0 (0%) 0 (0%) 0 (0%) 2 (8%) 3 (12%) 0 (0%) 1 (4%) | 2.27 (0.65 to 7.86) 4.66 (0.45 to 48.06) 5.90 (0.40 to 87.16) 9.00 (0.32 to 252.8) 1.21 (0.91 to 1.61) 0.50 (0.13 to 1.97) 0.93 (0.04 to 22.20) 0.10 (0.01 to 2.47) | |
| Tiludronate (91) vs. placebo (48) | Gastrointestinal | 31 (34%) | 15 (31%) | 1.09 (0.66 to 1.81) | |
| Tiludronate (117) vs. placebo (32) | Gastralgia Nausea | 20 (17.1%) 11 (9.4%) | 5 (16.1%) 3 (9.6%) | 1.09 (0.45 to 2.69) 1.00 (0.30 to 3.38) | |
| Alendronate (27) vs. placebo (28) | Gastrointestinal Gastritis Duodenal ulcer Oesophagitis | 2 (7%) 0 (0%) 0 (0%) 1 (4%) | 5 (18%) 1 (4%) 1 (4%) 0 (0%) | 0.42 (0.09 to 2.00) 0.35 (0.02 to 8.13) 0.35 (0.02 to 8.13) 3.10 (0.13 to 73.10) |
| Study ID | Comparison | Adverse effect | Bisphosphonate 1 | Bisphosphonate 2 | RR (95% CI) |
| Tiludronate (155) vs. etidronate (79) | Gastrointestinal | 32 (20.8%) | 10 (12.7%) | 1.63 (0.85 to 3.14) | |
| Abdominal pain | 10 (6.5%) | 2 (2.5%) | 2.55 (0.57 to 11.35) | ||
| Nausea, vomiting | 8 (5.2%) | 2 (2.5%) | 2.04 (0.44 to 9.37) | ||
| Fracture | 1 (1%) | 2 (3%) | 0.25 (0.02 to 2.77) | ||
| Alendronate (42) vs. etidronate (47) | Gastrointestinal | 11 (26%) | 10 (21%) | 1.23 (0.58 to 2.60) | |
| Abdominal distention | 0 (%) | 1 (2%) | 0.37 (0.02 to 8.90) | ||
| Abdominal pain | 3 (7%) | 4 (9%) | 0.84 (0.2 to 3.54) | ||
| Acid regurgitation | 1 (2%) | 1 (2%) | 1.12 (0.07 to 17.34) | ||
| Dyspepsia | 0 (0%) | 1 (2%) | 0.37 (0.02 to 8.90) | ||
| Melena | 1 (2%) | 0 (0%) | 3.35 (0.14 to 80.05) | ||
| Nausea | 2 (5%) | 3 (6%) | 0.75 (0.13 to 4.25) | ||
| Leg pain | 1 (2%) | 9 (19%) | 0.12 (0.02 to 0.94) | ||
| Laboratory adverse experiences | 9 (21%) | 6 (13%) | 1.68 (0.65 to 4.32) | ||
| Risedronate (62) vs. etidronate (61) | Upper gastrointestinal | 12 (19%) | 12 (20%) | 0.98 (0.48 to 2.02) | |
| Olpadronate (14) vs. pamidronate (7) | Digestive | 9 (64%) | 7 (100%) | 0.68 (0.44 to 1.03) | |
| Zoledronate (47)* vs. pamidronate (60) | Influenza‐like illness | 4 (9%) | 5 (8%) | 1.02 (0.29 to 3.59) | |
| Myalgia | 3 (6%) | 4 (7%) | 0.96 (0.23 to 4.07) | ||
| Pyrexia | 3 (6%) | 4 (7%) | 0.96 (0.23 to 4.07) | ||
| Fatigue | 3 (6%) | 8 (13%) | 0.48 (0.13 to 1.71) | ||
| Headache | 4 (9%) | 5 (8%) | 1.02 (0.29 to 3.59) | ||
| Diarrhoea | 1 (2%) | 2 (3%) | 0.64 (0.06 to 6.83) | ||
| Bone pain | 3 (6%) | 6 (10%) | 0.64 (0.17 to 2.42) | ||
| Pain in arm or leg | 3 (6%) | 4 (7%) | 0.96 (0.23 to 4.07) | ||
| Hypocalcaemia | 3 (6%) | 1 (2%) | 3.83 (0.41 to 35.64) | ||
| Dermatitis | 1 (2%) | 0 (0%) | 0.42 (0.02 to 10.17) | ||
| Zoledronate (177) vs. risedronate (172) | Study days 1 to 3 | ||||
| Influenza‐like illness | 17 (9.6%) | 7 (4.1%) | 2.36 (1 to 5.55) | ||
| Myalgia | 13 (7.3%) | 6 (3.5%) | 2.11 (0.82 to 5.41) | ||
| Pyrexia | 13 (7.3%) | 1 (0.6%) | 12.63 (1.67 to 95.53) | ||
| Fatigue | 12 (6.8%) | 4 (2.3%) | 2.92 (0.96 to 8.86) | ||
| Headache | 12 (6.8%) | 7 (4.1%) | 1.67 (0.67 to 4.13) | ||
| Rigor | 12 (6.8%) | 1 (0.6%) | 11.66 (1.53 to 88.72) | ||
| Nausea | 11 (6.2%) | 3 (1.7%) | 3.56 (1.01 to 12.55) | ||
| Bone pain | 9 (5.1%) | 2 (1.2%) | 4.37 (0.96 to 19.95) | ||
| After study day 3 | |||||
| Pain in an arm or leg | 13 (7.3%) | 12 (7%) | 1.05 (0.49 to 2.24) | ||
| Arthralgia | 9 (5.1%) | 19 (11%) | 0.46 (0.21 to 0.99) | ||
| Dizziness | 9 (5.1%) | 5 (2.9%) | 1.75 (0.6 to 5.11) | ||
| Nasopharyngitis | 9 (5.1%) | 14 (8.1%) | 0.62 (0.28 to 1.41) | ||
| Diarrhoea | 8 (4.5%) | 9 (5.2%) | 0.86 (0.34 to 2.19) | ||
| Headache | 7 (4%) | 10 (5.8%) | 0.68 (0.26 to 1.75) | ||
| Back pain | 4 (2.3%) | 12 (7.0%) | 0.32 (0.11 to 0.98) | ||
| Symptomatic hypocalcaemia | 2 (1.1%) | 1 (0.6%) | 1.94 (0.18 to 21.24) | ||
| Reid 2011 (extension) | Zoledronate (152) vs. risedronate (115) | Atrial fibrillation | 1 (0.7%) | 1 (0.9%) | 0.76 (0.05 to 12.20) |
| Atrial flutter | 0 (0%) | 2 (1.7%) | 0.15 (0.01 to 3.13) | ||
| Osteonecrosis jaw | 0 (0%) | 0 (0%) | ‐ | ||
| Alendronate (36) vs. pamidronate (36) | Gastrointestinal | 16 (44%) | 4 (11%) | 4 (1.48 to 10.80) | |
| Fatigue | 0 (0%) | 23 (64%) | 0.02 (0.00 to 0.34) | ||
| General aches/pain | 4 (11%) | 16 (44%) | 0.25 (0.09 to 0.68) | ||
| Deteriorating kidney failure | 1 (3%) | 0 (0%) | 3.00 (0.12 to 71.28) | ||
| *Zoledronate group data were extracted from Table 3 in Merlotti 2007. In this table, the authors presented data from 30 participants who took part in the first part of the study (which was included in our systematic review) plus 17 participants from the second part of the study (which was not included in our systematic review). | |||||
| Study ID | Comparison | Side effect | Intensive | Symptomatic | RR (95% CI) |
| Intensive (661) vs. symptomatic (663) | All adverse events Serious adverse events Musculoskeletal Sensory Gastrointestinal Cardiovascular Arrythmia Cancer Renal Other | 3429 345 691 203 172 360 13 (1.9%) 55 98 1850 | 3471 359 734 196 157 327 7 (1%) 47 78 1932 | ‐ ‐ ‐ ‐ ‐ ‐ 1.86 (0.75 to 4.64) ‐ ‐ ‐ | |
| Intensive (270) vs. symptomatic (232) | All adverse events Serious adverse events Musculoskeletal Osteonecrosis of the jaw Delayed union of fracture Ophthalmic Uveitis Gastrointestinal Cardiovascular Arrythmia Cerebrovascular Central nervous system Endocrine Ear, nose or throat Genitourinary Haematological Respiratory Skin Miscellaneous | 226 87 123 1 2 34 1 54 67 14 4 28 28 28 41 10 48 41 33 | 196 66 104 0 1 41 0 46 49 8 3 28 21 26 39 9 43 33 32 | 0.99 (0.91 to 1.07) 1.13 (0.87 to 1.48) 1.02 (0.84 to 1.23) 2.58 (0.11 to 63.01) 1.72 (0.16 to 18.83) 0.71 (0.47 to 1.08) 2.58 (0.11 to 63.01) 1.01 (0.71 to 1.43) 1.18 (0.85 to 1.62) 1.50 (0.64 to 3.52) 1.14 (0.26 to 5.07) 0.86 (0.52 to 1.41) 1.15 (0.68 to 1.96) 0.93 (0.56 to 1.53) 0.90 (0.61 to 1.35) 0.96 (0.40 to 2.31) 0.95 (0.66 to 1.39) 1.07 (0.70 to 1.63) 0.89 (0.56 to 1.40) | |
| * Data represent total numbers of reported side effects regardless of numbers of participants who experienced them. The authors reported numbers of participants only for arrhythmia. | |||||
| Study ID | Outcome | Tiludronate | Placebo | RR (95% IC) | ||
| Events | N | Events | N | |||
| Number of participants who relapsed due to bone pain recurrence | 23 | 66 | 13 | 19 | 0.51 (0.32 to 0.80) | |
| Study ID | Outcome | Risedronate | Tiludronate | RR (95% IC) | ||
| Events | N | Events | N | |||
| Number of participants who relapsed due to recurrence of increased serum alkaline phosphatase level | 2 | 62 | 8 | 61 | 0.25 (0.05 to 1.11) | |
| Outcome or subgroup title | No. of studies | No. of participants | Statistical method | Effect size |
| 1 Number of participants whose bone pain disappeared completely Show forest plot | 2 | 205 | Risk Ratio (M‐H, Random, 95% CI) | 3.42 [1.31, 8.90] |
| 2 Number of participants with change in bone pain Show forest plot | 7 | 481 | Risk Ratio (M‐H, Random, 95% CI) | 1.97 [1.29, 3.01] |
| 2.1 Etidronate vs. placebo | 3 | 124 | Risk Ratio (M‐H, Random, 95% CI) | 1.75 [0.79, 3.87] |
| 2.2 Tiludronate vs. placebo | 3 | 344 | Risk Ratio (M‐H, Random, 95% CI) | 1.98 [1.27, 3.08] |
| 2.3 Alendronate vs. placebo | 1 | 13 | Risk Ratio (M‐H, Random, 95% CI) | 10.00 [0.69, 144.38] |
| 3 Number of participants experiencing radiologically‐confirmed clinical fractures Show forest plot | 4 | 356 | Odds Ratio (M‐H, Random, 95% CI) | 0.89 [0.18, 4.51] |
| 3.1 Etidronate vs. placebo | 2 | 95 | Odds Ratio (M‐H, Random, 95% CI) | 0.90 [0.09, 9.06] |
| 3.2 Tiludronate vs. placebo | 2 | 261 | Odds Ratio (M‐H, Random, 95% CI) | 0.88 [0.09, 8.64] |
| 4 Number of participants who experienced adverse events related to use of bisphosphonates Show forest plot | 6 | 678 | Risk Difference (M‐H, Random, 95% CI) | 0.11 [‐0.00, 0.22] |
| 4.1 Etidronate vs. placebo | 1 | 47 | Risk Difference (M‐H, Random, 95% CI) | 0.02 [‐0.21, 0.25] |
| 4.2 Zoledronate vs. placebo | 1 | 176 | Risk Difference (M‐H, Random, 95% CI) | 0.27 [0.12, 0.42] |
| 4.3 Tiludronate vs. placebo | 3 | 400 | Risk Difference (M‐H, Random, 95% CI) | 0.07 [‐0.08, 0.22] |
| 4.4 Alendronate vs. placebo | 1 | 55 | Risk Difference (M‐H, Random, 95% CI) | 0.12 [‐0.11, 0.34] |
| 5 Number of participants who withdrew due to adverse events Show forest plot | 6 | 517 | Odds Ratio (M‐H, Random, 95% CI) | 1.01 [0.38, 2.69] |
| 5.1 Etidronate vs. placebo | 1 | 47 | Odds Ratio (M‐H, Random, 95% CI) | 0.0 [0.0, 0.0] |
| 5.2 Tiludronate vs. placebo | 3 | 400 | Odds Ratio (M‐H, Random, 95% CI) | 0.96 [0.34, 2.67] |
| 5.3 Alendronate vs. placebo | 2 | 70 | Odds Ratio (M‐H, Random, 95% CI) | 1.74 [0.06, 50.43] |
| 6 Mean percentage change from baseline in serum total alkaline phosphatase level Show forest plot | 8 | 592 | Mean Difference (IV, Random, 95% CI) | ‐50.09 [‐67.72, ‐32.46] |
| 6.1 Etidronate vs. placebo | 3 | 122 | Mean Difference (IV, Random, 95% CI) | ‐55.85 [‐66.50, ‐45.20] |
| 6.2 Zoledronate vs. placebo | 1 | 176 | Mean Difference (IV, Random, 95% CI) | ‐22.26 [‐27.99, ‐16.53] |
| 6.3 Tiludronate vs. placebo | 2 | 256 | Mean Difference (IV, Random, 95% CI) | ‐58.0 [‐64.25, ‐51.75] |
| 6.4 Alendronate vs. placebo | 1 | 15 | Mean Difference (IV, Random, 95% CI) | ‐39.9 [‐51.28, ‐28.52] |
| 6.5 Ibandronate vs. placebo | 1 | 23 | Mean Difference (IV, Random, 95% CI) | ‐96.1 [‐147.01, ‐45.19] |
| 7 Number of participants who achieved normalised alkaline phosphatase level Show forest plot | 8 | 580 | Risk Ratio (M‐H, Random, 95% CI) | 9.96 [3.74, 26.58] |
| 7.1 Etidronate vs. placebo | 3 | 121 | Risk Ratio (M‐H, Random, 95% CI) | 4.51 [0.90, 22.55] |
| 7.2 Tiludronate vs. placebo | 3 | 381 | Risk Ratio (M‐H, Random, 95% CI) | 13.79 [2.77, 68.61] |
| 7.3 Alendronate vs. placebo | 1 | 55 | Risk Ratio (M‐H, Random, 95% CI) | 27.96 [1.74, 448.28] |
| 7.4 Ibandronate vs. placebo | 1 | 23 | Risk Ratio (M‐H, Random, 95% CI) | 14.00 [0.92, 212.92] |
| Outcome or subgroup title | No. of studies | No. of participants | Statistical method | Effect size |
| 1 Mean change from baseline in pain Show forest plot | 1 | Mean Difference (IV, Random, 95% CI) | Totals not selected | |
| 1.1 Risedronate vs. etidronate | 1 | Mean Difference (IV, Random, 95% CI) | 0.0 [0.0, 0.0] | |
| 2 Number of participants who experienced adverse events related to use of bisphosphonates Show forest plot | 2 | 212 | Risk Ratio (M‐H, Random, 95% CI) | 0.98 [0.72, 1.35] |
| 2.1 Risedronate vs. etidronate | 1 | 123 | Risk Ratio (M‐H, Random, 95% CI) | 0.98 [0.68, 1.43] |
| 2.2 Alendronate vs. etidronate | 1 | 89 | Risk Ratio (M‐H, Random, 95% CI) | 0.98 [0.55, 1.76] |
| 3 Number of participants who withdrew due to adverse events Show forest plot | 2 | 212 | Risk Ratio (M‐H, Random, 95% CI) | 0.69 [0.25, 1.89] |
| 3.1 Risedronate vs. etidronate | 1 | 123 | Risk Ratio (M‐H, Random, 95% CI) | 0.79 [0.22, 2.79] |
| 3.2 Alendronate vs. etidronate | 1 | 89 | Risk Ratio (M‐H, Random, 95% CI) | 0.56 [0.11, 2.90] |
| 4 Mean percentage change from baseline in serum total alkaline phosphatase level Show forest plot | 2 | 212 | Mean Difference (IV, Random, 95% CI) | ‐40.95 [‐49.09, ‐32.81] |
| 4.1 Risedronate vs. etidronate | 1 | 123 | Mean Difference (IV, Random, 95% CI) | ‐43.9 [‐48.06, ‐39.74] |
| 4.2 Alendronate vs. etidronate | 1 | 89 | Mean Difference (IV, Random, 95% CI) | ‐35.1 [‐45.85, ‐24.35] |
| 5 Number of participants who achieved normalised alkaline phosphatase level Show forest plot | 2 | 212 | Risk Ratio (M‐H, Random, 95% CI) | 4.30 [2.72, 6.79] |
| 5.1 Risedronate vs. etidronate | 1 | 123 | Risk Ratio (M‐H, Random, 95% CI) | 4.81 [2.58, 8.98] |
| 5.2 Alendronate vs. etidronate | 1 | 89 | Risk Ratio (M‐H, Random, 95% CI) | 3.78 [1.93, 7.38] |
| Outcome or subgroup title | No. of studies | No. of participants | Statistical method | Effect size |
| 1 Number of participants with bone pain change Show forest plot | 2 | 436 | Risk Ratio (M‐H, Random, 95% CI) | 1.31 [1.15, 1.51] |
| 1.1 Zoledronate (1) vs. pamidronate (2) | 1 | 89 | Risk Ratio (M‐H, Random, 95% CI) | 1.30 [1.10, 1.53] |
| 1.2 Zolendronate (1) vs. risedronate (2) | 1 | 347 | Risk Ratio (M‐H, Random, 95% CI) | 1.36 [1.06, 1.74] |
| 2 Number of participants who experienced adverse events related to use of bisphosphonates Show forest plot | 3 | Risk Difference (M‐H, Random, 95% CI) | Totals not selected | |
| 2.1 Olpadronate (1) vs. pamidronate (2) | 1 | Risk Difference (M‐H, Random, 95% CI) | 0.0 [0.0, 0.0] | |
| 2.2 Zoledronate (1) vs. pamidronate (2) | 1 | Risk Difference (M‐H, Random, 95% CI) | 0.0 [0.0, 0.0] | |
| 2.3 Zolendronate (1) vs. risedronate (2) | 1 | Risk Difference (M‐H, Random, 95% CI) | 0.0 [0.0, 0.0] | |
| 3 Number of participants who withdrew due to adverse events Show forest plot | 3 | Risk Ratio (M‐H, Random, 95% CI) | Totals not selected | |
| 3.1 Zoledronate (1) vs. pamidronate (2) | 1 | Risk Ratio (M‐H, Random, 95% CI) | 0.0 [0.0, 0.0] | |
| 3.2 Zolendronate (1) vs. risedronate (2) | 1 | Risk Ratio (M‐H, Random, 95% CI) | 0.0 [0.0, 0.0] | |
| 3.3 Alendronate (1) vs. pamidronate (2) | 1 | Risk Ratio (M‐H, Random, 95% CI) | 0.0 [0.0, 0.0] | |
| 4 Mean percentage change from baseline in serum total alkaline phosphatase level Show forest plot | 3 | Mean Difference (IV, Fixed, 95% CI) | Totals not selected | |
| 4.1 Olpadronate (1) vs. pamidronate (2) | 1 | Mean Difference (IV, Fixed, 95% CI) | 0.0 [0.0, 0.0] | |
| 4.2 Zolendronate (1) vs. risedronate (2) | 1 | Mean Difference (IV, Fixed, 95% CI) | 0.0 [0.0, 0.0] | |
| 4.3 Alendronate (1) vs. pamidronate (2) | 1 | Mean Difference (IV, Fixed, 95% CI) | 0.0 [0.0, 0.0] | |
| 5 Number of participants who achieved normalised alkaline phosphatase level Show forest plot | 4 | Risk Ratio (M‐H, Random, 95% CI) | Totals not selected | |
| 5.1 Olpadronate (1) vs. pamidronate (2) | 1 | Risk Ratio (M‐H, Random, 95% CI) | 0.0 [0.0, 0.0] | |
| 5.2 Zoledronate (1) vs. pamidronate (2) | 1 | Risk Ratio (M‐H, Random, 95% CI) | 0.0 [0.0, 0.0] | |
| 5.3 Zolendronate (1) vs. risedronate (2) | 1 | Risk Ratio (M‐H, Random, 95% CI) | 0.0 [0.0, 0.0] | |
| 5.4 Alendronate (1) vs. pamidronate (2) | 1 | Risk Ratio (M‐H, Random, 95% CI) | 0.0 [0.0, 0.0] | |
| 6 Number of participants who experienced biochemical relapse with increased alkaline phosphatase level Show forest plot | 2 | Risk Ratio (M‐H, Random, 95% CI) | Totals not selected | |
| 6.1 Zoledronate (1) vs. pamidronate (2) | 1 | Risk Ratio (M‐H, Random, 95% CI) | 0.0 [0.0, 0.0] | |
| 6.2 Zoledronate (1) vs. risedronate (2) | 0 | Risk Ratio (M‐H, Random, 95% CI) | 0.0 [0.0, 0.0] | |
| 6.3 Alendronate (1) vs. pamidronate (2) | 1 | Risk Ratio (M‐H, Random, 95% CI) | 0.0 [0.0, 0.0] | |