Scolaris Content Display Scolaris Content Display

Comparison 1 Cyst(e)ine vs. placebo in added to cysteine‐free PN, Outcome 1 Weight gain during the study (g/kg/day).
Figuras y tablas -
Analysis 1.1

Comparison 1 Cyst(e)ine vs. placebo in added to cysteine‐free PN, Outcome 1 Weight gain during the study (g/kg/day).

Comparison 1 Cyst(e)ine vs. placebo in added to cysteine‐free PN, Outcome 2 Increase in length (cm/ 6 days).
Figuras y tablas -
Analysis 1.2

Comparison 1 Cyst(e)ine vs. placebo in added to cysteine‐free PN, Outcome 2 Increase in length (cm/ 6 days).

Comparison 1 Cyst(e)ine vs. placebo in added to cysteine‐free PN, Outcome 3 Increase in head circumference (cm/ 6 days).
Figuras y tablas -
Analysis 1.3

Comparison 1 Cyst(e)ine vs. placebo in added to cysteine‐free PN, Outcome 3 Increase in head circumference (cm/ 6 days).

Comparison 1 Cyst(e)ine vs. placebo in added to cysteine‐free PN, Outcome 4 Nitrogen retention (mg/kg/day).
Figuras y tablas -
Analysis 1.4

Comparison 1 Cyst(e)ine vs. placebo in added to cysteine‐free PN, Outcome 4 Nitrogen retention (mg/kg/day).

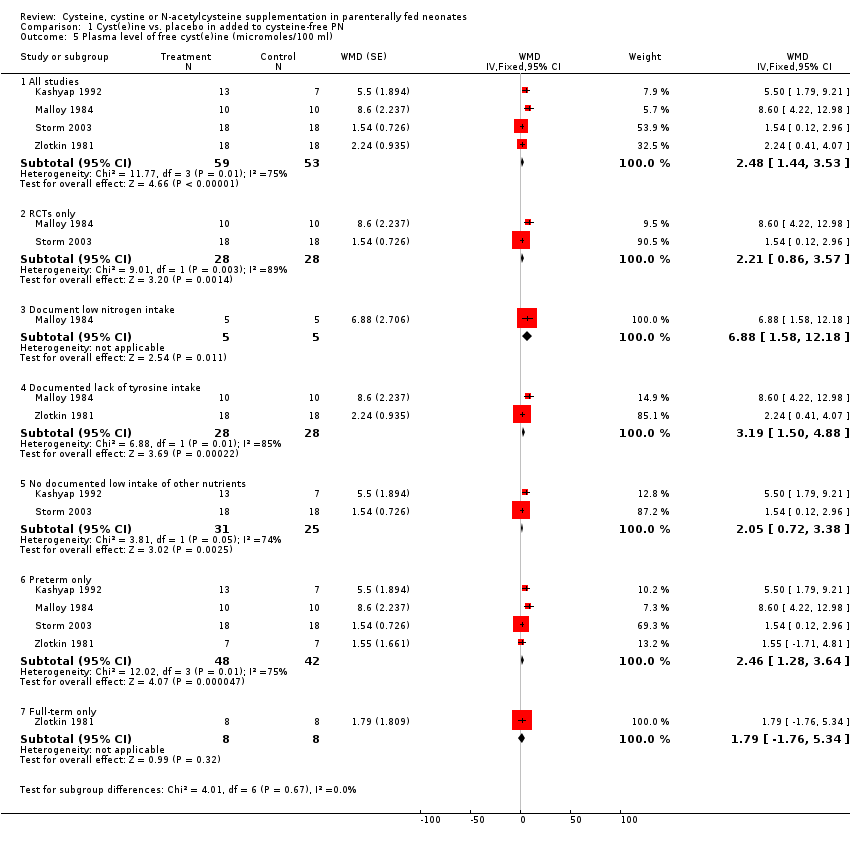
Comparison 1 Cyst(e)ine vs. placebo in added to cysteine‐free PN, Outcome 5 Plasma level of free cyst(e)ine (micromoles/100 ml).
Figuras y tablas -
Analysis 1.5

Comparison 1 Cyst(e)ine vs. placebo in added to cysteine‐free PN, Outcome 5 Plasma level of free cyst(e)ine (micromoles/100 ml).

Comparison 1 Cyst(e)ine vs. placebo in added to cysteine‐free PN, Outcome 6 Total plasma cyst(e)ine level (micromoles/ 100 ml).
Figuras y tablas -
Analysis 1.6

Comparison 1 Cyst(e)ine vs. placebo in added to cysteine‐free PN, Outcome 6 Total plasma cyst(e)ine level (micromoles/ 100 ml).

Comparison 2 N‐acetylcysteine vs. placebo added to cysteine‐containing PN, Outcome 1 Weight gain during the study (g/kg/day).
Figuras y tablas -
Analysis 2.1

Comparison 2 N‐acetylcysteine vs. placebo added to cysteine‐containing PN, Outcome 1 Weight gain during the study (g/kg/day).

Comparison 2 N‐acetylcysteine vs. placebo added to cysteine‐containing PN, Outcome 2 Weight (g) at 36 weeks of postmenstrual age.
Figuras y tablas -
Analysis 2.2

Comparison 2 N‐acetylcysteine vs. placebo added to cysteine‐containing PN, Outcome 2 Weight (g) at 36 weeks of postmenstrual age.

Comparison 2 N‐acetylcysteine vs. placebo added to cysteine‐containing PN, Outcome 3 Death by 36 weeks of postmenstrual age.
Figuras y tablas -
Analysis 2.3

Comparison 2 N‐acetylcysteine vs. placebo added to cysteine‐containing PN, Outcome 3 Death by 36 weeks of postmenstrual age.

Comparison 2 N‐acetylcysteine vs. placebo added to cysteine‐containing PN, Outcome 4 Bronchopulmonary dysplasia among survivors at 36 weeks of postmenstrual age.
Figuras y tablas -
Analysis 2.4

Comparison 2 N‐acetylcysteine vs. placebo added to cysteine‐containing PN, Outcome 4 Bronchopulmonary dysplasia among survivors at 36 weeks of postmenstrual age.

Comparison 2 N‐acetylcysteine vs. placebo added to cysteine‐containing PN, Outcome 5 Death or Bronchopulmonary Dysplasia (36 weeks postmenstrual age).
Figuras y tablas -
Analysis 2.5

Comparison 2 N‐acetylcysteine vs. placebo added to cysteine‐containing PN, Outcome 5 Death or Bronchopulmonary Dysplasia (36 weeks postmenstrual age).

Comparison 2 N‐acetylcysteine vs. placebo added to cysteine‐containing PN, Outcome 6 Retinopathy of prematurity (any stage) among those examined.
Figuras y tablas -
Analysis 2.6

Comparison 2 N‐acetylcysteine vs. placebo added to cysteine‐containing PN, Outcome 6 Retinopathy of prematurity (any stage) among those examined.

Comparison 2 N‐acetylcysteine vs. placebo added to cysteine‐containing PN, Outcome 7 Severe (stage 3 or more) retinopathy of prematurity among those examined.
Figuras y tablas -
Analysis 2.7

Comparison 2 N‐acetylcysteine vs. placebo added to cysteine‐containing PN, Outcome 7 Severe (stage 3 or more) retinopathy of prematurity among those examined.

Comparison 2 N‐acetylcysteine vs. placebo added to cysteine‐containing PN, Outcome 8 Necrotizing enterocolitis (operated).
Figuras y tablas -
Analysis 2.8

Comparison 2 N‐acetylcysteine vs. placebo added to cysteine‐containing PN, Outcome 8 Necrotizing enterocolitis (operated).

Comparison 2 N‐acetylcysteine vs. placebo added to cysteine‐containing PN, Outcome 9 Periventricular leukomalacia in all examined.
Figuras y tablas -
Analysis 2.9

Comparison 2 N‐acetylcysteine vs. placebo added to cysteine‐containing PN, Outcome 9 Periventricular leukomalacia in all examined.

Comparison 2 N‐acetylcysteine vs. placebo added to cysteine‐containing PN, Outcome 10 Intraventricular hemorrhage (any grade).
Figuras y tablas -
Analysis 2.10

Comparison 2 N‐acetylcysteine vs. placebo added to cysteine‐containing PN, Outcome 10 Intraventricular hemorrhage (any grade).

Comparison 2 N‐acetylcysteine vs. placebo added to cysteine‐containing PN, Outcome 11 Severe intraventricular hemorrhage (grade 3‐4).
Figuras y tablas -
Analysis 2.11

Comparison 2 N‐acetylcysteine vs. placebo added to cysteine‐containing PN, Outcome 11 Severe intraventricular hemorrhage (grade 3‐4).

Comparison 2 N‐acetylcysteine vs. placebo added to cysteine‐containing PN, Outcome 12 Plasma level of free cyst(e)ine (micromoles/ 100 ml).
Figuras y tablas -
Analysis 2.12

Comparison 2 N‐acetylcysteine vs. placebo added to cysteine‐containing PN, Outcome 12 Plasma level of free cyst(e)ine (micromoles/ 100 ml).

Comparison 1. Cyst(e)ine vs. placebo in added to cysteine‐free PN

Outcome or subgroup title

No. of studies

No. of participants

Statistical method

Effect size

1 Weight gain during the study (g/kg/day) Show forest plot

1

36

Mean Difference (IV, Fixed, 95% CI)

‐4.1 [‐9.72, 1.52]

2 Increase in length (cm/ 6 days) Show forest plot

1

36

Mean Difference (IV, Fixed, 95% CI)

0.0 [‐0.41, 0.41]

3 Increase in head circumference (cm/ 6 days) Show forest plot

1

36

Mean Difference (IV, Fixed, 95% CI)

0.30 [‐0.11, 0.71]

4 Nitrogen retention (mg/kg/day) Show forest plot

4

Mean Difference (IV, Fixed, 95% CI)

Subtotals only

4.1 All studies

4

95

Mean Difference (IV, Fixed, 95% CI)

31.81 [8.18, 55.43]

4.2 RCTs only

2

39

Mean Difference (IV, Fixed, 95% CI)

51.97 [18.21, 85.73]

4.3 Documented low nitrogen intake

1

10

Mean Difference (IV, Fixed, 95% CI)

36.20 [‐20.90, 93.30]

4.4 Documented lack of tyrosine intake

2

56

Mean Difference (IV, Fixed, 95% CI)

24.54 [‐1.56, 50.65]

4.5 No documented low intake of other nutrients

2

39

Mean Difference (IV, Fixed, 95% CI)

64.64 [9.12, 120.16]

4.6 Preterm only

4

73

Mean Difference (IV, Fixed, 95% CI)

40.53 [13.52, 67.55]

4.7 Full‐term only

1

16

Mean Difference (IV, Fixed, 95% CI)

‐14.0 [‐79.24, 51.24]

5 Plasma level of free cyst(e)ine (micromoles/100 ml) Show forest plot

4

WMD (Fixed, 95% CI)

Subtotals only

5.1 All studies

4

112

WMD (Fixed, 95% CI)

2.48 [1.44, 3.53]

5.2 RCTs only

2

56

WMD (Fixed, 95% CI)

2.21 [0.86, 3.57]

5.3 Document low nitrogen intake

1

10

WMD (Fixed, 95% CI)

6.88 [1.58, 12.18]

5.4 Documented lack of tyrosine intake

2

56

WMD (Fixed, 95% CI)

3.19 [1.50, 4.88]

5.5 No documented low intake of other nutrients

2

56

WMD (Fixed, 95% CI)

2.05 [0.72, 3.38]

5.6 Preterm only

4

90

WMD (Fixed, 95% CI)

2.46 [1.28, 3.64]

5.7 Full‐term only

1

16

WMD (Fixed, 95% CI)

1.79 [‐1.76, 5.34]

6 Total plasma cyst(e)ine level (micromoles/ 100 ml) Show forest plot

1

20

Mean Difference (IV, Fixed, 95% CI)

9.40 [5.13, 13.67]

Figuras y tablas -
Comparison 1. Cyst(e)ine vs. placebo in added to cysteine‐free PN
Comparison 2. N‐acetylcysteine vs. placebo added to cysteine‐containing PN

Outcome or subgroup title

No. of studies

No. of participants

Statistical method

Effect size

1 Weight gain during the study (g/kg/day) Show forest plot

1

332

Mean Difference (IV, Fixed, 95% CI)

0.25 [‐2.70, 3.20]

2 Weight (g) at 36 weeks of postmenstrual age Show forest plot

1

323

Mean Difference (IV, Fixed, 95% CI)

‐4.80 [‐90.66, 81.06]

3 Death by 36 weeks of postmenstrual age Show forest plot

1

391

Risk Ratio (M‐H, Fixed, 95% CI)

1.23 [0.78, 1.95]

4 Bronchopulmonary dysplasia among survivors at 36 weeks of postmenstrual age Show forest plot

1

328

Risk Ratio (M‐H, Fixed, 95% CI)

0.99 [0.76, 1.29]

5 Death or Bronchopulmonary Dysplasia (36 weeks postmenstrual age) Show forest plot

1

391

Risk Ratio (M‐H, Fixed, 95% CI)

1.04 [0.85, 1.27]

6 Retinopathy of prematurity (any stage) among those examined Show forest plot

1

332

Risk Ratio (M‐H, Fixed, 95% CI)

0.89 [0.71, 1.12]

7 Severe (stage 3 or more) retinopathy of prematurity among those examined Show forest plot

1

332

Risk Ratio (M‐H, Fixed, 95% CI)

1.06 [0.59, 1.90]

8 Necrotizing enterocolitis (operated) Show forest plot

1

391

Risk Ratio (M‐H, Fixed, 95% CI)

1.08 [0.56, 2.07]

9 Periventricular leukomalacia in all examined Show forest plot

1

388

Risk Ratio (M‐H, Fixed, 95% CI)

0.72 [0.38, 1.36]

10 Intraventricular hemorrhage (any grade) Show forest plot

1

388

Risk Ratio (M‐H, Fixed, 95% CI)

1.10 [0.78, 1.55]

11 Severe intraventricular hemorrhage (grade 3‐4) Show forest plot

1

386

Risk Ratio (M‐H, Fixed, 95% CI)

1.18 [0.66, 2.11]

12 Plasma level of free cyst(e)ine (micromoles/ 100 ml) Show forest plot

1

165

Mean Difference (IV, Fixed, 95% CI)

‐2.50 [‐4.61, ‐0.39]

Figuras y tablas -
Comparison 2. N‐acetylcysteine vs. placebo added to cysteine‐containing PN