Scolaris Content Display Scolaris Content Display

Comparison 1 BEHAVIOURAL: ELECTRICAL AVERSION vs SELF REGULATION, Outcome 1 Leaving the study early ‐ by 1 week.
Figuras y tablas -
Analysis 1.1

Comparison 1 BEHAVIOURAL: ELECTRICAL AVERSION vs SELF REGULATION, Outcome 1 Leaving the study early ‐ by 1 week.

Comparison 2 BEHAVIOURAL: RELAXATION TREATMENT vs SELF REGULATION, Outcome 1 Leaving the study early ‐ by 1 week.
Figuras y tablas -
Analysis 2.1

Comparison 2 BEHAVIOURAL: RELAXATION TREATMENT vs SELF REGULATION, Outcome 1 Leaving the study early ‐ by 1 week.

Comparison 3 BEHAVIOURAL: ELECTRICAL AVERSION vs RELAXATION TREATMENT, Outcome 1 Leaving the study early ‐ by 1 week.
Figuras y tablas -
Analysis 3.1

Comparison 3 BEHAVIOURAL: ELECTRICAL AVERSION vs RELAXATION TREATMENT, Outcome 1 Leaving the study early ‐ by 1 week.

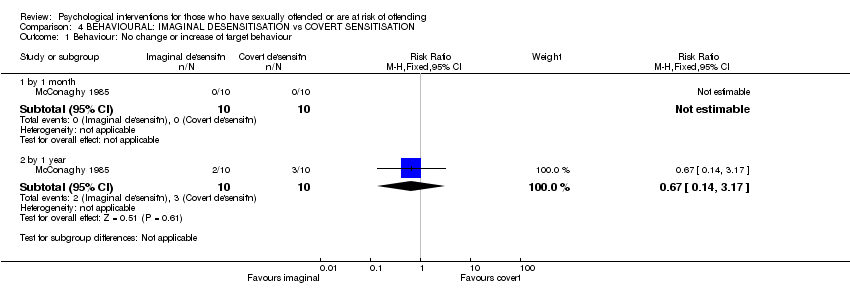
Comparison 4 BEHAVIOURAL: IMAGINAL DESENSITISATION vs COVERT SENSITISATION, Outcome 1 Behaviour: No change or increase of target behaviour.
Figuras y tablas -
Analysis 4.1

Comparison 4 BEHAVIOURAL: IMAGINAL DESENSITISATION vs COVERT SENSITISATION, Outcome 1 Behaviour: No change or increase of target behaviour.

Comparison 4 BEHAVIOURAL: IMAGINAL DESENSITISATION vs COVERT SENSITISATION, Outcome 2 Desire: No change or increased desire for target behaviour.
Figuras y tablas -
Analysis 4.2

Comparison 4 BEHAVIOURAL: IMAGINAL DESENSITISATION vs COVERT SENSITISATION, Outcome 2 Desire: No change or increased desire for target behaviour.

Comparison 4 BEHAVIOURAL: IMAGINAL DESENSITISATION vs COVERT SENSITISATION, Outcome 3 Attitude to treatment: Requesting further treatment within 1 year.
Figuras y tablas -
Analysis 4.3

Comparison 4 BEHAVIOURAL: IMAGINAL DESENSITISATION vs COVERT SENSITISATION, Outcome 3 Attitude to treatment: Requesting further treatment within 1 year.

Comparison 5 BEHAVIOURAL: IMAGINAL DESENSITISATION vs MEDROXYPROGESTERONE, Outcome 1 Behaviour: No change in target behaviour.
Figuras y tablas -
Analysis 5.1

Comparison 5 BEHAVIOURAL: IMAGINAL DESENSITISATION vs MEDROXYPROGESTERONE, Outcome 1 Behaviour: No change in target behaviour.

Comparison 5 BEHAVIOURAL: IMAGINAL DESENSITISATION vs MEDROXYPROGESTERONE, Outcome 2 Desire: No change in desire for target behaviour.
Figuras y tablas -
Analysis 5.2

Comparison 5 BEHAVIOURAL: IMAGINAL DESENSITISATION vs MEDROXYPROGESTERONE, Outcome 2 Desire: No change in desire for target behaviour.

Comparison 5 BEHAVIOURAL: IMAGINAL DESENSITISATION vs MEDROXYPROGESTERONE, Outcome 3 Leaving the study early ‐ by 1 year.
Figuras y tablas -
Analysis 5.3

Comparison 5 BEHAVIOURAL: IMAGINAL DESENSITISATION vs MEDROXYPROGESTERONE, Outcome 3 Leaving the study early ‐ by 1 year.

Comparison 6 COGNITIVE: COGNITIVE BEHAVIOURAL GROUP THERAPY vs NO TREATMENT, Outcome 1 Recidivism by over 1 year.
Figuras y tablas -
Analysis 6.1

Comparison 6 COGNITIVE: COGNITIVE BEHAVIOURAL GROUP THERAPY vs NO TREATMENT, Outcome 1 Recidivism by over 1 year.

Comparison 7 COGNITIVE: COGNITIVE, SOCIAL, EDUCATIONAL TREATMENT vs STANDARD CARE, Outcome 1 Behaviour: Heterosocial skills: Average endpoint score at 6 weeks (HSB, high = good).
Figuras y tablas -
Analysis 7.1

Comparison 7 COGNITIVE: COGNITIVE, SOCIAL, EDUCATIONAL TREATMENT vs STANDARD CARE, Outcome 1 Behaviour: Heterosocial skills: Average endpoint score at 6 weeks (HSB, high = good).

Study

Intervention

Mean

SD

N

Notes

Anderson‐Varney 1991

Cognitive, social educational programme

10.63

8.47

30

Group effect not significant [F(1,58) = 0.389]

Anderson‐Varney 1991

Standard care

13.63

14.98

30

Hopkins 1991

Cognitive, social educational programme

10.5

8.9

8

Hopkins 1991

Standard care

10.9

9.2

7

Figuras y tablas -
Analysis 7.2

Comparison 7 COGNITIVE: COGNITIVE, SOCIAL, EDUCATIONAL TREATMENT vs STANDARD CARE, Outcome 2 Behaviour: Social avoidance and distress: Average endpoint score at 2 months (SADS, high = poor, data skewed).

Comparison 7 COGNITIVE: COGNITIVE, SOCIAL, EDUCATIONAL TREATMENT vs STANDARD CARE, Outcome 3 Self esteem: Average endpoint scores (various scales).
Figuras y tablas -
Analysis 7.3

Comparison 7 COGNITIVE: COGNITIVE, SOCIAL, EDUCATIONAL TREATMENT vs STANDARD CARE, Outcome 3 Self esteem: Average endpoint scores (various scales).

Comparison 7 COGNITIVE: COGNITIVE, SOCIAL, EDUCATIONAL TREATMENT vs STANDARD CARE, Outcome 4 Cognitive distortions: 1. Average endpoint score at 2 months (ABCS, high = good).
Figuras y tablas -
Analysis 7.4

Comparison 7 COGNITIVE: COGNITIVE, SOCIAL, EDUCATIONAL TREATMENT vs STANDARD CARE, Outcome 4 Cognitive distortions: 1. Average endpoint score at 2 months (ABCS, high = good).

Study

Intervention

Mean

SD

N

Notes

Anderson‐Varney 1991

Cognitive, social educational programme

12.73

10.25

30

[F (1,58)=0.637]

Anderson‐Varney 1991

Standard care

13.53

10.82

30

Figuras y tablas -
Analysis 7.5

Comparison 7 COGNITIVE: COGNITIVE, SOCIAL, EDUCATIONAL TREATMENT vs STANDARD CARE, Outcome 5 Cognitive distortions: 2. Average endpoint score at 2 months (MSI, high = good, data skewed).

Comparison 7 COGNITIVE: COGNITIVE, SOCIAL, EDUCATIONAL TREATMENT vs STANDARD CARE, Outcome 6 Sexual knowledge: Average endpoint score at 2 months (MSI, high = good).
Figuras y tablas -
Analysis 7.6

Comparison 7 COGNITIVE: COGNITIVE, SOCIAL, EDUCATIONAL TREATMENT vs STANDARD CARE, Outcome 6 Sexual knowledge: Average endpoint score at 2 months (MSI, high = good).

Comparison 7 COGNITIVE: COGNITIVE, SOCIAL, EDUCATIONAL TREATMENT vs STANDARD CARE, Outcome 7 Anxiousness / inadequacy: 1. Average endpoint scores (various scales, non‐skewed data).
Figuras y tablas -
Analysis 7.7

Comparison 7 COGNITIVE: COGNITIVE, SOCIAL, EDUCATIONAL TREATMENT vs STANDARD CARE, Outcome 7 Anxiousness / inadequacy: 1. Average endpoint scores (various scales, non‐skewed data).

Study

Intervention

Mean

SD

N

Notes

Hopkins 1991

Cognitive, social, educational group

13.9

8.0

8

Hopkins 1991

Standard care

17.7

9.2

7

Figuras y tablas -
Analysis 7.8

Comparison 7 COGNITIVE: COGNITIVE, SOCIAL, EDUCATIONAL TREATMENT vs STANDARD CARE, Outcome 8 Anxiousness / inadequacy: 2. Average fear of negative evaluation by 6 months (FNE, high = poor, skewed data).

Comparison 7 COGNITIVE: COGNITIVE, SOCIAL, EDUCATIONAL TREATMENT vs STANDARD CARE, Outcome 9 Leaving the study early.
Figuras y tablas -
Analysis 7.9

Comparison 7 COGNITIVE: COGNITIVE, SOCIAL, EDUCATIONAL TREATMENT vs STANDARD CARE, Outcome 9 Leaving the study early.

Comparison 8 COGNITIVE: COGNITIVE GROUP THERAPY vs TRANSTHEORETICAL COUNSELLING GROUP THERAPY (CLUSTER DERIVED DATA), Outcome 1 Attitudes to treatment: Poor attitude ‐ at 24 weeks.
Figuras y tablas -
Analysis 8.1

Comparison 8 COGNITIVE: COGNITIVE GROUP THERAPY vs TRANSTHEORETICAL COUNSELLING GROUP THERAPY (CLUSTER DERIVED DATA), Outcome 1 Attitudes to treatment: Poor attitude ‐ at 24 weeks.

Comparison 8 COGNITIVE: COGNITIVE GROUP THERAPY vs TRANSTHEORETICAL COUNSELLING GROUP THERAPY (CLUSTER DERIVED DATA), Outcome 2 Cognitive distortions: Cognitive distortions & immaturity ‐ at 24 weeks.
Figuras y tablas -
Analysis 8.2

Comparison 8 COGNITIVE: COGNITIVE GROUP THERAPY vs TRANSTHEORETICAL COUNSELLING GROUP THERAPY (CLUSTER DERIVED DATA), Outcome 2 Cognitive distortions: Cognitive distortions & immaturity ‐ at 24 weeks.

Comparison 8 COGNITIVE: COGNITIVE GROUP THERAPY vs TRANSTHEORETICAL COUNSELLING GROUP THERAPY (CLUSTER DERIVED DATA), Outcome 3 Sexual knowledge: Poor knowledge of sex ‐ at 24 weeks.
Figuras y tablas -
Analysis 8.3

Comparison 8 COGNITIVE: COGNITIVE GROUP THERAPY vs TRANSTHEORETICAL COUNSELLING GROUP THERAPY (CLUSTER DERIVED DATA), Outcome 3 Sexual knowledge: Poor knowledge of sex ‐ at 24 weeks.

Comparison 8 COGNITIVE: COGNITIVE GROUP THERAPY vs TRANSTHEORETICAL COUNSELLING GROUP THERAPY (CLUSTER DERIVED DATA), Outcome 4 Sexual obsessions: High levels of obsession ‐ at 24 weeks.
Figuras y tablas -
Analysis 8.4

Comparison 8 COGNITIVE: COGNITIVE GROUP THERAPY vs TRANSTHEORETICAL COUNSELLING GROUP THERAPY (CLUSTER DERIVED DATA), Outcome 4 Sexual obsessions: High levels of obsession ‐ at 24 weeks.

Comparison 8 COGNITIVE: COGNITIVE GROUP THERAPY vs TRANSTHEORETICAL COUNSELLING GROUP THERAPY (CLUSTER DERIVED DATA), Outcome 5 Social sexual desirability: Denies interest to the point of promoting asexual image ‐ at 24 weeks.
Figuras y tablas -
Analysis 8.5

Comparison 8 COGNITIVE: COGNITIVE GROUP THERAPY vs TRANSTHEORETICAL COUNSELLING GROUP THERAPY (CLUSTER DERIVED DATA), Outcome 5 Social sexual desirability: Denies interest to the point of promoting asexual image ‐ at 24 weeks.

Comparison 9 PSYCHOTHERAPY ‐ UNSPECIFIED: GROUP PSYCHOTHERAPY vs NO GROUP THERAPY, Outcome 1 Rearrest within 10 years.
Figuras y tablas -
Analysis 9.1

Comparison 9 PSYCHOTHERAPY ‐ UNSPECIFIED: GROUP PSYCHOTHERAPY vs NO GROUP THERAPY, Outcome 1 Rearrest within 10 years.

Comparison 1. BEHAVIOURAL: ELECTRICAL AVERSION vs SELF REGULATION

Outcome or subgroup title

No. of studies

No. of participants

Statistical method

Effect size

1 Leaving the study early ‐ by 1 week Show forest plot

1

8

Risk Ratio (M‐H, Fixed, 95% CI)

0.0 [0.0, 0.0]

Figuras y tablas -
Comparison 1. BEHAVIOURAL: ELECTRICAL AVERSION vs SELF REGULATION
Comparison 2. BEHAVIOURAL: RELAXATION TREATMENT vs SELF REGULATION

Outcome or subgroup title

No. of studies

No. of participants

Statistical method

Effect size

1 Leaving the study early ‐ by 1 week Show forest plot

1

8

Risk Ratio (M‐H, Fixed, 95% CI)

0.0 [0.0, 0.0]

Figuras y tablas -
Comparison 2. BEHAVIOURAL: RELAXATION TREATMENT vs SELF REGULATION
Comparison 3. BEHAVIOURAL: ELECTRICAL AVERSION vs RELAXATION TREATMENT

Outcome or subgroup title

No. of studies

No. of participants

Statistical method

Effect size

1 Leaving the study early ‐ by 1 week Show forest plot

1

8

Risk Ratio (M‐H, Fixed, 95% CI)

0.0 [0.0, 0.0]

Figuras y tablas -
Comparison 3. BEHAVIOURAL: ELECTRICAL AVERSION vs RELAXATION TREATMENT
Comparison 4. BEHAVIOURAL: IMAGINAL DESENSITISATION vs COVERT SENSITISATION

Outcome or subgroup title

No. of studies

No. of participants

Statistical method

Effect size

1 Behaviour: No change or increase of target behaviour Show forest plot

1

Risk Ratio (M‐H, Fixed, 95% CI)

Subtotals only

1.1 by 1 month

1

20

Risk Ratio (M‐H, Fixed, 95% CI)

0.0 [0.0, 0.0]

1.2 by 1 year

1

20

Risk Ratio (M‐H, Fixed, 95% CI)

0.67 [0.14, 3.17]

2 Desire: No change or increased desire for target behaviour Show forest plot

1

Risk Ratio (M‐H, Fixed, 95% CI)

Subtotals only

2.1 by 1 month

1

20

Risk Ratio (M‐H, Fixed, 95% CI)

1.0 [0.07, 13.87]

2.2 by 1 year

1

20

Risk Ratio (M‐H, Fixed, 95% CI)

0.33 [0.02, 7.32]

3 Attitude to treatment: Requesting further treatment within 1 year Show forest plot

1

20

Risk Ratio (M‐H, Fixed, 95% CI)

0.5 [0.05, 4.67]

Figuras y tablas -
Comparison 4. BEHAVIOURAL: IMAGINAL DESENSITISATION vs COVERT SENSITISATION
Comparison 5. BEHAVIOURAL: IMAGINAL DESENSITISATION vs MEDROXYPROGESTERONE

Outcome or subgroup title

No. of studies

No. of participants

Statistical method

Effect size

1 Behaviour: No change in target behaviour Show forest plot

1

Risk Ratio (M‐H, Fixed, 95% CI)

Subtotals only

1.1 by 1 month

1

20

Risk Ratio (M‐H, Fixed, 95% CI)

0.33 [0.02, 7.32]

1.2 by 1 year

1

20

Risk Ratio (M‐H, Fixed, 95% CI)

0.0 [0.0, 0.0]

2 Desire: No change in desire for target behaviour Show forest plot

1

Risk Ratio (M‐H, Fixed, 95% CI)

Subtotals only

2.1 by 1 month

1

20

Risk Ratio (M‐H, Fixed, 95% CI)

0.33 [0.02, 7.32]

2.2 by 1 year

1

20

Risk Ratio (M‐H, Fixed, 95% CI)

0.0 [0.0, 0.0]

3 Leaving the study early ‐ by 1 year Show forest plot

1

20

Risk Ratio (M‐H, Fixed, 95% CI)

0.0 [0.0, 0.0]

Figuras y tablas -
Comparison 5. BEHAVIOURAL: IMAGINAL DESENSITISATION vs MEDROXYPROGESTERONE
Comparison 6. COGNITIVE: COGNITIVE BEHAVIOURAL GROUP THERAPY vs NO TREATMENT

Outcome or subgroup title

No. of studies

No. of participants

Statistical method

Effect size

1 Recidivism by over 1 year Show forest plot

1

Risk Ratio (M‐H, Fixed, 95% CI)

Subtotals only

1.1 involving any combination of sex and violence

1

155

Risk Ratio (M‐H, Fixed, 95% CI)

0.41 [0.20, 0.82]

1.2 involving both sex and violence

1

155

Risk Ratio (M‐H, Fixed, 95% CI)

0.12 [0.01, 2.11]

1.3 involving only sex

1

155

Risk Ratio (M‐H, Fixed, 95% CI)

0.78 [0.28, 2.14]

1.4 involving only violence

1

155

Risk Ratio (M‐H, Fixed, 95% CI)

0.28 [0.08, 0.98]

Figuras y tablas -
Comparison 6. COGNITIVE: COGNITIVE BEHAVIOURAL GROUP THERAPY vs NO TREATMENT
Comparison 7. COGNITIVE: COGNITIVE, SOCIAL, EDUCATIONAL TREATMENT vs STANDARD CARE

Outcome or subgroup title

No. of studies

No. of participants

Statistical method

Effect size

1 Behaviour: Heterosocial skills: Average endpoint score at 6 weeks (HSB, high = good) Show forest plot

1

37

Mean Difference (IV, Fixed, 95% CI)

7.70 [1.45, 13.95]

2 Behaviour: Social avoidance and distress: Average endpoint score at 2 months (SADS, high = poor, data skewed) Show forest plot

Other data

No numeric data

3 Self esteem: Average endpoint scores (various scales) Show forest plot

3

Mean Difference (IV, Fixed, 95% CI)

Subtotals only

3.1 average endpoint score at 6 weeks (SSI)

1

37

Mean Difference (IV, Fixed, 95% CI)

13.20 [‐5.04, 31.44]

3.2 average endpoint scores at 2 months (IRI, high = good)

1

60

Mean Difference (IV, Fixed, 95% CI)

‐0.80 [‐5.62, 4.02]

3.3 average endpoint scores at 6 months (Rosenburg's Scale, high = good)

1

15

Mean Difference (IV, Fixed, 95% CI)

1.60 [‐1.89, 5.09]

4 Cognitive distortions: 1. Average endpoint score at 2 months (ABCS, high = good) Show forest plot

1

60

Mean Difference (IV, Fixed, 95% CI)

13.43 [6.81, 20.05]

5 Cognitive distortions: 2. Average endpoint score at 2 months (MSI, high = good, data skewed) Show forest plot

Other data

No numeric data

6 Sexual knowledge: Average endpoint score at 2 months (MSI, high = good) Show forest plot

1

60

Mean Difference (IV, Fixed, 95% CI)

3.26 [0.31, 6.21]

7 Anxiousness / inadequacy: 1. Average endpoint scores (various scales, non‐skewed data) Show forest plot

2

Mean Difference (IV, Fixed, 95% CI)

Subtotals only

7.1 average heterosocial anxiety endpoint score at 6 weeks (SRIA, high = poor)

1

37

Mean Difference (IV, Fixed, 95% CI)

‐14.0 [‐43.57, 15.57]

7.2 average sexual inadequacy endpoint score at 2 months (MSI, high = poor)

1

60

Mean Difference (IV, Fixed, 95% CI)

‐6.20 [‐13.46, 1.06]

8 Anxiousness / inadequacy: 2. Average fear of negative evaluation by 6 months (FNE, high = poor, skewed data) Show forest plot

Other data

No numeric data

9 Leaving the study early Show forest plot

1

40

Risk Ratio (M‐H, Fixed, 95% CI)

2.0 [0.20, 20.33]

Figuras y tablas -
Comparison 7. COGNITIVE: COGNITIVE, SOCIAL, EDUCATIONAL TREATMENT vs STANDARD CARE
Comparison 8. COGNITIVE: COGNITIVE GROUP THERAPY vs TRANSTHEORETICAL COUNSELLING GROUP THERAPY (CLUSTER DERIVED DATA)

Outcome or subgroup title

No. of studies

No. of participants

Statistical method

Effect size

1 Attitudes to treatment: Poor attitude ‐ at 24 weeks Show forest plot

1

38

Risk Ratio (M‐H, Fixed, 95% CI)

2.8 [1.26, 6.22]

2 Cognitive distortions: Cognitive distortions & immaturity ‐ at 24 weeks Show forest plot

1

38

Risk Ratio (M‐H, Fixed, 95% CI)

1.0 [0.76, 1.32]

3 Sexual knowledge: Poor knowledge of sex ‐ at 24 weeks Show forest plot

1

38

Risk Ratio (M‐H, Fixed, 95% CI)

1.1 [0.62, 1.95]

4 Sexual obsessions: High levels of obsession ‐ at 24 weeks Show forest plot

1

38

Risk Ratio (M‐H, Fixed, 95% CI)

1.5 [0.80, 2.81]

5 Social sexual desirability: Denies interest to the point of promoting asexual image ‐ at 24 weeks Show forest plot

1

38

Risk Ratio (M‐H, Fixed, 95% CI)

1.83 [0.85, 3.94]

Figuras y tablas -
Comparison 8. COGNITIVE: COGNITIVE GROUP THERAPY vs TRANSTHEORETICAL COUNSELLING GROUP THERAPY (CLUSTER DERIVED DATA)
Comparison 9. PSYCHOTHERAPY ‐ UNSPECIFIED: GROUP PSYCHOTHERAPY vs NO GROUP THERAPY

Outcome or subgroup title

No. of studies

No. of participants

Statistical method

Effect size

1 Rearrest within 10 years Show forest plot

1

Risk Ratio (M‐H, Fixed, 95% CI)

Subtotals only

1.1 for sex offense

1

231

Risk Ratio (M‐H, Fixed, 95% CI)

1.87 [0.78, 4.47]

1.2 for any offense

1

231

Risk Ratio (M‐H, Fixed, 95% CI)

9.20 [3.88, 21.78]

Figuras y tablas -
Comparison 9. PSYCHOTHERAPY ‐ UNSPECIFIED: GROUP PSYCHOTHERAPY vs NO GROUP THERAPY