| 1 Mortality (expressed as relative risk) ‐ fixed effect model Show forest plot | 6 | 628 | Risk Ratio (M‐H, Fixed, 95% CI) | 1.34 [1.09, 1.64] |
|
| 2 Mortality (expressed as relative risk) ‐ random effects model Show forest plot | 6 | 628 | Risk Ratio (M‐H, Random, 95% CI) | 1.46 [0.85, 2.50] |
|
| 3 Subgroups of methodological quality ‐ generation of allocation sequence ‐ mortality Show forest plot | 6 | | Risk Ratio (M‐H, Fixed, 95% CI) | Subtotals only |
|
| 3.1 Adequate generation of allocation sequence | 1 | 227 | Risk Ratio (M‐H, Fixed, 95% CI) | 1.00 [0.73, 1.38] |
| 3.2 Unclear or inadequate generation of allocation sequence | 5 | 401 | Risk Ratio (M‐H, Fixed, 95% CI) | 1.60 [1.23, 2.08] |
| 4 Subgroups of methodological quality ‐ allocation concealment ‐ mortality Show forest plot | 6 | 628 | Risk Ratio (M‐H, Fixed, 95% CI) | 1.34 [1.09, 1.64] |
|
| 4.1 Adequate allocation concealment | 2 | 279 | Risk Ratio (M‐H, Fixed, 95% CI) | 1.27 [0.94, 1.72] |
| 4.2 Unclear or inadequate allocation concealment | 4 | 349 | Risk Ratio (M‐H, Fixed, 95% CI) | 1.40 [1.06, 1.84] |
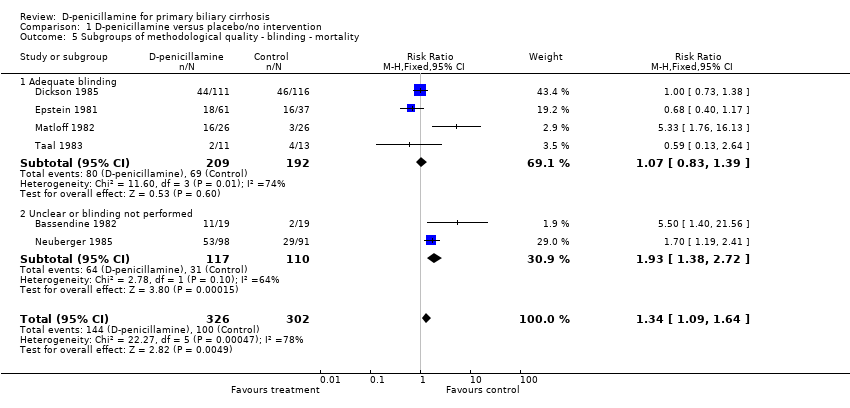
| 5 Subgroups of methodological quality ‐ blinding ‐ mortality Show forest plot | 6 | 628 | Risk Ratio (M‐H, Fixed, 95% CI) | 1.34 [1.09, 1.64] |
|
| 5.1 Adequate blinding | 4 | 401 | Risk Ratio (M‐H, Fixed, 95% CI) | 1.07 [0.83, 1.39] |
| 5.2 Unclear or blinding not performed | 2 | 227 | Risk Ratio (M‐H, Fixed, 95% CI) | 1.93 [1.38, 2.72] |
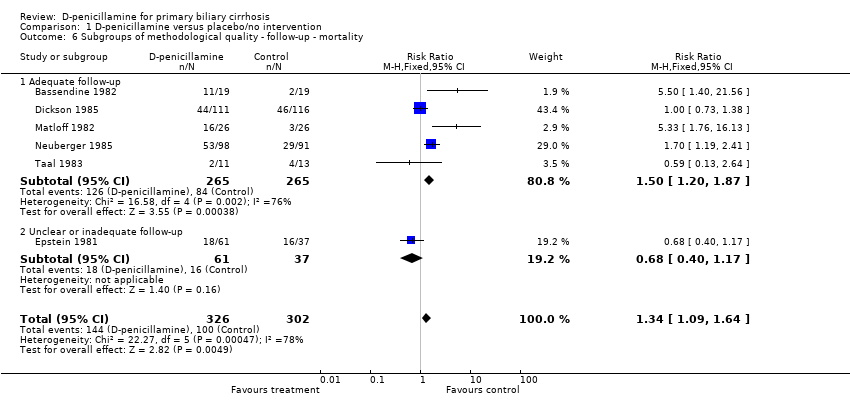
| 6 Subgroups of methodological quality ‐ follow‐up ‐ mortality Show forest plot | 6 | 628 | Risk Ratio (M‐H, Fixed, 95% CI) | 1.34 [1.09, 1.64] |
|
| 6.1 Adequate follow‐up | 5 | 530 | Risk Ratio (M‐H, Fixed, 95% CI) | 1.50 [1.20, 1.87] |
| 6.2 Unclear or inadequate follow‐up | 1 | 98 | Risk Ratio (M‐H, Fixed, 95% CI) | 0.68 [0.40, 1.17] |
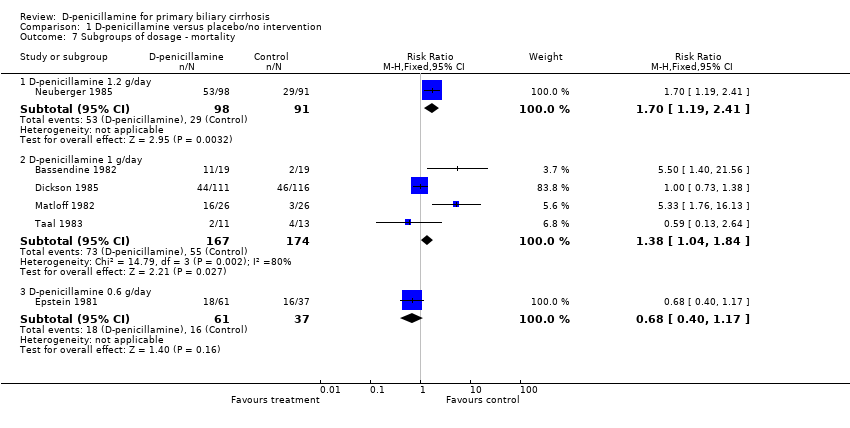
| 7 Subgroups of dosage ‐ mortality Show forest plot | 6 | | Risk Ratio (M‐H, Fixed, 95% CI) | Subtotals only |
|
| 7.1 D‐penicillamine 1.2 g/day | 1 | 189 | Risk Ratio (M‐H, Fixed, 95% CI) | 1.70 [1.19, 2.41] |
| 7.2 D‐penicillamine 1 g/day | 4 | 341 | Risk Ratio (M‐H, Fixed, 95% CI) | 1.38 [1.04, 1.84] |
| 7.3 D‐penicillamine 0.6 g/day | 1 | 98 | Risk Ratio (M‐H, Fixed, 95% CI) | 0.68 [0.40, 1.17] |
| 8 Subgroups of treatment and follow‐up duration ‐ mortality Show forest plot | 6 | 628 | Risk Ratio (M‐H, Fixed, 95% CI) | 1.34 [1.09, 1.64] |
|
| 8.1 Long‐term treatment and long‐term follow‐up | 3 | 514 | Risk Ratio (M‐H, Fixed, 95% CI) | 1.15 [0.93, 1.43] |
| 8.2 Short‐term treatment and short‐term follow‐up | 3 | 114 | Risk Ratio (M‐H, Fixed, 95% CI) | 3.37 [1.70, 6.66] |
| 9 Subgroups of PBC histological stage ‐ mortality Show forest plot | 2 | | Risk Ratio (M‐H, Fixed, 95% CI) | Subtotals only |
|
| 9.1 PBC stage III or IV | 2 | 287 | Risk Ratio (M‐H, Fixed, 95% CI) | 0.85 [0.63, 1.15] |
| 9.2 PBC stage I or II | 1 | 27 | Risk Ratio (M‐H, Fixed, 95% CI) | 0.0 [0.0, 0.0] |
| 10 Sensitivity analyses ‐ mortality Show forest plot | 6 | | Risk Ratio (M‐H, Fixed, 95% CI) | Subtotals only |
|
| 10.1 Available patient course analysis | 6 | 525 | Risk Ratio (M‐H, Fixed, 95% CI) | 1.08 [0.82, 1.43] |
| 10.2 Assuming poor outcome | 6 | 628 | Risk Ratio (M‐H, Fixed, 95% CI) | 1.34 [1.09, 1.64] |
| 10.3 Assuming good outcome | 6 | 628 | Risk Ratio (M‐H, Fixed, 95% CI) | 0.95 [0.71, 1.26] |
| 10.4 Extreme case favouring D‐penicillamine | 6 | 628 | Risk Ratio (M‐H, Fixed, 95% CI) | 0.66 [0.51, 0.86] |
| 10.5 Extreme case favouring control | 6 | 628 | Risk Ratio (M‐H, Fixed, 95% CI) | 1.92 [1.51, 2.43] |
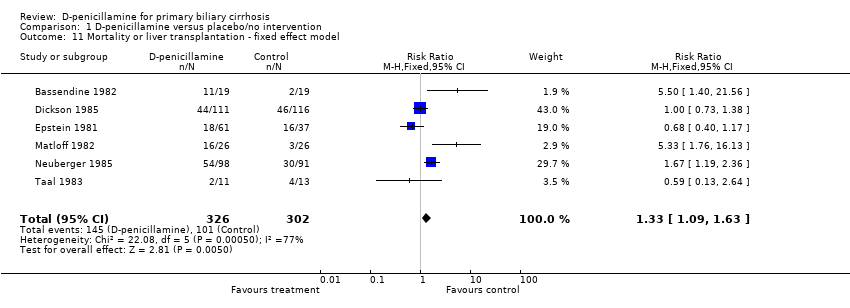
| 11 Mortality or liver transplantation ‐ fixed effect model Show forest plot | 6 | 628 | Risk Ratio (M‐H, Fixed, 95% CI) | 1.33 [1.09, 1.63] |
|
| 12 Mortality or liver transplantation ‐ random effects model Show forest plot | 6 | 628 | Risk Ratio (M‐H, Random, 95% CI) | 1.45 [0.85, 2.48] |
|
| 13 Patients without improvement of pruritus Show forest plot | 1 | 189 | Risk Ratio (M‐H, Fixed, 95% CI) | 0.57 [0.33, 0.99] |
|
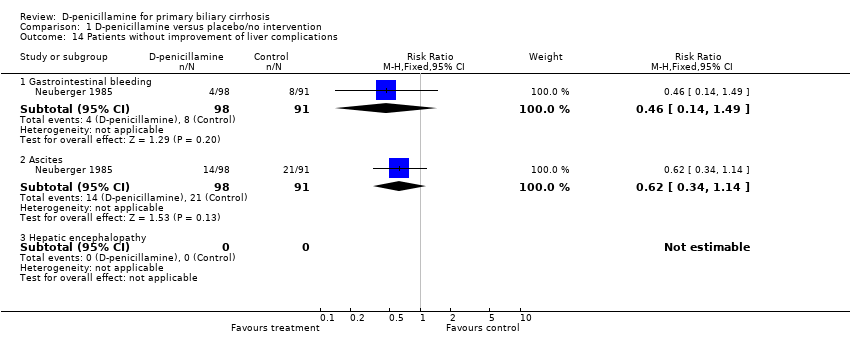
| 14 Patients without improvement of liver complications Show forest plot | 1 | | Risk Ratio (M‐H, Fixed, 95% CI) | Subtotals only |
|
| 14.1 Gastrointestinal bleeding | 1 | 189 | Risk Ratio (M‐H, Fixed, 95% CI) | 0.46 [0.14, 1.49] |
| 14.2 Ascites | 1 | 189 | Risk Ratio (M‐H, Fixed, 95% CI) | 0.62 [0.34, 1.14] |
| 14.3 Hepatic encephalopathy | 0 | 0 | Risk Ratio (M‐H, Fixed, 95% CI) | 0.0 [0.0, 0.0] |
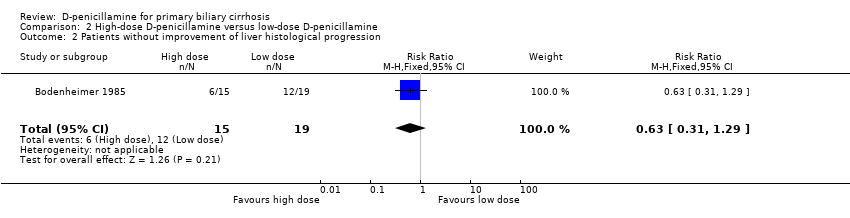
| 15 Liver histology Show forest plot | 3 | | Risk Ratio (M‐H, Fixed, 95% CI) | Subtotals only |
|
| 15.1 Progression of liver histological stage | 3 | 149 | Risk Ratio (M‐H, Fixed, 95% CI) | 0.96 [0.58, 1.58] |
| 15.2 Worsening of histological inflammatory activity | 1 | 87 | Risk Ratio (M‐H, Fixed, 95% CI) | 0.50 [0.26, 0.94] |
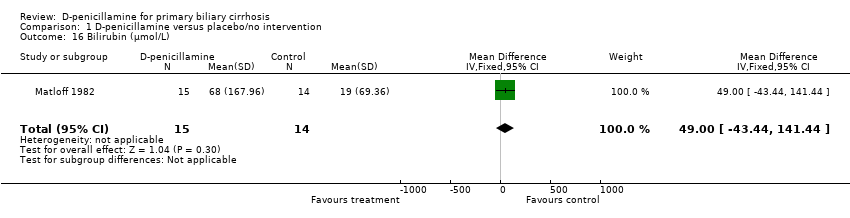
| 16 Bilirubin (µmol/L) Show forest plot | 1 | 29 | Mean Difference (IV, Fixed, 95% CI) | 49.0 [‐43.44, 141.44] |
|
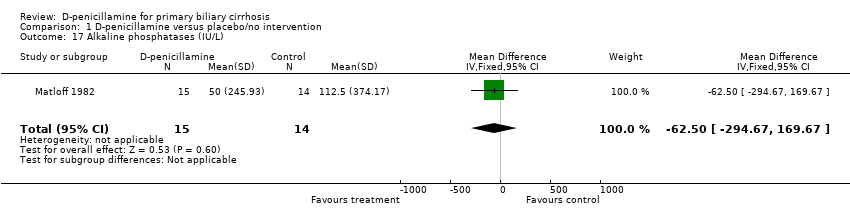
| 17 Alkaline phosphatases (IU/L) Show forest plot | 1 | 29 | Mean Difference (IV, Fixed, 95% CI) | ‐62.50 [‐294.67, 169.67] |
|
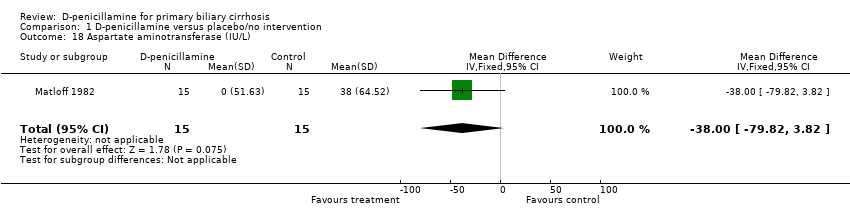
| 18 Aspartate aminotransferase (IU/L) Show forest plot | 1 | 30 | Mean Difference (IV, Fixed, 95% CI) | ‐38.0 [‐79.82, 3.82] |
|
| 19 Alanine aminotransferase (IU/L) Show forest plot | 1 | 22 | Mean Difference (IV, Fixed, 95% CI) | ‐45.0 [‐75.11, ‐14.89] |
|
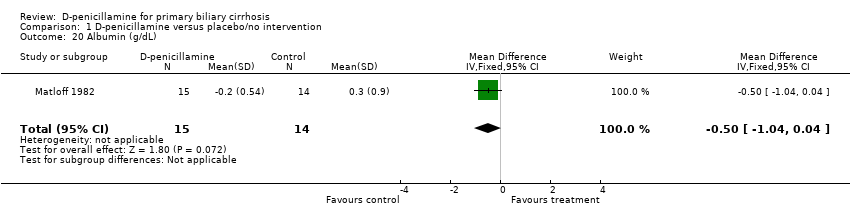
| 20 Albumin (g/dL) Show forest plot | 1 | 29 | Mean Difference (IV, Fixed, 95% CI) | ‐0.5 [‐1.04, 0.04] |
|
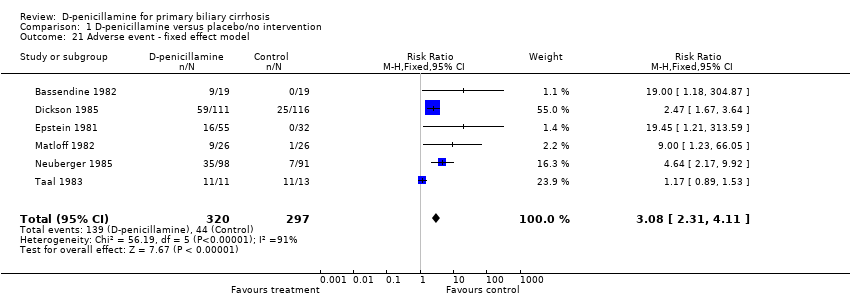
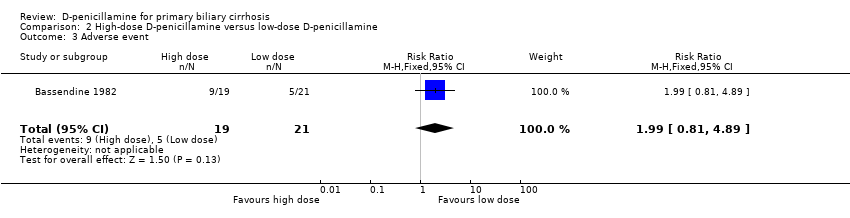
| 21 Adverse event ‐ fixed effect model Show forest plot | 6 | 617 | Risk Ratio (M‐H, Fixed, 95% CI) | 3.08 [2.31, 4.11] |
|
| 22 Adverse event ‐ random effects model Show forest plot | 6 | 617 | Risk Ratio (M‐H, Random, 95% CI) | 3.98 [1.43, 11.04] |
|
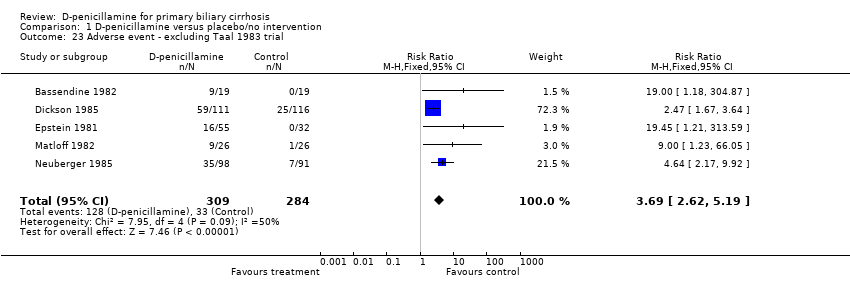
| 23 Adverse event ‐ excluding Taal 1983 trial Show forest plot | 5 | 593 | Risk Ratio (M‐H, Fixed, 95% CI) | 3.69 [2.62, 5.19] |
|