D‐penicilamina para la cirrosis biliar primaria
Referencias
Referencias de los estudios incluidos en esta revisión
Referencias de los estudios excluidos de esta revisión
Referencias adicionales
Referencias de otras versiones publicadas de esta revisión
Characteristics of studies
Characteristics of included studies [ordered by study ID]
Ir a:
| Methods | Generation of allocation sequence: unclear. | |
| Participants | Country: UK. | |
| Interventions | D‐penicillamine 1g/day (n = 19) | |
| Outcomes | 1. Mortality. | |
| Notes | 1. Side effects required withdrawal of D‐penicillamine in nine patients. | |
| Risk of bias | ||
| Bias | Authors' judgement | Support for judgement |
| Allocation concealment? | Unclear risk | B ‐ Unclear |
| Methods | Generation of allocation sequence: unclear. | |
| Participants | Place: USA. | |
| Interventions | High‐dose group (n = 30): 250 mg/day increased gradually until 750 mg/day was achieved. | |
| Outcomes | 1. Mortality data (only total number for two groups). | |
| Notes | 1. Liver test results were analysed as logarithms due to log‐normal distribution of data and reported as per cent change. Therefore, it is not possible for us to extract the data. | |
| Risk of bias | ||
| Bias | Authors' judgement | Support for judgement |
| Allocation concealment? | Unclear risk | D ‐ Not used |
| Methods | Generation of allocation sequence: adequate, a table of random numbers. | |
| Participants | Country: USA. | |
| Interventions | D‐penicillamine 250 mg/day for 2 weeks increased by 250 mg/day every 2 weeks until 1 g/day (n = 111) | |
| Outcomes | 1. Survival analysis. | |
| Notes | 1. Survival data at 5 years were available to be extracted only. | |
| Risk of bias | ||
| Bias | Authors' judgement | Support for judgement |
| Allocation concealment? | Low risk | A ‐ Adequate |
| Methods | Generation of allocation sequence: unclear. | |
| Participants | Country: UK. | |
| Interventions | D‐penicillamine: over 8 to 10 weeks from 150 mg/day to 600 mg/day (n = 61). | |
| Outcomes | 1. Survival data. | |
| Notes | 1. The trial has recruited 98 patients, but data on adverse events were only reported for 87 patients (55 in D‐penicillamine and 32 in placebo group). | |
| Risk of bias | ||
| Bias | Authors' judgement | Support for judgement |
| Allocation concealment? | Unclear risk | B ‐ Unclear |
| Methods | Generation of allocation sequence: unclear. | |
| Participants | Country: USA. | |
| Interventions | D‐penicillamine 1g/day (n = 26). | |
| Outcomes | 1. Survival data. | |
| Notes | 1. Because a high incidence of side effects was noted in the first 39 patients, the last 13 patients were begun on a dose of 250 mg per day, which was gradually increased to 1g per day over a six‐week period. | |
| Risk of bias | ||
| Bias | Authors' judgement | Support for judgement |
| Allocation concealment? | Low risk | A ‐ Adequate |
| Methods | Generation of allocation sequence: unclear. | |
| Participants | Country: UK, Spain, Denmark. | |
| Interventions | D‐penicillamine 1.2 g/day, increased from 300 mg by 300 mg each fortnight until 1.2 g (n = 98) | |
| Outcomes | 1. Clinical features. | |
| Notes | 1. It was an international multicentre (3 centres) trial. | |
| Risk of bias | ||
| Bias | Authors' judgement | Support for judgement |
| Allocation concealment? | Unclear risk | B ‐ Unclear |
| Methods | Generation of allocation sequence: unclear. | |
| Participants | Country: Netherlands. | |
| Interventions | D‐penicillamine 1 g/day (increased from 250 mg every month until 1 g for the first 6 months. After that, decreased to 500 mg/day for the remaining 6 months (n = 11). | |
| Outcomes | 1. Survival data. | |
| Notes | 1. It involved two centres. | |
| Risk of bias | ||
| Bias | Authors' judgement | Support for judgement |
| Allocation concealment? | Unclear risk | B ‐ Unclear |
PBC: primary biliary cirrhosis
AMA: antimitochondrial antibody
Characteristics of excluded studies [ordered by study ID]
Ir a:
| Study | Reason for exclusion |
| An observational study, examing for three years the serum levels of immune complexes from 88 patient with primary biliary cirrhosis, treated with D‐penicillamine. | |
| Non‐randomised clinical study. | |
| Non‐randomised clinical study. |
Data and analyses
| Outcome or subgroup title | No. of studies | No. of participants | Statistical method | Effect size |
| 1 Mortality (expressed as relative risk) ‐ fixed effect model Show forest plot | 6 | 628 | Risk Ratio (M‐H, Fixed, 95% CI) | 1.34 [1.09, 1.64] |
| Analysis 1.1  Comparison 1 D‐penicillamine versus placebo/no intervention, Outcome 1 Mortality (expressed as relative risk) ‐ fixed effect model. | ||||
| 2 Mortality (expressed as relative risk) ‐ random effects model Show forest plot | 6 | 628 | Risk Ratio (M‐H, Random, 95% CI) | 1.46 [0.85, 2.50] |
| Analysis 1.2  Comparison 1 D‐penicillamine versus placebo/no intervention, Outcome 2 Mortality (expressed as relative risk) ‐ random effects model. | ||||
| 3 Subgroups of methodological quality ‐ generation of allocation sequence ‐ mortality Show forest plot | 6 | Risk Ratio (M‐H, Fixed, 95% CI) | Subtotals only | |
| Analysis 1.3  Comparison 1 D‐penicillamine versus placebo/no intervention, Outcome 3 Subgroups of methodological quality ‐ generation of allocation sequence ‐ mortality. | ||||
| 3.1 Adequate generation of allocation sequence | 1 | 227 | Risk Ratio (M‐H, Fixed, 95% CI) | 1.00 [0.73, 1.38] |
| 3.2 Unclear or inadequate generation of allocation sequence | 5 | 401 | Risk Ratio (M‐H, Fixed, 95% CI) | 1.60 [1.23, 2.08] |
| 4 Subgroups of methodological quality ‐ allocation concealment ‐ mortality Show forest plot | 6 | 628 | Risk Ratio (M‐H, Fixed, 95% CI) | 1.34 [1.09, 1.64] |
| Analysis 1.4  Comparison 1 D‐penicillamine versus placebo/no intervention, Outcome 4 Subgroups of methodological quality ‐ allocation concealment ‐ mortality. | ||||
| 4.1 Adequate allocation concealment | 2 | 279 | Risk Ratio (M‐H, Fixed, 95% CI) | 1.27 [0.94, 1.72] |
| 4.2 Unclear or inadequate allocation concealment | 4 | 349 | Risk Ratio (M‐H, Fixed, 95% CI) | 1.40 [1.06, 1.84] |
| 5 Subgroups of methodological quality ‐ blinding ‐ mortality Show forest plot | 6 | 628 | Risk Ratio (M‐H, Fixed, 95% CI) | 1.34 [1.09, 1.64] |
| Analysis 1.5  Comparison 1 D‐penicillamine versus placebo/no intervention, Outcome 5 Subgroups of methodological quality ‐ blinding ‐ mortality. | ||||
| 5.1 Adequate blinding | 4 | 401 | Risk Ratio (M‐H, Fixed, 95% CI) | 1.07 [0.83, 1.39] |
| 5.2 Unclear or blinding not performed | 2 | 227 | Risk Ratio (M‐H, Fixed, 95% CI) | 1.93 [1.38, 2.72] |
| 6 Subgroups of methodological quality ‐ follow‐up ‐ mortality Show forest plot | 6 | 628 | Risk Ratio (M‐H, Fixed, 95% CI) | 1.34 [1.09, 1.64] |
| Analysis 1.6  Comparison 1 D‐penicillamine versus placebo/no intervention, Outcome 6 Subgroups of methodological quality ‐ follow‐up ‐ mortality. | ||||
| 6.1 Adequate follow‐up | 5 | 530 | Risk Ratio (M‐H, Fixed, 95% CI) | 1.50 [1.20, 1.87] |
| 6.2 Unclear or inadequate follow‐up | 1 | 98 | Risk Ratio (M‐H, Fixed, 95% CI) | 0.68 [0.40, 1.17] |
| 7 Subgroups of dosage ‐ mortality Show forest plot | 6 | Risk Ratio (M‐H, Fixed, 95% CI) | Subtotals only | |
| Analysis 1.7  Comparison 1 D‐penicillamine versus placebo/no intervention, Outcome 7 Subgroups of dosage ‐ mortality. | ||||
| 7.1 D‐penicillamine 1.2 g/day | 1 | 189 | Risk Ratio (M‐H, Fixed, 95% CI) | 1.70 [1.19, 2.41] |
| 7.2 D‐penicillamine 1 g/day | 4 | 341 | Risk Ratio (M‐H, Fixed, 95% CI) | 1.38 [1.04, 1.84] |
| 7.3 D‐penicillamine 0.6 g/day | 1 | 98 | Risk Ratio (M‐H, Fixed, 95% CI) | 0.68 [0.40, 1.17] |
| 8 Subgroups of treatment and follow‐up duration ‐ mortality Show forest plot | 6 | 628 | Risk Ratio (M‐H, Fixed, 95% CI) | 1.34 [1.09, 1.64] |
| Analysis 1.8  Comparison 1 D‐penicillamine versus placebo/no intervention, Outcome 8 Subgroups of treatment and follow‐up duration ‐ mortality. | ||||
| 8.1 Long‐term treatment and long‐term follow‐up | 3 | 514 | Risk Ratio (M‐H, Fixed, 95% CI) | 1.15 [0.93, 1.43] |
| 8.2 Short‐term treatment and short‐term follow‐up | 3 | 114 | Risk Ratio (M‐H, Fixed, 95% CI) | 3.37 [1.70, 6.66] |
| 9 Subgroups of PBC histological stage ‐ mortality Show forest plot | 2 | Risk Ratio (M‐H, Fixed, 95% CI) | Subtotals only | |
| Analysis 1.9  Comparison 1 D‐penicillamine versus placebo/no intervention, Outcome 9 Subgroups of PBC histological stage ‐ mortality. | ||||
| 9.1 PBC stage III or IV | 2 | 287 | Risk Ratio (M‐H, Fixed, 95% CI) | 0.85 [0.63, 1.15] |
| 9.2 PBC stage I or II | 1 | 27 | Risk Ratio (M‐H, Fixed, 95% CI) | 0.0 [0.0, 0.0] |
| 10 Sensitivity analyses ‐ mortality Show forest plot | 6 | Risk Ratio (M‐H, Fixed, 95% CI) | Subtotals only | |
| Analysis 1.10  Comparison 1 D‐penicillamine versus placebo/no intervention, Outcome 10 Sensitivity analyses ‐ mortality. | ||||
| 10.1 Available patient course analysis | 6 | 525 | Risk Ratio (M‐H, Fixed, 95% CI) | 1.08 [0.82, 1.43] |
| 10.2 Assuming poor outcome | 6 | 628 | Risk Ratio (M‐H, Fixed, 95% CI) | 1.34 [1.09, 1.64] |
| 10.3 Assuming good outcome | 6 | 628 | Risk Ratio (M‐H, Fixed, 95% CI) | 0.95 [0.71, 1.26] |
| 10.4 Extreme case favouring D‐penicillamine | 6 | 628 | Risk Ratio (M‐H, Fixed, 95% CI) | 0.66 [0.51, 0.86] |
| 10.5 Extreme case favouring control | 6 | 628 | Risk Ratio (M‐H, Fixed, 95% CI) | 1.92 [1.51, 2.43] |
| 11 Mortality or liver transplantation ‐ fixed effect model Show forest plot | 6 | 628 | Risk Ratio (M‐H, Fixed, 95% CI) | 1.33 [1.09, 1.63] |
| Analysis 1.11  Comparison 1 D‐penicillamine versus placebo/no intervention, Outcome 11 Mortality or liver transplantation ‐ fixed effect model. | ||||
| 12 Mortality or liver transplantation ‐ random effects model Show forest plot | 6 | 628 | Risk Ratio (M‐H, Random, 95% CI) | 1.45 [0.85, 2.48] |
| Analysis 1.12  Comparison 1 D‐penicillamine versus placebo/no intervention, Outcome 12 Mortality or liver transplantation ‐ random effects model. | ||||
| 13 Patients without improvement of pruritus Show forest plot | 1 | 189 | Risk Ratio (M‐H, Fixed, 95% CI) | 0.57 [0.33, 0.99] |
| Analysis 1.13  Comparison 1 D‐penicillamine versus placebo/no intervention, Outcome 13 Patients without improvement of pruritus. | ||||
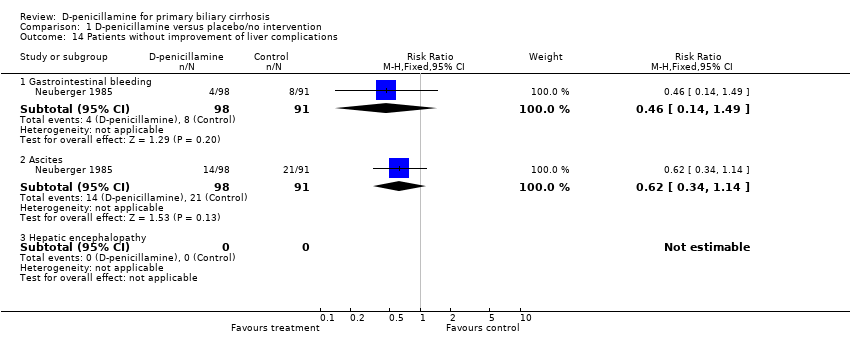
| 14 Patients without improvement of liver complications Show forest plot | 1 | Risk Ratio (M‐H, Fixed, 95% CI) | Subtotals only | |
| Analysis 1.14  Comparison 1 D‐penicillamine versus placebo/no intervention, Outcome 14 Patients without improvement of liver complications. | ||||
| 14.1 Gastrointestinal bleeding | 1 | 189 | Risk Ratio (M‐H, Fixed, 95% CI) | 0.46 [0.14, 1.49] |
| 14.2 Ascites | 1 | 189 | Risk Ratio (M‐H, Fixed, 95% CI) | 0.62 [0.34, 1.14] |
| 14.3 Hepatic encephalopathy | 0 | 0 | Risk Ratio (M‐H, Fixed, 95% CI) | 0.0 [0.0, 0.0] |
| 15 Liver histology Show forest plot | 3 | Risk Ratio (M‐H, Fixed, 95% CI) | Subtotals only | |
| Analysis 1.15  Comparison 1 D‐penicillamine versus placebo/no intervention, Outcome 15 Liver histology. | ||||
| 15.1 Progression of liver histological stage | 3 | 149 | Risk Ratio (M‐H, Fixed, 95% CI) | 0.96 [0.58, 1.58] |
| 15.2 Worsening of histological inflammatory activity | 1 | 87 | Risk Ratio (M‐H, Fixed, 95% CI) | 0.50 [0.26, 0.94] |
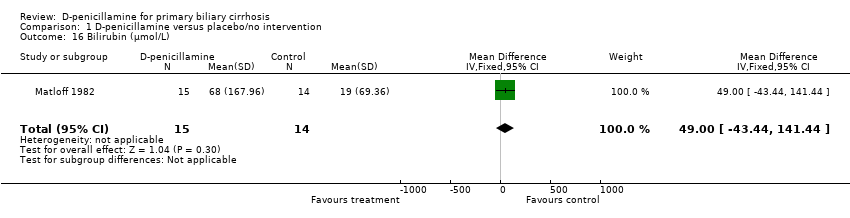
| 16 Bilirubin (µmol/L) Show forest plot | 1 | 29 | Mean Difference (IV, Fixed, 95% CI) | 49.0 [‐43.44, 141.44] |
| Analysis 1.16  Comparison 1 D‐penicillamine versus placebo/no intervention, Outcome 16 Bilirubin (µmol/L). | ||||
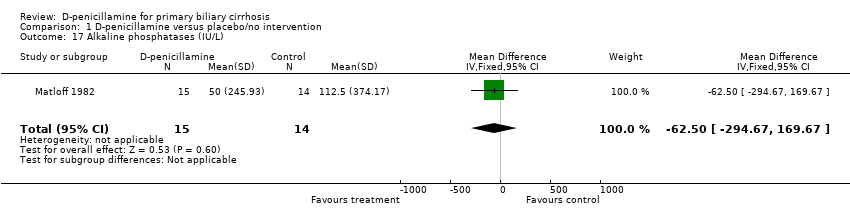
| 17 Alkaline phosphatases (IU/L) Show forest plot | 1 | 29 | Mean Difference (IV, Fixed, 95% CI) | ‐62.50 [‐294.67, 169.67] |
| Analysis 1.17  Comparison 1 D‐penicillamine versus placebo/no intervention, Outcome 17 Alkaline phosphatases (IU/L). | ||||
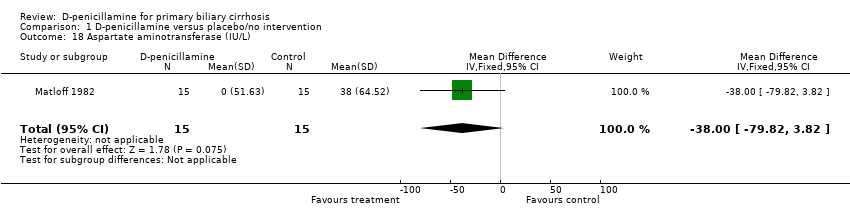
| 18 Aspartate aminotransferase (IU/L) Show forest plot | 1 | 30 | Mean Difference (IV, Fixed, 95% CI) | ‐38.0 [‐79.82, 3.82] |
| Analysis 1.18  Comparison 1 D‐penicillamine versus placebo/no intervention, Outcome 18 Aspartate aminotransferase (IU/L). | ||||
| 19 Alanine aminotransferase (IU/L) Show forest plot | 1 | 22 | Mean Difference (IV, Fixed, 95% CI) | ‐45.0 [‐75.11, ‐14.89] |
| Analysis 1.19  Comparison 1 D‐penicillamine versus placebo/no intervention, Outcome 19 Alanine aminotransferase (IU/L). | ||||
| 20 Albumin (g/dL) Show forest plot | 1 | 29 | Mean Difference (IV, Fixed, 95% CI) | ‐0.5 [‐1.04, 0.04] |
| Analysis 1.20  Comparison 1 D‐penicillamine versus placebo/no intervention, Outcome 20 Albumin (g/dL). | ||||
| 21 Adverse event ‐ fixed effect model Show forest plot | 6 | 617 | Risk Ratio (M‐H, Fixed, 95% CI) | 3.08 [2.31, 4.11] |
| Analysis 1.21  Comparison 1 D‐penicillamine versus placebo/no intervention, Outcome 21 Adverse event ‐ fixed effect model. | ||||
| 22 Adverse event ‐ random effects model Show forest plot | 6 | 617 | Risk Ratio (M‐H, Random, 95% CI) | 3.98 [1.43, 11.04] |
| Analysis 1.22  Comparison 1 D‐penicillamine versus placebo/no intervention, Outcome 22 Adverse event ‐ random effects model. | ||||
| 23 Adverse event ‐ excluding Taal 1983 trial Show forest plot | 5 | 593 | Risk Ratio (M‐H, Fixed, 95% CI) | 3.69 [2.62, 5.19] |
| Analysis 1.23  Comparison 1 D‐penicillamine versus placebo/no intervention, Outcome 23 Adverse event ‐ excluding Taal 1983 trial. | ||||
| Outcome or subgroup title | No. of studies | No. of participants | Statistical method | Effect size |
| 1 Mortality Show forest plot | 1 | 41 | Risk Ratio (M‐H, Fixed, 95% CI) | 0.26 [0.06, 1.05] |
| Analysis 2.1  Comparison 2 High‐dose D‐penicillamine versus low‐dose D‐penicillamine, Outcome 1 Mortality. | ||||
| 2 Patients without improvement of liver histological progression Show forest plot | 1 | 34 | Risk Ratio (M‐H, Fixed, 95% CI) | 0.63 [0.31, 1.29] |
| Analysis 2.2  Comparison 2 High‐dose D‐penicillamine versus low‐dose D‐penicillamine, Outcome 2 Patients without improvement of liver histological progression. | ||||
| 3 Adverse event Show forest plot | 1 | 40 | Risk Ratio (M‐H, Fixed, 95% CI) | 1.99 [0.81, 4.89] |
| Analysis 2.3  Comparison 2 High‐dose D‐penicillamine versus low‐dose D‐penicillamine, Outcome 3 Adverse event. | ||||

Comparison 1 D‐penicillamine versus placebo/no intervention, Outcome 1 Mortality (expressed as relative risk) ‐ fixed effect model.

Comparison 1 D‐penicillamine versus placebo/no intervention, Outcome 2 Mortality (expressed as relative risk) ‐ random effects model.

Comparison 1 D‐penicillamine versus placebo/no intervention, Outcome 3 Subgroups of methodological quality ‐ generation of allocation sequence ‐ mortality.

Comparison 1 D‐penicillamine versus placebo/no intervention, Outcome 4 Subgroups of methodological quality ‐ allocation concealment ‐ mortality.
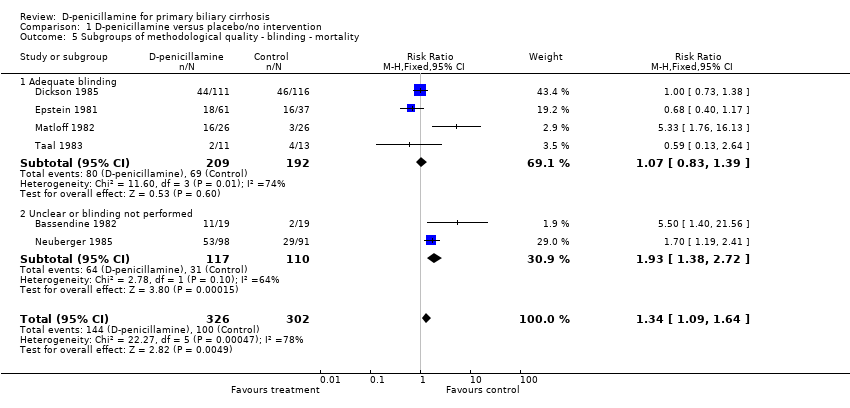
Comparison 1 D‐penicillamine versus placebo/no intervention, Outcome 5 Subgroups of methodological quality ‐ blinding ‐ mortality.
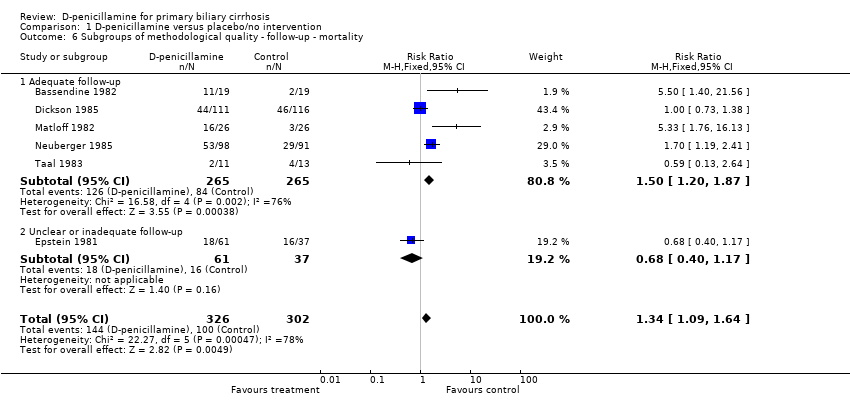
Comparison 1 D‐penicillamine versus placebo/no intervention, Outcome 6 Subgroups of methodological quality ‐ follow‐up ‐ mortality.
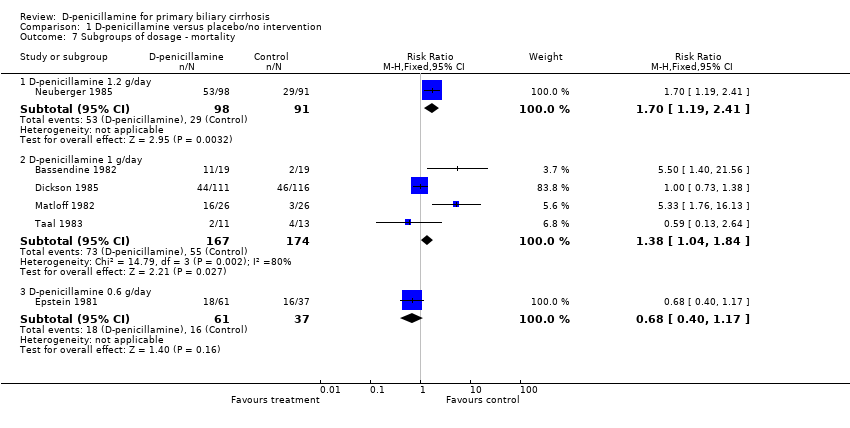
Comparison 1 D‐penicillamine versus placebo/no intervention, Outcome 7 Subgroups of dosage ‐ mortality.

Comparison 1 D‐penicillamine versus placebo/no intervention, Outcome 8 Subgroups of treatment and follow‐up duration ‐ mortality.

Comparison 1 D‐penicillamine versus placebo/no intervention, Outcome 9 Subgroups of PBC histological stage ‐ mortality.

Comparison 1 D‐penicillamine versus placebo/no intervention, Outcome 10 Sensitivity analyses ‐ mortality.
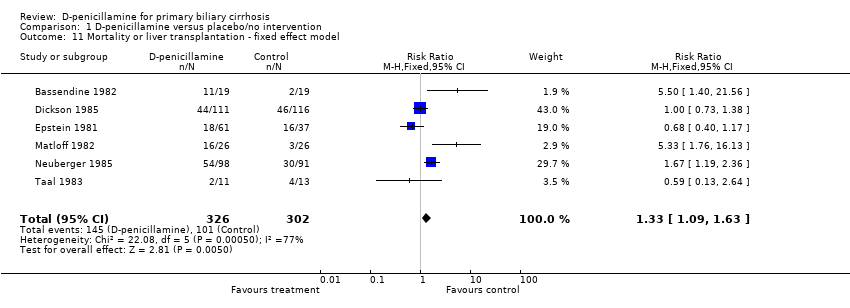
Comparison 1 D‐penicillamine versus placebo/no intervention, Outcome 11 Mortality or liver transplantation ‐ fixed effect model.

Comparison 1 D‐penicillamine versus placebo/no intervention, Outcome 12 Mortality or liver transplantation ‐ random effects model.

Comparison 1 D‐penicillamine versus placebo/no intervention, Outcome 13 Patients without improvement of pruritus.
Comparison 1 D‐penicillamine versus placebo/no intervention, Outcome 14 Patients without improvement of liver complications.

Comparison 1 D‐penicillamine versus placebo/no intervention, Outcome 15 Liver histology.
Comparison 1 D‐penicillamine versus placebo/no intervention, Outcome 16 Bilirubin (µmol/L).
Comparison 1 D‐penicillamine versus placebo/no intervention, Outcome 17 Alkaline phosphatases (IU/L).
Comparison 1 D‐penicillamine versus placebo/no intervention, Outcome 18 Aspartate aminotransferase (IU/L).

Comparison 1 D‐penicillamine versus placebo/no intervention, Outcome 19 Alanine aminotransferase (IU/L).
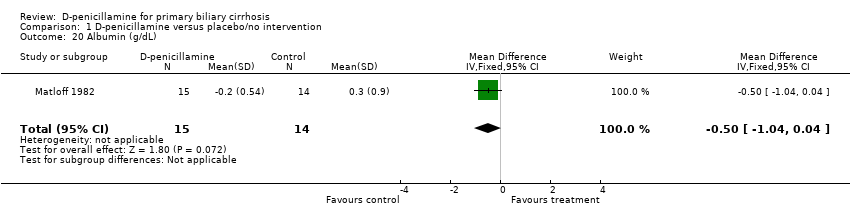
Comparison 1 D‐penicillamine versus placebo/no intervention, Outcome 20 Albumin (g/dL).
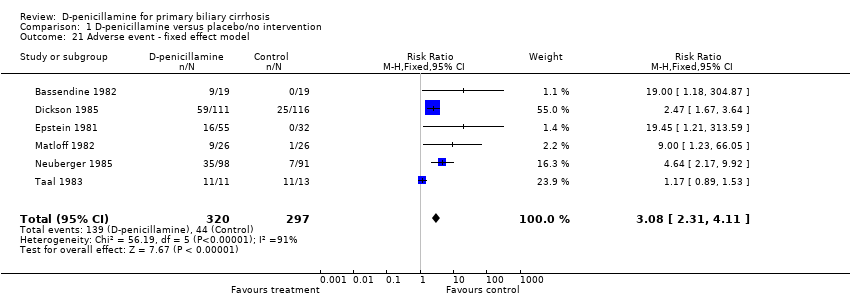
Comparison 1 D‐penicillamine versus placebo/no intervention, Outcome 21 Adverse event ‐ fixed effect model.

Comparison 1 D‐penicillamine versus placebo/no intervention, Outcome 22 Adverse event ‐ random effects model.
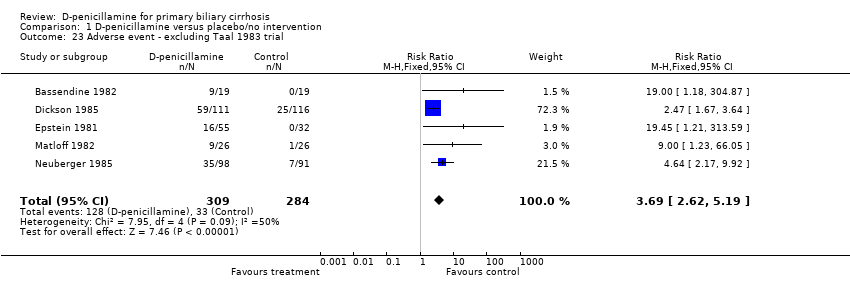
Comparison 1 D‐penicillamine versus placebo/no intervention, Outcome 23 Adverse event ‐ excluding Taal 1983 trial.
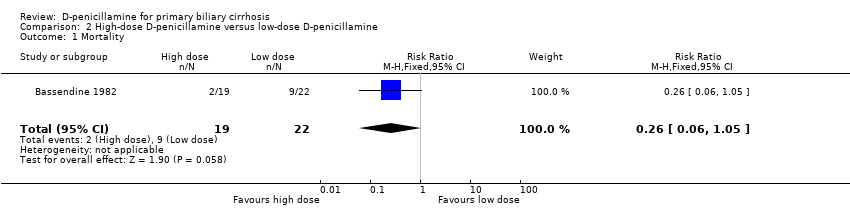
Comparison 2 High‐dose D‐penicillamine versus low‐dose D‐penicillamine, Outcome 1 Mortality.
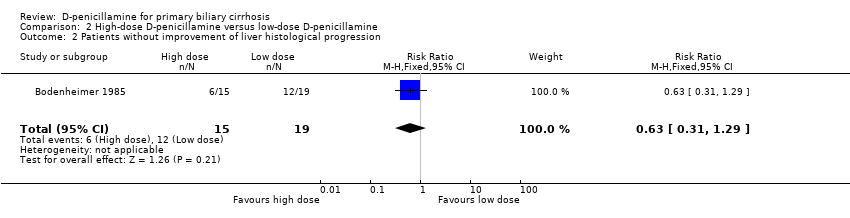
Comparison 2 High‐dose D‐penicillamine versus low‐dose D‐penicillamine, Outcome 2 Patients without improvement of liver histological progression.
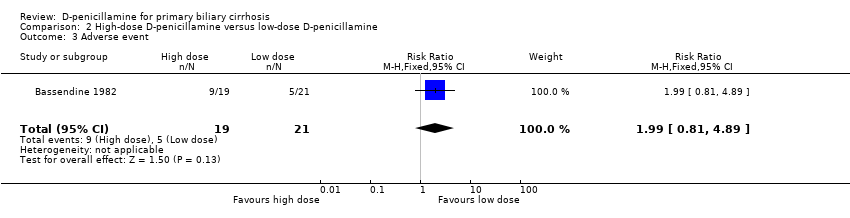
Comparison 2 High‐dose D‐penicillamine versus low‐dose D‐penicillamine, Outcome 3 Adverse event.
| Trials | D‐penicillamine | Control |
| Proteinuria, rash, 'lupus' syndrome, myasthenia, thrombocytopenia. | None. | |
| Hypersensitivity, cytopenia, arthralgias, linchen planus, loss of taste, proteinuria. | Cytopenia, arthralgias, linchen planus, dysgeusia, proteinuria. | |
| Rashes, proteinuria, neutropenia. | None. | |
| Goodpasture‐like syndrome, myasthenia, proteinuria, linchen planus, arthralgias, splenomegaly, rash, loss of taste, stomatitis. | Proteinuria. | |
| Rash, proteinuria, thrombocytopenia, arthralgia, gastrointestinal upset, leucopenia, asthma, pemphigoid, loss of taste, psychosis, palpitations, non‐compliance. | Proteinuria, gastrointestinal upset, headaches, non‐compliance, neurological complications. | |
| Exanthema, gastrointestinal upset, loss of taste. | Exanthema, gastrointestinal upset. | |
| In 750 mg/day (high‐dose) group: Fever, rash, arthralgia, loss of taste, mouth ulcers, nausea, haemolysis, thrombocytopenia, neutropenia, pulmonary fibrosis, albuminuria, neuropathy. In 250 mg/day (low‐dose) group: Fever, rash, arthralgia, loss of taste, mouth ulcers, thrombocytopenia, neutropenia, pulmonary fibrosis, albuminuria, neuropathy. |
| Outcome or subgroup title | No. of studies | No. of participants | Statistical method | Effect size |
| 1 Mortality (expressed as relative risk) ‐ fixed effect model Show forest plot | 6 | 628 | Risk Ratio (M‐H, Fixed, 95% CI) | 1.34 [1.09, 1.64] |
| 2 Mortality (expressed as relative risk) ‐ random effects model Show forest plot | 6 | 628 | Risk Ratio (M‐H, Random, 95% CI) | 1.46 [0.85, 2.50] |
| 3 Subgroups of methodological quality ‐ generation of allocation sequence ‐ mortality Show forest plot | 6 | Risk Ratio (M‐H, Fixed, 95% CI) | Subtotals only | |
| 3.1 Adequate generation of allocation sequence | 1 | 227 | Risk Ratio (M‐H, Fixed, 95% CI) | 1.00 [0.73, 1.38] |
| 3.2 Unclear or inadequate generation of allocation sequence | 5 | 401 | Risk Ratio (M‐H, Fixed, 95% CI) | 1.60 [1.23, 2.08] |
| 4 Subgroups of methodological quality ‐ allocation concealment ‐ mortality Show forest plot | 6 | 628 | Risk Ratio (M‐H, Fixed, 95% CI) | 1.34 [1.09, 1.64] |
| 4.1 Adequate allocation concealment | 2 | 279 | Risk Ratio (M‐H, Fixed, 95% CI) | 1.27 [0.94, 1.72] |
| 4.2 Unclear or inadequate allocation concealment | 4 | 349 | Risk Ratio (M‐H, Fixed, 95% CI) | 1.40 [1.06, 1.84] |
| 5 Subgroups of methodological quality ‐ blinding ‐ mortality Show forest plot | 6 | 628 | Risk Ratio (M‐H, Fixed, 95% CI) | 1.34 [1.09, 1.64] |
| 5.1 Adequate blinding | 4 | 401 | Risk Ratio (M‐H, Fixed, 95% CI) | 1.07 [0.83, 1.39] |
| 5.2 Unclear or blinding not performed | 2 | 227 | Risk Ratio (M‐H, Fixed, 95% CI) | 1.93 [1.38, 2.72] |
| 6 Subgroups of methodological quality ‐ follow‐up ‐ mortality Show forest plot | 6 | 628 | Risk Ratio (M‐H, Fixed, 95% CI) | 1.34 [1.09, 1.64] |
| 6.1 Adequate follow‐up | 5 | 530 | Risk Ratio (M‐H, Fixed, 95% CI) | 1.50 [1.20, 1.87] |
| 6.2 Unclear or inadequate follow‐up | 1 | 98 | Risk Ratio (M‐H, Fixed, 95% CI) | 0.68 [0.40, 1.17] |
| 7 Subgroups of dosage ‐ mortality Show forest plot | 6 | Risk Ratio (M‐H, Fixed, 95% CI) | Subtotals only | |
| 7.1 D‐penicillamine 1.2 g/day | 1 | 189 | Risk Ratio (M‐H, Fixed, 95% CI) | 1.70 [1.19, 2.41] |
| 7.2 D‐penicillamine 1 g/day | 4 | 341 | Risk Ratio (M‐H, Fixed, 95% CI) | 1.38 [1.04, 1.84] |
| 7.3 D‐penicillamine 0.6 g/day | 1 | 98 | Risk Ratio (M‐H, Fixed, 95% CI) | 0.68 [0.40, 1.17] |
| 8 Subgroups of treatment and follow‐up duration ‐ mortality Show forest plot | 6 | 628 | Risk Ratio (M‐H, Fixed, 95% CI) | 1.34 [1.09, 1.64] |
| 8.1 Long‐term treatment and long‐term follow‐up | 3 | 514 | Risk Ratio (M‐H, Fixed, 95% CI) | 1.15 [0.93, 1.43] |
| 8.2 Short‐term treatment and short‐term follow‐up | 3 | 114 | Risk Ratio (M‐H, Fixed, 95% CI) | 3.37 [1.70, 6.66] |
| 9 Subgroups of PBC histological stage ‐ mortality Show forest plot | 2 | Risk Ratio (M‐H, Fixed, 95% CI) | Subtotals only | |
| 9.1 PBC stage III or IV | 2 | 287 | Risk Ratio (M‐H, Fixed, 95% CI) | 0.85 [0.63, 1.15] |
| 9.2 PBC stage I or II | 1 | 27 | Risk Ratio (M‐H, Fixed, 95% CI) | 0.0 [0.0, 0.0] |
| 10 Sensitivity analyses ‐ mortality Show forest plot | 6 | Risk Ratio (M‐H, Fixed, 95% CI) | Subtotals only | |
| 10.1 Available patient course analysis | 6 | 525 | Risk Ratio (M‐H, Fixed, 95% CI) | 1.08 [0.82, 1.43] |
| 10.2 Assuming poor outcome | 6 | 628 | Risk Ratio (M‐H, Fixed, 95% CI) | 1.34 [1.09, 1.64] |
| 10.3 Assuming good outcome | 6 | 628 | Risk Ratio (M‐H, Fixed, 95% CI) | 0.95 [0.71, 1.26] |
| 10.4 Extreme case favouring D‐penicillamine | 6 | 628 | Risk Ratio (M‐H, Fixed, 95% CI) | 0.66 [0.51, 0.86] |
| 10.5 Extreme case favouring control | 6 | 628 | Risk Ratio (M‐H, Fixed, 95% CI) | 1.92 [1.51, 2.43] |
| 11 Mortality or liver transplantation ‐ fixed effect model Show forest plot | 6 | 628 | Risk Ratio (M‐H, Fixed, 95% CI) | 1.33 [1.09, 1.63] |
| 12 Mortality or liver transplantation ‐ random effects model Show forest plot | 6 | 628 | Risk Ratio (M‐H, Random, 95% CI) | 1.45 [0.85, 2.48] |
| 13 Patients without improvement of pruritus Show forest plot | 1 | 189 | Risk Ratio (M‐H, Fixed, 95% CI) | 0.57 [0.33, 0.99] |
| 14 Patients without improvement of liver complications Show forest plot | 1 | Risk Ratio (M‐H, Fixed, 95% CI) | Subtotals only | |
| 14.1 Gastrointestinal bleeding | 1 | 189 | Risk Ratio (M‐H, Fixed, 95% CI) | 0.46 [0.14, 1.49] |
| 14.2 Ascites | 1 | 189 | Risk Ratio (M‐H, Fixed, 95% CI) | 0.62 [0.34, 1.14] |
| 14.3 Hepatic encephalopathy | 0 | 0 | Risk Ratio (M‐H, Fixed, 95% CI) | 0.0 [0.0, 0.0] |
| 15 Liver histology Show forest plot | 3 | Risk Ratio (M‐H, Fixed, 95% CI) | Subtotals only | |
| 15.1 Progression of liver histological stage | 3 | 149 | Risk Ratio (M‐H, Fixed, 95% CI) | 0.96 [0.58, 1.58] |
| 15.2 Worsening of histological inflammatory activity | 1 | 87 | Risk Ratio (M‐H, Fixed, 95% CI) | 0.50 [0.26, 0.94] |
| 16 Bilirubin (µmol/L) Show forest plot | 1 | 29 | Mean Difference (IV, Fixed, 95% CI) | 49.0 [‐43.44, 141.44] |
| 17 Alkaline phosphatases (IU/L) Show forest plot | 1 | 29 | Mean Difference (IV, Fixed, 95% CI) | ‐62.50 [‐294.67, 169.67] |
| 18 Aspartate aminotransferase (IU/L) Show forest plot | 1 | 30 | Mean Difference (IV, Fixed, 95% CI) | ‐38.0 [‐79.82, 3.82] |
| 19 Alanine aminotransferase (IU/L) Show forest plot | 1 | 22 | Mean Difference (IV, Fixed, 95% CI) | ‐45.0 [‐75.11, ‐14.89] |
| 20 Albumin (g/dL) Show forest plot | 1 | 29 | Mean Difference (IV, Fixed, 95% CI) | ‐0.5 [‐1.04, 0.04] |
| 21 Adverse event ‐ fixed effect model Show forest plot | 6 | 617 | Risk Ratio (M‐H, Fixed, 95% CI) | 3.08 [2.31, 4.11] |
| 22 Adverse event ‐ random effects model Show forest plot | 6 | 617 | Risk Ratio (M‐H, Random, 95% CI) | 3.98 [1.43, 11.04] |
| 23 Adverse event ‐ excluding Taal 1983 trial Show forest plot | 5 | 593 | Risk Ratio (M‐H, Fixed, 95% CI) | 3.69 [2.62, 5.19] |
| Outcome or subgroup title | No. of studies | No. of participants | Statistical method | Effect size |
| 1 Mortality Show forest plot | 1 | 41 | Risk Ratio (M‐H, Fixed, 95% CI) | 0.26 [0.06, 1.05] |
| 2 Patients without improvement of liver histological progression Show forest plot | 1 | 34 | Risk Ratio (M‐H, Fixed, 95% CI) | 0.63 [0.31, 1.29] |
| 3 Adverse event Show forest plot | 1 | 40 | Risk Ratio (M‐H, Fixed, 95% CI) | 1.99 [0.81, 4.89] |