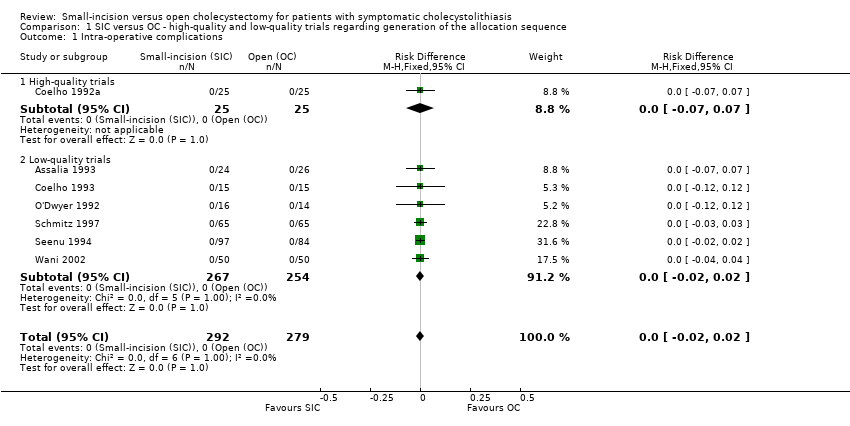
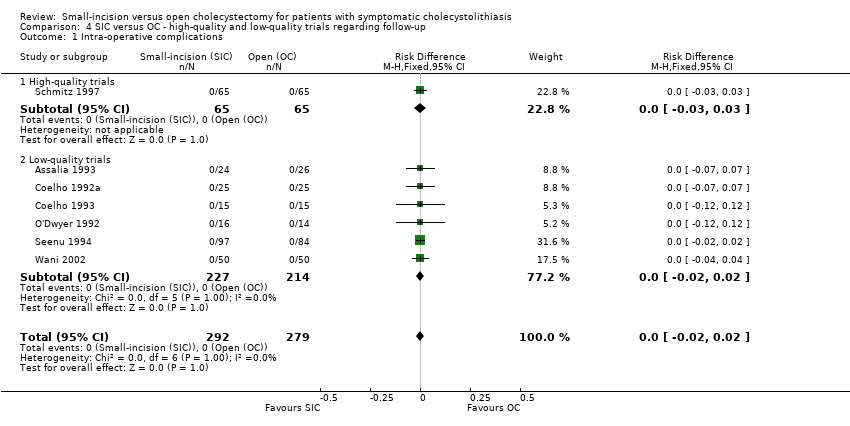
| 1 Intra‐operative complications Show forest plot | 7 | 571 | Risk Difference (M‐H, Fixed, 95% CI) | 0.0 [‐0.02, 0.02] |
|
| 1.1 High‐quality trials | 1 | 50 | Risk Difference (M‐H, Fixed, 95% CI) | 0.0 [‐0.07, 0.07] |
| 1.2 Low‐quality trials | 6 | 521 | Risk Difference (M‐H, Fixed, 95% CI) | 0.0 [‐0.02, 0.02] |
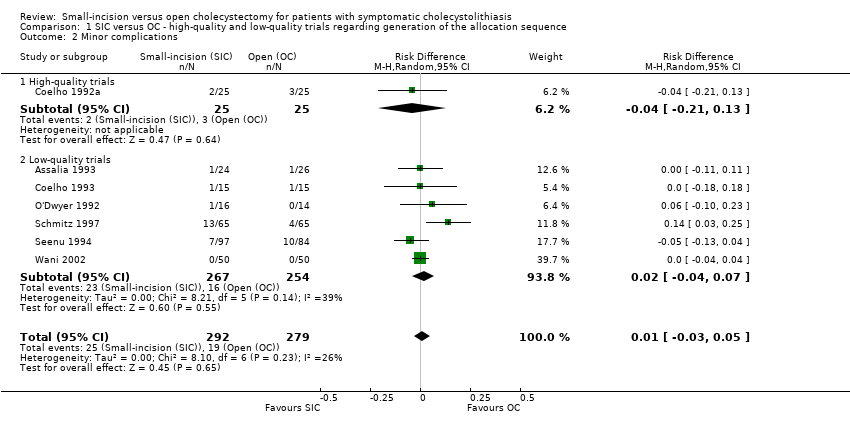
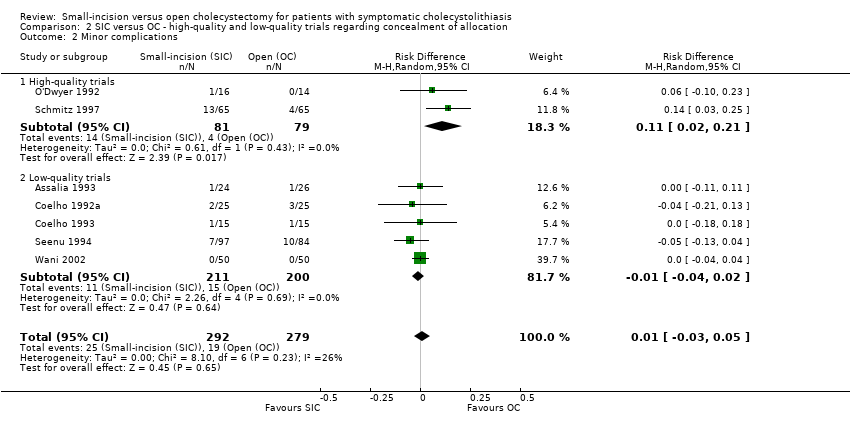
| 2 Minor complications Show forest plot | 7 | 571 | Risk Difference (M‐H, Random, 95% CI) | 0.01 [‐0.03, 0.05] |
|
| 2.1 High‐quality trials | 1 | 50 | Risk Difference (M‐H, Random, 95% CI) | ‐0.04 [‐0.21, 0.13] |
| 2.2 Low‐quality trials | 6 | 521 | Risk Difference (M‐H, Random, 95% CI) | 0.02 [‐0.04, 0.07] |
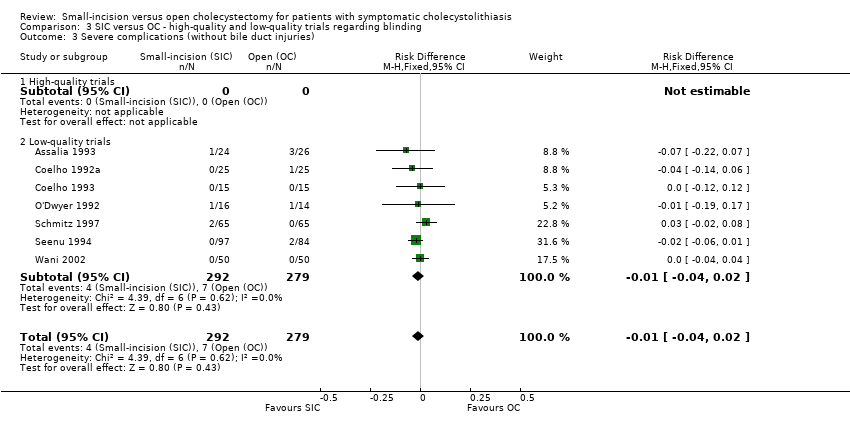
| 3 Severe complications (without bile duct injuries) Show forest plot | 7 | 571 | Risk Difference (M‐H, Fixed, 95% CI) | ‐0.01 [‐0.04, 0.02] |
|
| 3.1 High‐quality trials | 1 | 50 | Risk Difference (M‐H, Fixed, 95% CI) | ‐0.04 [‐0.14, 0.06] |
| 3.2 Low‐quality trials | 6 | 521 | Risk Difference (M‐H, Fixed, 95% CI) | ‐0.01 [‐0.04, 0.02] |
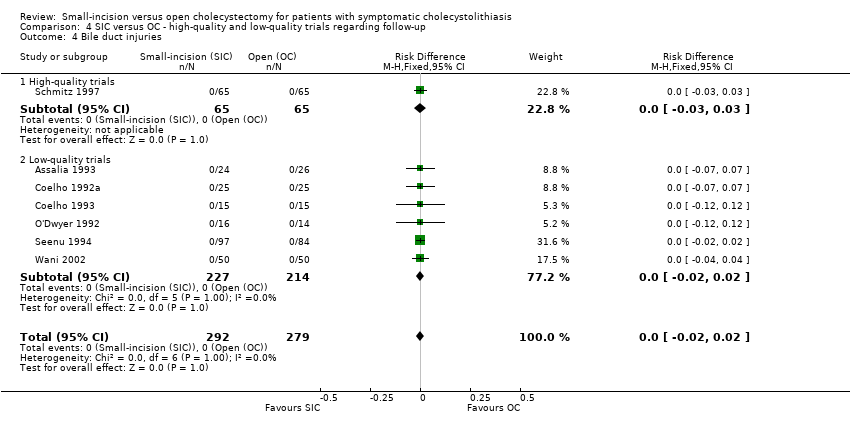
| 4 Bile duct injuries Show forest plot | 7 | 571 | Risk Difference (M‐H, Fixed, 95% CI) | 0.0 [‐0.02, 0.02] |
|
| 4.1 High‐quality trials | 1 | 50 | Risk Difference (M‐H, Fixed, 95% CI) | 0.0 [‐0.07, 0.07] |
| 4.2 Low‐quality trials | 6 | 521 | Risk Difference (M‐H, Fixed, 95% CI) | 0.0 [‐0.02, 0.02] |
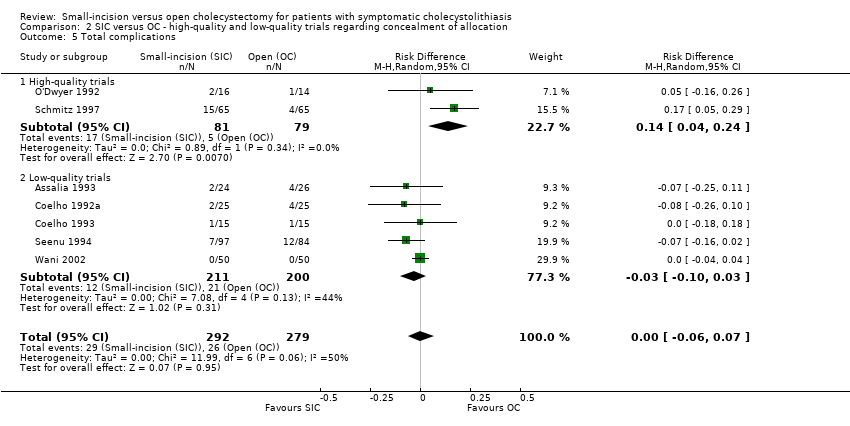
| 5 Total complications Show forest plot | 7 | 571 | Risk Difference (M‐H, Random, 95% CI) | 0.00 [‐0.06, 0.07] |
|
| 5.1 High‐quality trials | 1 | 50 | Risk Difference (M‐H, Random, 95% CI) | ‐0.08 [‐0.26, 0.10] |
| 5.2 Low‐quality trials | 6 | 521 | Risk Difference (M‐H, Random, 95% CI) | 0.01 [‐0.06, 0.08] |
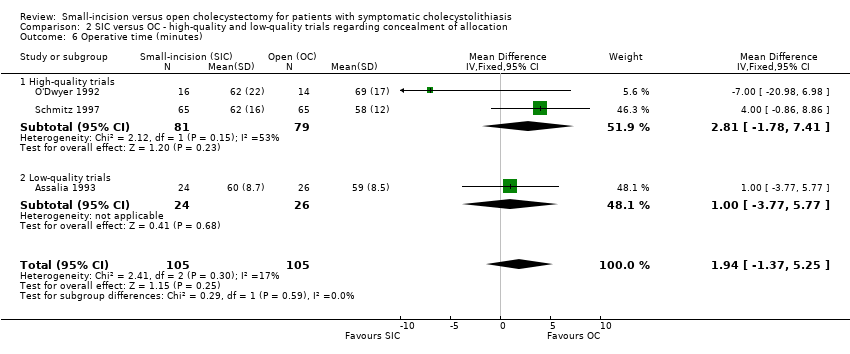
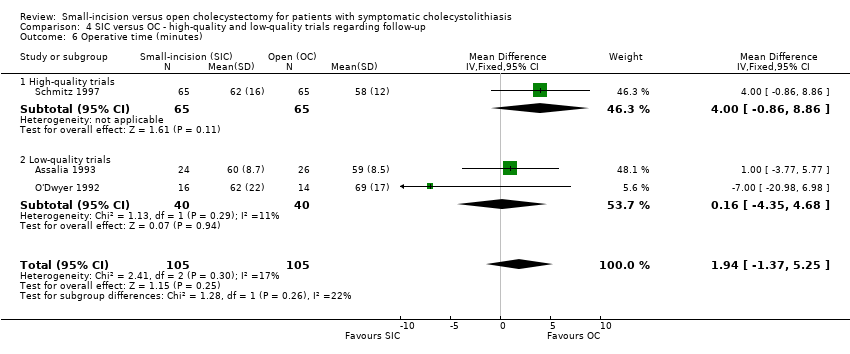
| 6 Operative time (minutes) Show forest plot | 3 | 210 | Mean Difference (IV, Fixed, 95% CI) | 1.94 [‐1.37, 5.25] |
|
| 6.1 High‐quality trials | 0 | 0 | Mean Difference (IV, Fixed, 95% CI) | 0.0 [0.0, 0.0] |
| 6.2 Low‐quality trials | 3 | 210 | Mean Difference (IV, Fixed, 95% CI) | 1.94 [‐1.37, 5.25] |
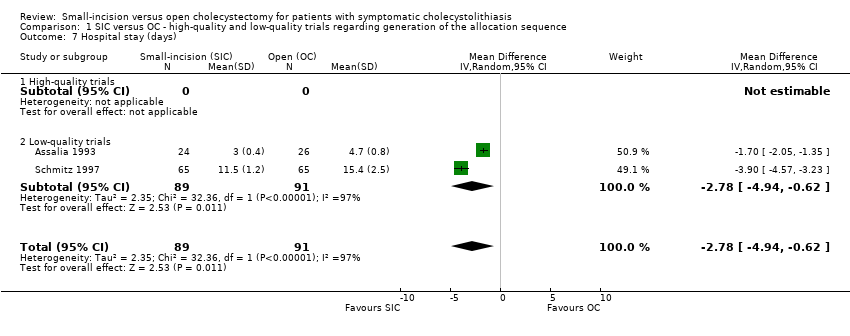
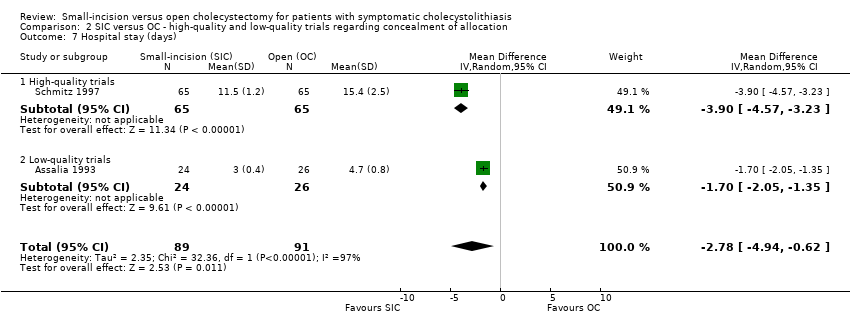
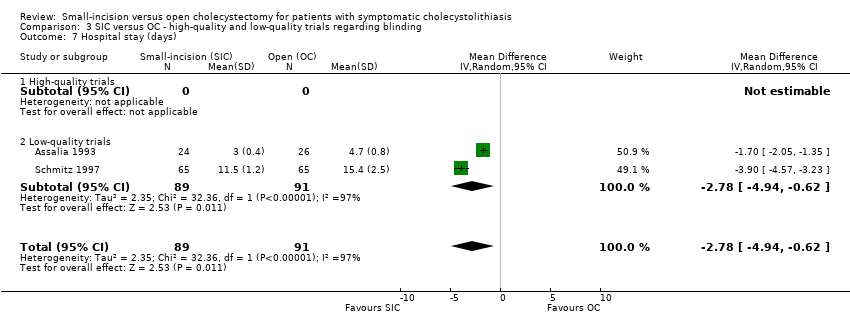
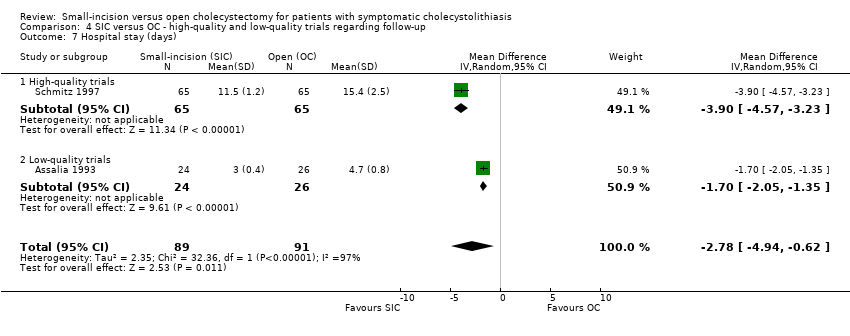
| 7 Hospital stay (days) Show forest plot | 2 | 180 | Mean Difference (IV, Random, 95% CI) | ‐2.78 [‐4.94, ‐0.62] |
|
| 7.1 High‐quality trials | 0 | 0 | Mean Difference (IV, Random, 95% CI) | 0.0 [0.0, 0.0] |
| 7.2 Low‐quality trials | 2 | 180 | Mean Difference (IV, Random, 95% CI) | ‐2.78 [‐4.94, ‐0.62] |