Reparación laparoscópica para la úlcera péptica perforada
Appendices
Appendix 1. MEDLINE search strategy
-
randomized controlled trial [pt]
-
controlled clinical trial [pt]
-
randomized Field: Title/Abstract
-
placebo Field: Title/Abstract
-
randomly Field: Title/Abstract
-
trial Field: Title/Abstract
-
groups Field: Title/Abstract
-
1 OR 2 OR 3 OR 4 OR 4 OR 5 OR 6 OR 7
-
Limits: Humans
-
8 AND 9
-
("Peptic Ulcer"[Mesh] OR "Peptic Ulcer Perforation"[Mesh] OR "Peptic Ulcer Hemorrhage"[Mesh])
-
duoden* NEAR ulcer*
-
stomach* NEAR ulcer*
-
bleed* NEAR ulcer*
-
rebleed* NEAR ulcer*
-
gastrointestinal NEAR bleed*
-
gastrointestinal NEAR rebleed*
-
gastrointestinal NEAR hemorrhag*
-
gastrointestinal NEAR haemorrhag*
-
ulcer NEAR haemorrhag*
-
ulcer NEAR hemorrhag*
-
ulcer NEAR perforat*
-
11 OR 12 OR 13 OR 14 OR 15 OR 16 OR 17 OR 18 OR 19 OR 20 OR 21 OR 22
-
laparoscop*
-
"Laparoscopy"[Mesh]
-
24 OR 25
-
23 AND 26
-
10 AND 27
-
28 Limits: Publication Date from 2004 to 2009
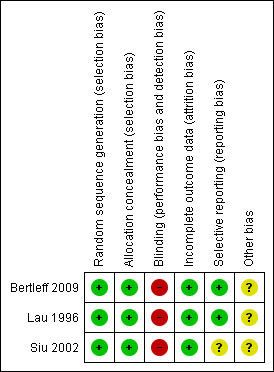
Methodological quality summary: review authors' judgements about each methodological quality item for each included study.

Risk of bias graph: review authors' judgements about each risk of bias item presented as percentages across all included studies.
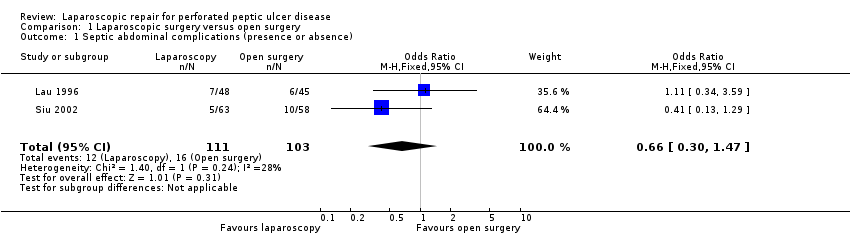
Comparison 1 Laparoscopic surgery versus open surgery, Outcome 1 Septic abdominal complications (presence or absence).

Comparison 1 Laparoscopic surgery versus open surgery, Outcome 2 Pulmonary complications (presence or absence).
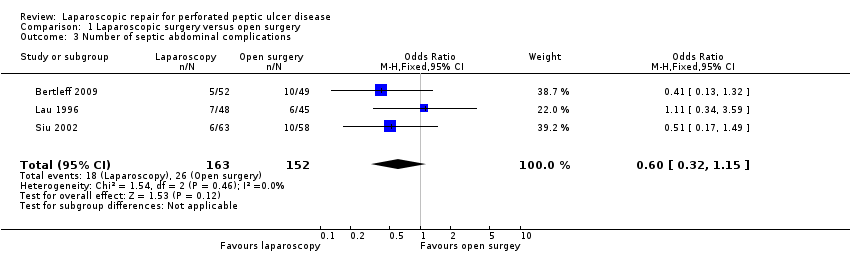
Comparison 1 Laparoscopic surgery versus open surgery, Outcome 3 Number of septic abdominal complications.

Comparison 1 Laparoscopic surgery versus open surgery, Outcome 4 Surgical site infection.

Comparison 1 Laparoscopic surgery versus open surgery, Outcome 5 Suture dehiscence.
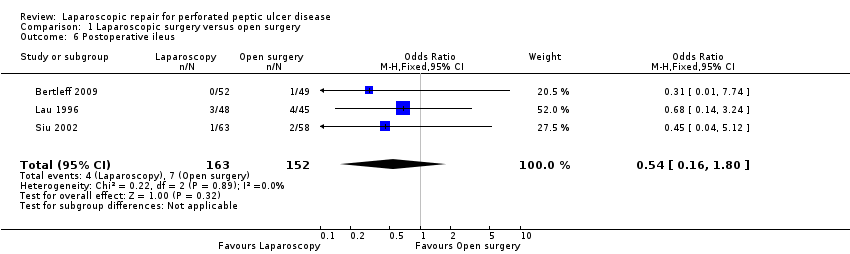
Comparison 1 Laparoscopic surgery versus open surgery, Outcome 6 Postoperative ileus.
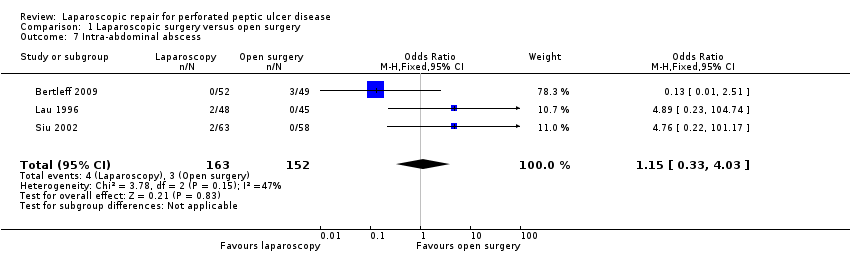
Comparison 1 Laparoscopic surgery versus open surgery, Outcome 7 Intra‐abdominal abscess.
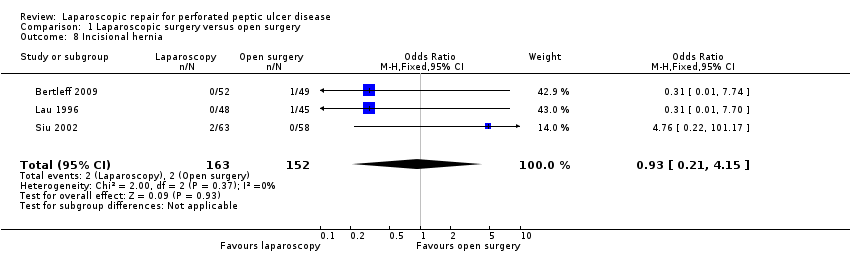
Comparison 1 Laparoscopic surgery versus open surgery, Outcome 8 Incisional hernia.
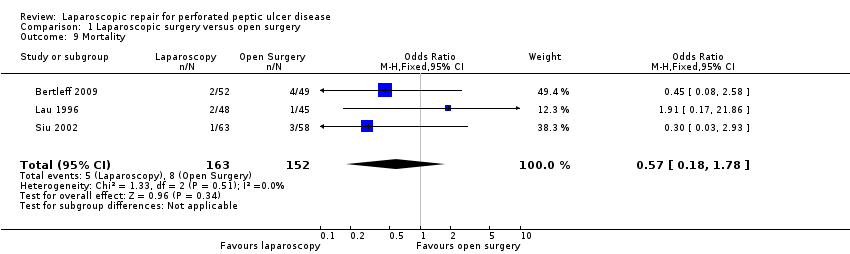
Comparison 1 Laparoscopic surgery versus open surgery, Outcome 9 Mortality.

Comparison 1 Laparoscopic surgery versus open surgery, Outcome 10 Number of reoperations.

Comparison 1 Laparoscopic surgery versus open surgery, Outcome 11 Operative time.
| Laparoscopic surgery versus open surgery for perforated peptic ulcer disease | ||||||
| Patient or population: patients with perforated peptic ulcer disease | ||||||
| Outcomes | Illustrative comparative risks* (95% CI) | Relative effect | No of Participants | Quality of the evidence | Comments | |
| Assumed risk | Corresponding risk | |||||
| Control | Laparoscopic surgery versus open surgery | |||||
| Septic abdominal complications (presence or absence) | 155 per 1000 | 108 per 1000 | OR 0.66 | 214 | ⊕⊕⊝⊝ | |
| Pulmonary complications (presence or absence) | 86 per 1000 | 46 per 1000 | OR 0.52 | 315 | ⊕⊕⊝⊝ | |
| Surgical site infection | 72 per 1000 | 21 per 1000 | OR 0.28 | 315 | ⊕⊕⊕⊝ | |
| Suture dehiscence | 13 per 1000 | 20 per 1000 | OR 1.52 | 315 | ⊕⊕⊝⊝ | |
| Postoperative ileus | Study population | OR 0.54 | 315 | ⊕⊕⊝⊝ | ||
| 46 per 1000 | 25 per 1000 | |||||
| Moderate | ||||||
| 35 per 1000 | 19 per 1000 | |||||
| Intra‐abdominal abscess | 20 per 1000 | 23 per 1000 | OR 1.15 | 315 | ⊕⊝⊝⊝ | |
| Operative time | The mean operative time in the control groups was | The mean operative time in the intervention groups was | 214 | ⊕⊝⊝⊝ | ||
| *The basis for the assumed risk (e.g. the median control group risk across studies) is provided in footnotes. The corresponding risk (and its 95% confidence interval) is based on the assumed risk in the comparison group and the relative effect of the intervention (and its 95% CI). | ||||||
| GRADE Working Group grades of evidence | ||||||
| 1 Imprecision is probably because the small sample size of the studies and the lack of reporting form the largest one. | ||||||
| Variable | Study | Laparoscopic group | Open surgery group | P value |
| Nasogastric aspiration time (median and range) | 2 (3.0) IQR | 3 (1.3) IQR | 0.33 | |
| 3 (2‐33) | 3(1‐8) | 0.28 | ||
| 2 (1‐4)/ 3 (2‐1) | 2 (1‐13)/ 3(1‐17) | No significant (P value not reported) | ||
| Time to return to oral diet | 4 (3‐35) | 5 (3‐24) | 0.06 | |
| 4 (3‐7)/ 4 (2‐11) | 4 (3‐16)/ 4 (3‐19) | No significant (P value not reported) | ||
| Length of stay | 6.5 (9.3) IQR | 8 (7.3) IQR | 0.23 | |
| 6 (4‐35) | 7 (4‐39) | 0.004 | ||
| 5 (3‐20)/ 6 (3‐11) | 5 (3‐19)/ 5 (2‐21) | No significant (P value not reported) | ||
| Analgesic doses | 0 (0‐11) | 6 (1‐30) | <0.001 | |
| 1 (0‐12)/ 2 (0‐17) | 3 (0‐10)/ 4 (1‐9) | 0.03 | ||
| 1 (1.25) median days of analgesics | 1 (1.0) median days of analgesics | 0.007 |
| Outcome or subgroup title | No. of studies | No. of participants | Statistical method | Effect size |
| 1 Septic abdominal complications (presence or absence) Show forest plot | 2 | 214 | Odds Ratio (M‐H, Fixed, 95% CI) | 0.66 [0.30, 1.47] |
| 2 Pulmonary complications (presence or absence) Show forest plot | 3 | 315 | Odds Ratio (M‐H, Random, 95% CI) | 0.52 [0.08, 3.55] |
| 3 Number of septic abdominal complications Show forest plot | 3 | 315 | Odds Ratio (M‐H, Fixed, 95% CI) | 0.60 [0.32, 1.15] |
| 4 Surgical site infection Show forest plot | 3 | 315 | Odds Ratio (M‐H, Random, 95% CI) | 0.28 [0.08, 1.00] |
| 5 Suture dehiscence Show forest plot | 3 | 315 | Odds Ratio (M‐H, Random, 95% CI) | 1.52 [0.29, 7.98] |
| 6 Postoperative ileus Show forest plot | 3 | 315 | Odds Ratio (M‐H, Fixed, 95% CI) | 0.54 [0.16, 1.80] |
| 7 Intra‐abdominal abscess Show forest plot | 3 | 315 | Odds Ratio (M‐H, Fixed, 95% CI) | 1.15 [0.33, 4.03] |
| 8 Incisional hernia Show forest plot | 3 | 315 | Odds Ratio (M‐H, Fixed, 95% CI) | 0.93 [0.21, 4.15] |
| 9 Mortality Show forest plot | 3 | 315 | Odds Ratio (M‐H, Fixed, 95% CI) | 0.57 [0.18, 1.78] |
| 10 Number of reoperations Show forest plot | 2 | 214 | Odds Ratio (M‐H, Fixed, 95% CI) | 1.89 [0.46, 7.71] |
| 11 Operative time Show forest plot | 2 | 214 | Mean Difference (IV, Random, 95% CI) | 14.62 [‐35.25, 64.49] |