Intervenciones para el molusco contagioso cutáneo
Información
- DOI:
- https://doi.org/10.1002/14651858.CD004767.pub4Copiar DOI

- Base de datos:
-
- Cochrane Database of Systematic Reviews
- Versión publicada:
-
- 17 mayo 2017see what's new
- Tipo:
-
- Intervention
- Etapa:
-
- Review
- Grupo Editorial Cochrane:
-
Grupo Cochrane de Piel
- Copyright:
-
- Copyright © 2017 The Cochrane Collaboration. Published by John Wiley & Sons, Ltd.
Cifras del artículo
Altmetric:
Citado por:
Autores
Contributions of authors
JCvdW was the contact person with the editorial base, co‐ordinated contributions from the coauthors, and wrote the final draft of the review.
SK, EJK, RvdS, and JCvdW screened papers against the eligibility criteria.
JCvdW obtained data on ongoing and unpublished studies.
SK, EJK, RvdS, and JCvdW appraised the quality of papers.
SK, EJK, RvdS, and JCvdW extracted data for the review and sought additional information about papers.
JCvdW and EJK entered data into Review Manager 5.
JCvdW and EJK analysed and interpreted data.
JCvdW worked on the Methods section.
All review authors commented on draft versions of this update.
SK drafted the clinical sections of the Background and responded to the clinical comments of the referees.
JCvdW responded to the methodology and statistics comments of the referees.
AS was the consumer coauthor and checked the review for readability and clarity, as well as ensuring outcomes were relevant to consumers.
JCvdW is the guarantor of the update.
Disclaimer
This project was supported by the National Institute for Health Research, via Cochrane Infrastructure funding to the Cochrane Skin Group. The views and opinions expressed therein are those of the authors and do not necessarily reflect those of the Systematic Reviews Programme, NIHR, NHS or the Department of Health.
Sources of support
Internal sources
-
Department of General Practice, Erasmus MC, Rotterdam, Netherlands.
in kind support
-
Department of General Practice and Elderly Care Medicine, VUmc University Medical Center, Amsterdam, Netherlands.
in kind support
External sources
-
The National Institute for Health Research (NIHR), UK.
The NIHR, UK, is the largest single funder of the Cochrane Skin Group.
Declarations of interest
Johannes C van der Wouden: My institution has received money from the following non‐profit sources which have no real or potential vested interest in the findings of this Cochrane review: Editorial Board, Huisarts en Wetenschap (monthly journal of Dutch College of GPs); Advisory Board of Achmea Health Database (health insurance company). The funds did not come from sources that produce any of the drugs that might be included in the review or competitors to the drugs in the review.
Renske van der Sande: nothing to declare.
Emma J Kruithof: nothing to declare.
Annet Sollie: nothing to declare.
Lisette WA van Suijlekom‐Smit: I have received a travel grant from Pfizer (American College of Rheumatology Annual Meeting 2014 Boston).
Sander Koning: nothing to declare.
Acknowledgements
The authors thank Marjolein Berger, Chris Butler, Sanjay Gajadin, Jack Menke, and Marjolein Tasche for their involvement in writing previous versions of our review. The authors would also like to thank Adrie Hollestein, Ken Katz, Daan Muris, Kazutomo Ohkuma, Anthony Ormerod, Jane Sterling, and Hywel Williams for drawing our attention to relevant studies.
Drs. Manchanda, Kazutomo Ohkuma, and Anthony Ormerod kindly provided additional information regarding their studies, and Kate Short and Mohammed Bazza generously sent us their full paper before it was submitted for publication. Derya Uçmak kindly sent us their paper. The editorial base provided help in tracing and translating papers. We also thank Himiko Luiken for translating the unique study on the natural history of molluscum contagiosum (Takemura 1983), and Taixiang Wu for interviewing Dr He on details of her study design (He 2001). We thank Alireza Firooz for assessing the paper Salmanpour 2006, and Susheera Chatpoedprai for providing additional information on their study (Chatproedrai 2007). Clemens van Ede (at that time medical director of Meda Pharma BV, Netherlands) kindly provided the trial reports of the three unpublished 3M studies (Eichenfield 2005; Paller 2005a; Paller 2005b).
For the current update of this review, the Cochrane Skin editorial base wishes to thank Bob Boyle, Cochrane Dermatology Editor for this review; Matthew Grainge, Statistical Editor; Ching‐Chi Chi, Methods Editor; the clinical referees, Paul Martin and Hywel Williams; and the consumer referee, Jack Tweed; as well as Lisa Winer, who copy edited the review.
Version history
| Published | Title | Stage | Authors | Version |
| 2017 May 17 | Interventions for cutaneous molluscum contagiosum | Review | Johannes C van der Wouden, Renske van der Sande, Emma J Kruithof, Annet Sollie, Lisette WA van Suijlekom‐Smit, Sander Koning | |
| 2009 Oct 07 | Interventions for cutaneous molluscum contagiosum | Review | Johannes C van der Wouden, Renske van der Sande, Lisette WA van Suijlekom‐Smit, Marjolein Berger, Christopher C Butler, Sander Koning | |
| 2009 Jul 08 | Interventions for cutaneous molluscum contagiosum | Review | Johannes C van der Wouden, Sander Koning, Lisette WA van Suijlekom‐Smit, Marjolein Berger, Christopher Butler, Jack Menke, Sanjay Gajadin, Marjolein JA Tasche | |
| 2004 Apr 19 | Interventions for molluscum contagiosum in children | Protocol | Johannes C van der Wouden, Sanjay Gajadin, Marjolein Y Berger, Christopher CC Butler, Sander Koning, Jack Menke, Marjolein JA Tasche, A van Suijlekom‐Smit LW, Lisette WA van Suijlekom‐Smit | |
Differences between protocol and review
The title of the published protocol was inadvertently left as 'Interventions for molluscum contagiosum in children', although a decision had been made not to restrict the review to children.
Differences between the protocol and the current update
For differences between other published versions, please see the 'Differences between protocol and review' sections within the original publications.
Objectives: In the protocol, we had planned to assess the effects of treatments, but in this and the previous updates we broadened this to include management strategies because waiting for natural resolution is a recognised option for dealing with molluscum contagiosum. We amended the text from that which was in the protocol to make our objectives more clear.
Types of studies: In the protocol, we said that "studies should compare one or more treatments with another, with placebo, or with no treatment (waiting for natural response)"; we removed this sentence in this and previous updates because it refers to comparisons rather than studies.
Types of interventions: We had planned to include randomised trials of all treatments for molluscum contagiosum, but narrowed this to include only treatments aimed at eradicating molluscum contagiosum lesions, and excluded studies on other aspects of the treatment of molluscum contagiosum, for example on reducing pain in the studies that assessed the effect of using an analgesic EMLA (eutectic mixture of local anaesthetics) cream before the actual intervention took place. This was because the analgesic was not used to eradicate the molluscum lesions.
Primary outcomes: We decided that our original choice for 'short‐term clinical cure' of one month was not realistic, and therefore changed it to three months. We have also clarified our primary outcome to make it more manageable: short‐term clinical cure (up to three months after treatment). (Please see Overall completeness and applicability of evidence for a more detailed description of why we felt the original choice was not realistic.) We also deleted the term 'elevated' in the description, as we felt it was unnecessary and could possibly cause confusion, the implication being that there are elevated and non‐elevated forms of the lesion.
Where included studies used the term 'complete clearance' or 'free of lesions' or 'cured or > 90% cleared', we classed these as our primary outcome 'short‐term clinical cure (up to three months after start of treatment)' or our secondary outcome 'medium‐ and long‐term cure (after three months and up to six months, and after six months, respectively)'. Where studies have referred to 'partial clearance', we took this to mean our secondary outcome 'improvement'.
Secondary outcomes: We did not initially specify the outcome 'disease‐related quality of life' in the protocol, but added it afterwards as we considered it to be a relevant additional measure.
We also added 'short‐, medium‐, and long‐term improvement (including cure, intervals as above)' as a secondary outcome as we considered it to be important. For this outcome we combined 'improvement' and 'cure' (even though cure alone was a seperate outcome) because 'improvement' would be hard to interpret without also including those who were cured. For example: suppose in group A, 30% were cured and another 20% improved. In group B, 40% were cured and 10% improved. Comparing improvement rates between A and B (20% versus 10%) is misleading, whereas combining cure and improvement (50% versus 50%) is not.
Electronic searches: We expanded the number of trial registries that we planned to search when we became aware of the existence of these registries and in line with current Cochrane Skin practices. For similar reasons, we added Google as an additional electronic search strategy.
Selection of studies: If a randomised controlled trial included a variety of skin diseases, of which one was molluscum contagiosum, the number of molluscum participants needed to be at least five in the active treatment and placebo groups in order to reduce the role of extremely small studies. We added this criterion after the protocol was approved when we found a study that included 10 molluscum participants with a 9:1 distribution over the two treatment groups (Caballero 1996). The criterion also applied to Manchanda 1997a.
Selection of studies: If the setting of the study was not explicitly mentioned in the text, we assumed it to be carried out at the affiliation of the first author. Also, if the full text of a study was not available, we considered published abstracts for this update, as we have done this for previous versions of the review.
Assessment of risk of bias in included studies: In this update, we assessed each study using Cochrane's 'Risk of bias' tool (Higgins 2011), as this is now required. Also items (5), (6) and (7), which differed from the original protocol or were absent, were added or amended for the 2009 update as recommended. In previous versions of this review, items (3) and (4) were combined. For the 2016 update we further clarified how we decided what constituted an 'adequate' assessment and therefore low risk of bias.
Measures of treatment effect: Following the recent Cochrane Skin Group recommendations, we decided post hoc to re‐analyse results from individual studies with borderline significance and with low numbers of events (fewer than 10 in total) or a total sample size of less than 30, using Fisher’s exact test. The resulting P value was leading in interpreting the results.
Data synthesis: We had planned to express dichotomous results as odds ratios, but changed this to risk ratios and as a number needed to treat where appropriate because these are easier for most readers to understand. We decided to report numbers needed to treat only for comparisons with more than one study and only in the case of statistically significant differences, the latter because numbers needed to treat for differences that are statistically not significant produce large and uncertain confidence intervals.
When the same comparison between two interventions was made in more than one study, and studies appeared to have been executed in similar groups and settings, we planned to use statistical tests for homogeneity between studies. In those studies where the available data were sufficiently homogenous and where a pooled estimate of the treatment effect made sense, we planned to conduct a meta‐analysis. However, we could not implement these plans in most cases due to lack of data.
Assessment of reporting biases: Subsequent to the protocol, we aimed to assess reporting bias by comparing the published trial publications with the study protocol, but no protocols were available.
Unit of analysis issues: In our methods we planned to use special analytic techniques for paired (split‐body) designs; however, we were unable to do this as the paired data were not available to us.
Dealing with missing data: Although this was not specified in the protocol, we considered participants who dropped out or were lost to follow‐up as treatment failures.
Unit of analysis issues/Assessment of heterogeneity/Sensitivity analysis: We had planned analyses not documented in the protocol, including the use of sensitivity analyses to examine the effects of excluding studies with lower reported methodological quality, as well as how to analyse cross‐over trials and within‐participant designed trials. However, we did not undertake these analyses because of the small number of studies for each comparison.
Sensitivity analysis: We planned to use sensitivity analyses to examine the effects of excluding studies with high risk of bias. However, we did not undertake these analyses because of the small number of studies for each comparison.
Summary of findings: We developed 'Summary of findings' tables subsequent to our protocol. We have produced one for this update.
Quality of evidence: We used GRADE to assess the quality of evidence for each primary outcome and key secondary outcomes.
Keywords
MeSH
Medical Subject Headings (MeSH) Keywords
- Adjuvants, Immunologic [therapeutic use];
- Aminoquinolines [therapeutic use];
- Anti‐Infective Agents, Local [therapeutic use];
- Benzoyl Peroxide [therapeutic use];
- Cimetidine [therapeutic use];
- Hydroxides [therapeutic use];
- Imiquimod;
- Molluscum Contagiosum [drug therapy, *therapy];
- Myrtus;
- Olive Oil [therapeutic use];
- Phytotherapy [methods];
- Plant Oils [therapeutic use];
- Potassium Compounds [therapeutic use];
- Povidone‐Iodine [therapeutic use];
- Randomized Controlled Trials as Topic;
- Remission, Spontaneous;
- Salicylic Acid [therapeutic use];
- Sodium Nitrite [therapeutic use];
Medical Subject Headings Check Words
Humans;
PICO

Flow diagram of inclusion for this update.

Risk of bias table: review authors' judgements about each methodological quality item for each included study.
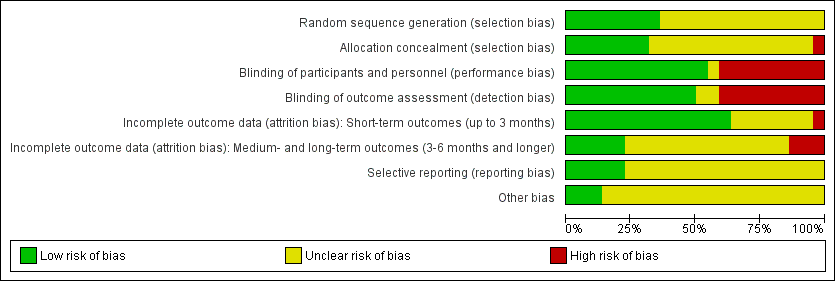
Risk of bias graph: review authors' judgements about each risk of bias item presented as percentages across all included studies.
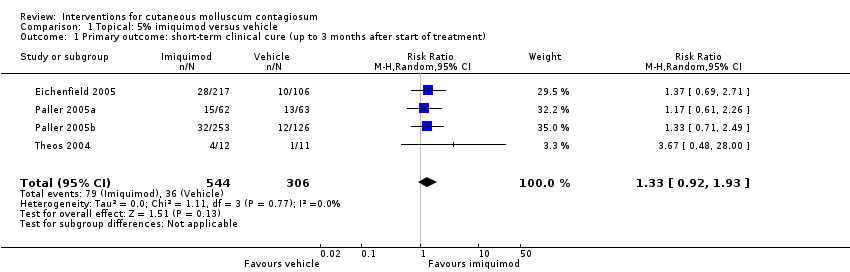
Comparison 1 Topical: 5% imiquimod versus vehicle, Outcome 1 Primary outcome: short‐term clinical cure (up to 3 months after start of treatment).

Comparison 1 Topical: 5% imiquimod versus vehicle, Outcome 2 Secondary outcome: medium‐term clinical cure (after 3 and up to 6 months after start of treatment).
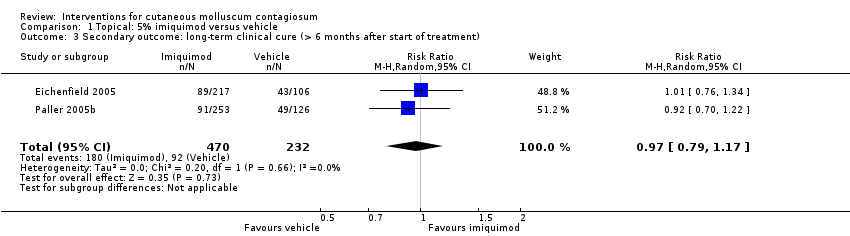
Comparison 1 Topical: 5% imiquimod versus vehicle, Outcome 3 Secondary outcome: long‐term clinical cure (> 6 months after start of treatment).
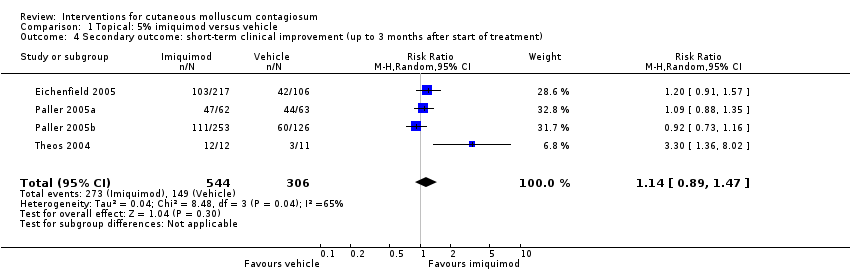
Comparison 1 Topical: 5% imiquimod versus vehicle, Outcome 4 Secondary outcome: short‐term clinical improvement (up to 3 months after start of treatment).
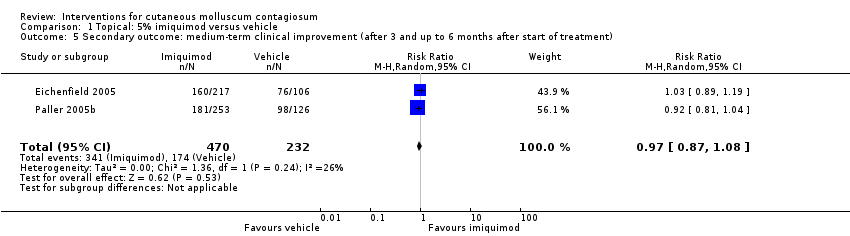
Comparison 1 Topical: 5% imiquimod versus vehicle, Outcome 5 Secondary outcome: medium‐term clinical improvement (after 3 and up to 6 months after start of treatment).
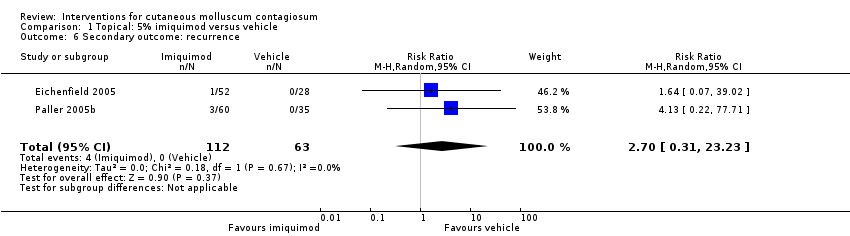
Comparison 1 Topical: 5% imiquimod versus vehicle, Outcome 6 Secondary outcome: recurrence.
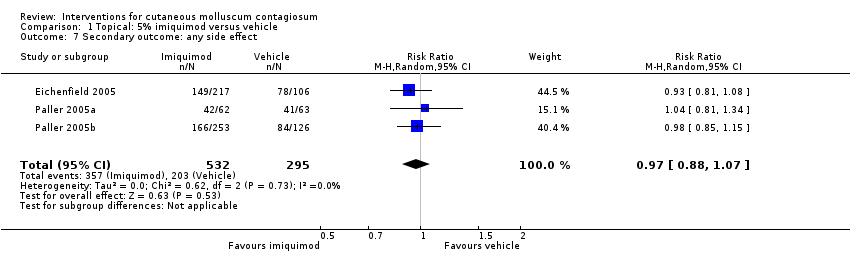
Comparison 1 Topical: 5% imiquimod versus vehicle, Outcome 7 Secondary outcome: any side effect.
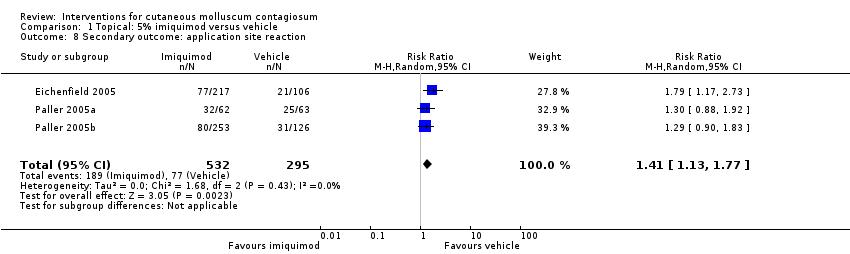
Comparison 1 Topical: 5% imiquimod versus vehicle, Outcome 8 Secondary outcome: application site reaction.

Comparison 1 Topical: 5% imiquimod versus vehicle, Outcome 9 Secondary outcome: severe application site reaction.
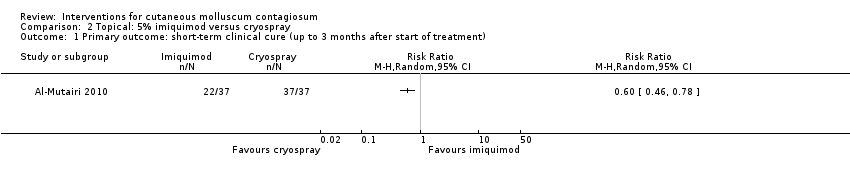
Comparison 2 Topical: 5% imiquimod versus cryospray, Outcome 1 Primary outcome: short‐term clinical cure (up to 3 months after start of treatment).
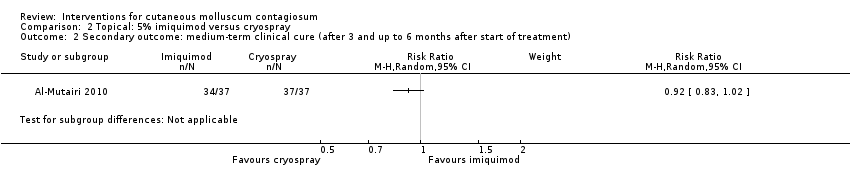
Comparison 2 Topical: 5% imiquimod versus cryospray, Outcome 2 Secondary outcome: medium‐term clinical cure (after 3 and up to 6 months after start of treatment).
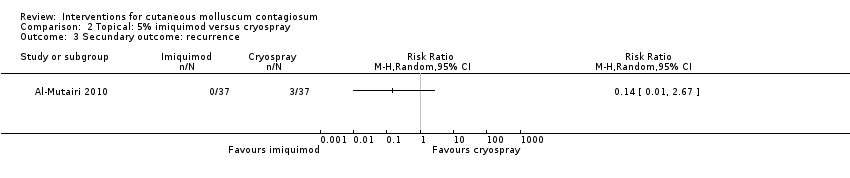
Comparison 2 Topical: 5% imiquimod versus cryospray, Outcome 3 Secundary outcome: recurrence.
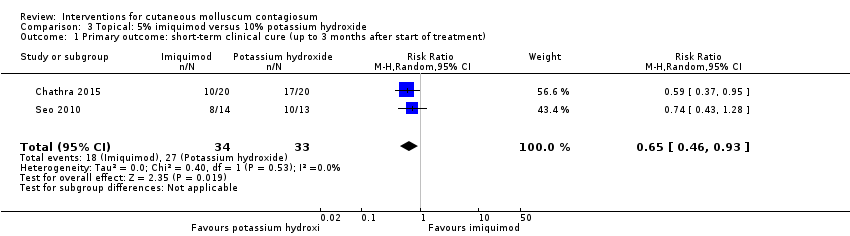
Comparison 3 Topical: 5% imiquimod versus 10% potassium hydroxide, Outcome 1 Primary outcome: short‐term clinical cure (up to 3 months after start of treatment).

Comparison 3 Topical: 5% imiquimod versus 10% potassium hydroxide, Outcome 2 Secondary outcome: any side effect.
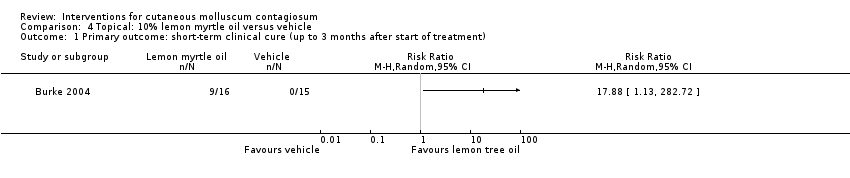
Comparison 4 Topical: 10% lemon myrtle oil versus vehicle, Outcome 1 Primary outcome: short‐term clinical cure (up to 3 months after start of treatment).
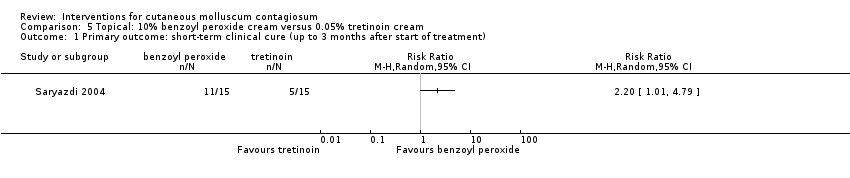
Comparison 5 Topical: 10% benzoyl peroxide cream versus 0.05% tretinoin cream, Outcome 1 Primary outcome: short‐term clinical cure (up to 3 months after start of treatment).
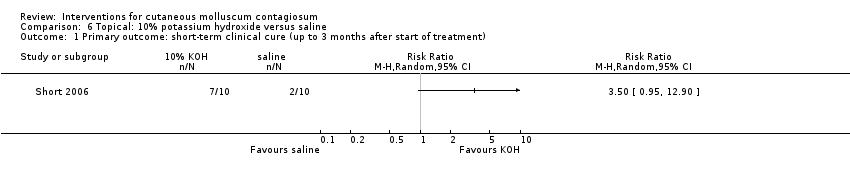
Comparison 6 Topical: 10% potassium hydroxide versus saline, Outcome 1 Primary outcome: short‐term clinical cure (up to 3 months after start of treatment).
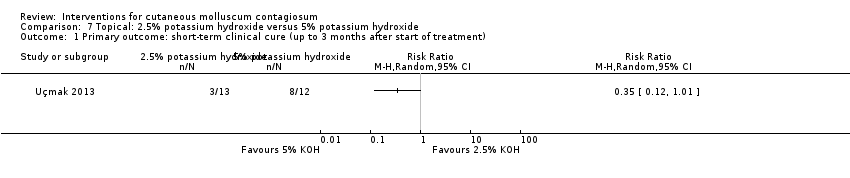
Comparison 7 Topical: 2.5% potassium hydroxide versus 5% potassium hydroxide, Outcome 1 Primary outcome: short‐term clinical cure (up to 3 months after start of treatment).

Comparison 7 Topical: 2.5% potassium hydroxide versus 5% potassium hydroxide, Outcome 2 Secondary outcome: short‐term improvement (up to 3 months after start of treatment).

Comparison 8 Topical: 10% potassium hydroxide versus 14% salicylic acid + 14% lactic acid, Outcome 1 Primary outcome: short‐term clinical cure (up to 3 months after start of treatment).

Comparison 9 Topical: 10% potassium hydroxide versus curettage, Outcome 1 Primary outcome: short‐term clinical cure (up to 3 months after start of treatment).

Comparison 10 Topical 10% potassium hydroxide versus cryotherapy, Outcome 1 Primary outcome: short‐term clinical cure (up to 3 months after start of treatment).

Comparison 10 Topical 10% potassium hydroxide versus cryotherapy, Outcome 2 Secondary outcome: short‐term clinical improvement (up to 3 months after start of treatment).
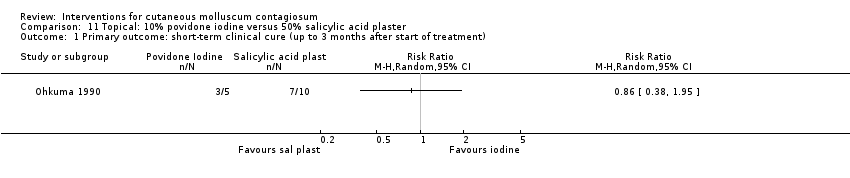
Comparison 11 Topical: 10% povidone iodine versus 50% salicylic acid plaster, Outcome 1 Primary outcome: short‐term clinical cure (up to 3 months after start of treatment).

Comparison 12 Topical: 10% povidone iodine alone versus 10% povidone iodine and 50% salicylic plaster, Outcome 1 Primary outcome: short‐term clinical cure (up to 3 months after start of treatment).

Comparison 13 Topical: 10% povidone iodine and 50% salicylic acid plaster versus 50% salicylic plaster alone, Outcome 1 Primary outcome: short‐term clinical cure (up to 3 months after start of treatment).

Comparison 14 Topical: 0.7% cantharidin versus vehicle, Outcome 1 Primary outcome: short‐term clinical cure (up to 3 months after start of treatment)..

Comparison 15 Topical: 5% sodium nitrite in 5% salicylic acid versus 5% salicylic acid alone, Outcome 1 Primary outcome: short‐term clinical cure (up to 3 months after start of treatment).
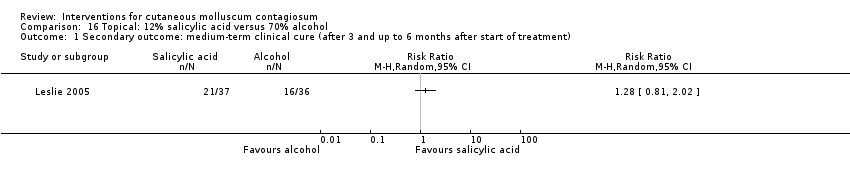
Comparison 16 Topical: 12% salicylic acid versus 70% alcohol, Outcome 1 Secondary outcome: medium‐term clinical cure (after 3 and up to 6 months after start of treatment).
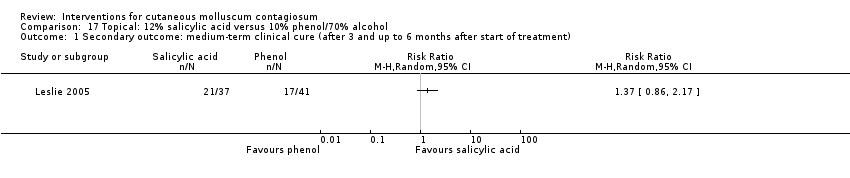
Comparison 17 Topical: 12% salicylic acid versus 10% phenol/70% alcohol, Outcome 1 Secondary outcome: medium‐term clinical cure (after 3 and up to 6 months after start of treatment).

Comparison 18 Topical: 14% salicylic acid + 14% lactic acid versus curettage, Outcome 1 Primary outcome: short‐term clinical cure (up to 3 months after start of treatment).

Comparison 19 Topical: 70% alcohol versus 10% phenol/70% alcohol, Outcome 1 Secondary outcome: medium‐term clinical cure (after 3 and up to 6 months after start of treatment).

Comparison 20 Topical: iodine versus tea tree oil, Outcome 1 Primary outcome: short‐term clinical cure (up to 3 months after start of treatment).
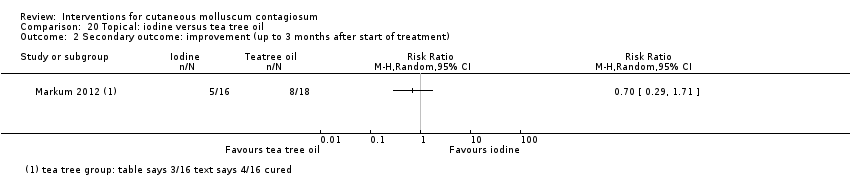
Comparison 20 Topical: iodine versus tea tree oil, Outcome 2 Secondary outcome: improvement (up to 3 months after start of treatment).

Comparison 21 Topical: iodine versus tea tree oil combined with iodine, Outcome 1 Primary outcome: short‐term clinical cure (up to 3 months after start of treatment).

Comparison 21 Topical: iodine versus tea tree oil combined with iodine, Outcome 2 Secondary outcome: improvement (up to 3 months after start of treatment).

Comparison 22 Topical: tea tree oil versus tea tree oil combined with iodine, Outcome 1 Primary outcome: short‐term clinical cure (up to 3 months after start of treatment).

Comparison 22 Topical: tea tree oil versus tea tree oil combined with iodine, Outcome 2 Secondary outcome: improvement (up to 3 months after start of treatment).

Comparison 23 Systemic: cimetidine versus placebo, Outcome 1 Secondary outcome: medium‐term clinical cure (after 3 months and up to 6 months after start of treatment).
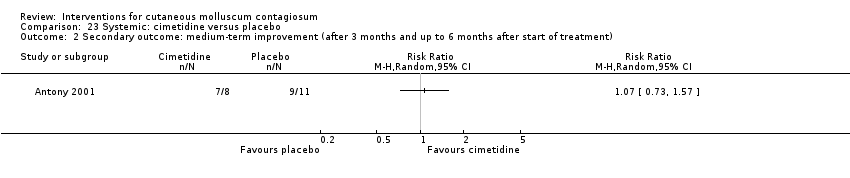
Comparison 23 Systemic: cimetidine versus placebo, Outcome 2 Secondary outcome: medium‐term improvement (after 3 months and up to 6 months after start of treatment).
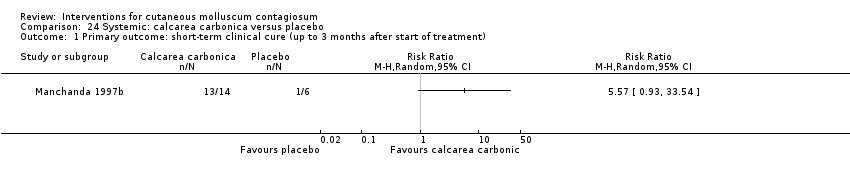
Comparison 24 Systemic: calcarea carbonica versus placebo, Outcome 1 Primary outcome: short‐term clinical cure (up to 3 months after start of treatment).
| Imiquimod versus vehicle for cutaneous molluscum contagiosum | ||||||
| Patient or population: molluscum contagiosum | ||||||
| Outcomes | Anticipated absolute effects* (95% CI) | Relative effect | № of participants | Quality of the evidence | Comments | |
| Risk with topical vehicle | Risk with topical imiquimod | |||||
| Short‐term clinical cure (up to 3 months after start of treatment) (completely cleared short term) | Study population | RR 1.33 | 850 | ⊕⊕⊕○ | Analysis 1.1 | |
| 118 per 1000 | 156 per 1000 | |||||
| Medium‐term clinical cure (after 3 months and up to 6 months after start of treatment) (completely cleared medium term) | Study population | RR 0.88 | 702 | ⊕⊕⊕○ | Analysis 1.2 | |
| 272 per 1000 | 239 per 1000 | |||||
| Long‐term clinical cure (beyond 6 months after start of treatment) (completely cleared long term) | Study population | RR 0.97 | 702 | ⊕⊕⊕○ | Analysis 1.3 | |
| 401 per 1000 | 389 per 1000 | |||||
| Short‐term clinical improvement (up to 3 months after start of treatment) | Study population | RR 1.14 | 850 | ⊕⊕⊕⊕ | Analysis 1.4 | |
| 487 per 1000 | 555 per 1000 | |||||
| Any adverse effect | Study population | RR 0.97 | 827 | ⊕⊕⊕⊕ | Analysis 1.7 | |
| 688 per 1000 | 667 per 1000 | |||||
| Application site reactions | Study population | RR 1.41 | 827 | ⊕⊕⊕○ | Analysis 1.8. This outcome was not prespecified in our protocol. | |
| 261 per 1000 | 368 per 1000 | |||||
| Severe application site reactions | Study population | RR 4.33 | 827 | ⊕⊕⊕○ | Analysis 1.9. This outcome was not prespecified in our protocol. | |
| 7 per 1000 | 29 per 1000 | |||||
| *The risk in the intervention group (and its 95% confidence interval) is based on the assumed risk in the comparison group and the relative effect of the intervention (and its 95% CI). | ||||||
| GRADE Working Group grades of evidence | ||||||
| 1Downgraded by one level due to imprecision (< 300 events). We decided not to downgrade for risk of bias as out of four studies, the largest three were judged to be at low risk of bias. 2Downgraded by one level due to imprecision (< 300 events). We decided not to downgrade for risk of bias as both studies were judged to be at low risk of bias. 3We decided not to downgrade for risk of bias as out of four studies, the largest three were judged to be at low risk of bias. We also decided not to downgrade for inconsistency as removing one outlier eliminated inconsistency but hardly affected pooled estimate. 4We decided not to downgrade for risk of bias as all three studies were judged to be at low risk of bias. 5Downgraded by one level due to imprecision (< 300 events). We decided not to downgrade for risk of bias as all three studies were judged to be at low risk of bias. | ||||||
| Treatment class | Treatment modality | Included studies | Other studies |
| 'Doing nothing' | Awaiting natural resolution | — | |
| Placebo | Antony 2001; Eichenfield 2005; Manchanda 1997b; Paller 2005a; Paller 2005b | — | |
| Surgical treatments | Cryotherapy | ||
| Curettage | |||
| Curettage with punch | — | ||
| Electric cauterisation | — | ||
| Physical expression (squeezing) | — | ||
| Pricking | — | ||
| Pulsed dye laser | — | ||
| Topical treatments | Acidified nitrite | ||
| Adapalene | — | ||
| Australian lemon myrtle oil | — | ||
| Benzoyl peroxide | — | ||
| Bromogeramine | — | ||
| Cantharidin | |||
| Cidofovir | — | ||
| Diphencyprone | — | ||
| Griseofulvin | — | ||
| Honey | — | ||
| Hydrogen peroxide cream | — | ||
| Hyperthermia | — | ||
| Imiquimod | Al‐Mutairi 2010; Eichenfield 2005; Hanna 2006; Paller 2005a; Paller 2005b; Seo 2010; Theos 2004 | Arican 2006; Barba 2001; Bayerl 2003; Hengge 2003; Lim 2003; Liota 2000; Metkar 2008; Skinner 2000; Skinner 2002; Syed 1998 | |
| Iodine | — | ||
| Iodine combined with tea tree oil | — | ||
| Milkweed | — | ||
| Povidone iodine plus salicylic acid | — | ||
| Phenol | |||
| Podophyllotoxin (HIV patients) | — | ||
| Potassium hydroxide | |||
| Retinoic acid | — | ||
| Salicylic acid | — | ||
| Salicylic acid combined with lactic acid | — | ||
| Salicylic acid combined with sodium nitrite | — | ||
| Silver nitrate | — | ||
| Tea tree oil | — | ||
| Tretinoin | — | ||
| Yellow oxide of mercury | — | ||
| Systemic treatments | Cimetidine | ||
| Calcarea carbonica (homeopathy) | |||
| Griseofulvin | — | ||
| Combinations of above | Potassium iodide followed by X‐rays | — |
| Outcome or subgroup title | No. of studies | No. of participants | Statistical method | Effect size |
| 1 Primary outcome: short‐term clinical cure (up to 3 months after start of treatment) Show forest plot | 4 | 850 | Risk Ratio (M‐H, Random, 95% CI) | 1.33 [0.92, 1.93] |
| 2 Secondary outcome: medium‐term clinical cure (after 3 and up to 6 months after start of treatment) Show forest plot | 2 | 702 | Risk Ratio (M‐H, Random, 95% CI) | 0.88 [0.67, 1.14] |
| 3 Secondary outcome: long‐term clinical cure (> 6 months after start of treatment) Show forest plot | 2 | 702 | Risk Ratio (M‐H, Random, 95% CI) | 0.97 [0.79, 1.17] |
| 4 Secondary outcome: short‐term clinical improvement (up to 3 months after start of treatment) Show forest plot | 4 | 850 | Risk Ratio (M‐H, Random, 95% CI) | 1.14 [0.89, 1.47] |
| 5 Secondary outcome: medium‐term clinical improvement (after 3 and up to 6 months after start of treatment) Show forest plot | 2 | 702 | Risk Ratio (M‐H, Random, 95% CI) | 0.97 [0.87, 1.08] |
| 6 Secondary outcome: recurrence Show forest plot | 2 | 175 | Risk Ratio (M‐H, Random, 95% CI) | 2.70 [0.31, 23.23] |
| 7 Secondary outcome: any side effect Show forest plot | 3 | 827 | Risk Ratio (M‐H, Random, 95% CI) | 0.97 [0.88, 1.07] |
| 8 Secondary outcome: application site reaction Show forest plot | 3 | 827 | Risk Ratio (M‐H, Random, 95% CI) | 1.41 [1.13, 1.77] |
| 9 Secondary outcome: severe application site reaction Show forest plot | 3 | 827 | Risk Ratio (M‐H, Random, 95% CI) | 4.33 [1.16, 16.19] |
| Outcome or subgroup title | No. of studies | No. of participants | Statistical method | Effect size |
| 1 Primary outcome: short‐term clinical cure (up to 3 months after start of treatment) Show forest plot | 1 | Risk Ratio (M‐H, Random, 95% CI) | Totals not selected | |
| 2 Secondary outcome: medium‐term clinical cure (after 3 and up to 6 months after start of treatment) Show forest plot | 1 | Risk Ratio (M‐H, Random, 95% CI) | Subtotals only | |
| 3 Secundary outcome: recurrence Show forest plot | 1 | Risk Ratio (M‐H, Random, 95% CI) | Totals not selected | |
| Outcome or subgroup title | No. of studies | No. of participants | Statistical method | Effect size |
| 1 Primary outcome: short‐term clinical cure (up to 3 months after start of treatment) Show forest plot | 2 | 67 | Risk Ratio (M‐H, Random, 95% CI) | 0.65 [0.46, 0.93] |
| 2 Secondary outcome: any side effect Show forest plot | 2 | 67 | Risk Ratio (M‐H, Random, 95% CI) | 0.68 [0.25, 1.81] |
| Outcome or subgroup title | No. of studies | No. of participants | Statistical method | Effect size |
| 1 Primary outcome: short‐term clinical cure (up to 3 months after start of treatment) Show forest plot | 1 | Risk Ratio (M‐H, Random, 95% CI) | Totals not selected | |
| Outcome or subgroup title | No. of studies | No. of participants | Statistical method | Effect size |
| 1 Primary outcome: short‐term clinical cure (up to 3 months after start of treatment) Show forest plot | 1 | Risk Ratio (M‐H, Random, 95% CI) | Totals not selected | |
| Outcome or subgroup title | No. of studies | No. of participants | Statistical method | Effect size |
| 1 Primary outcome: short‐term clinical cure (up to 3 months after start of treatment) Show forest plot | 1 | Risk Ratio (M‐H, Random, 95% CI) | Totals not selected | |
| Outcome or subgroup title | No. of studies | No. of participants | Statistical method | Effect size |
| 1 Primary outcome: short‐term clinical cure (up to 3 months after start of treatment) Show forest plot | 1 | Risk Ratio (M‐H, Random, 95% CI) | Totals not selected | |
| 2 Secondary outcome: short‐term improvement (up to 3 months after start of treatment) Show forest plot | 1 | Risk Ratio (M‐H, Random, 95% CI) | Totals not selected | |
| Outcome or subgroup title | No. of studies | No. of participants | Statistical method | Effect size |
| 1 Primary outcome: short‐term clinical cure (up to 3 months after start of treatment) Show forest plot | 1 | Risk Ratio (M‐H, Random, 95% CI) | Totals not selected | |
| Outcome or subgroup title | No. of studies | No. of participants | Statistical method | Effect size |
| 1 Primary outcome: short‐term clinical cure (up to 3 months after start of treatment) Show forest plot | 1 | Risk Ratio (M‐H, Random, 95% CI) | Totals not selected | |
| Outcome or subgroup title | No. of studies | No. of participants | Statistical method | Effect size |
| 1 Primary outcome: short‐term clinical cure (up to 3 months after start of treatment) Show forest plot | 1 | Risk Ratio (M‐H, Random, 95% CI) | Totals not selected | |
| 2 Secondary outcome: short‐term clinical improvement (up to 3 months after start of treatment) Show forest plot | 1 | Risk Ratio (M‐H, Random, 95% CI) | Totals not selected | |
| Outcome or subgroup title | No. of studies | No. of participants | Statistical method | Effect size |
| 1 Primary outcome: short‐term clinical cure (up to 3 months after start of treatment) Show forest plot | 1 | Risk Ratio (M‐H, Random, 95% CI) | Totals not selected | |
| Outcome or subgroup title | No. of studies | No. of participants | Statistical method | Effect size |
| 1 Primary outcome: short‐term clinical cure (up to 3 months after start of treatment) Show forest plot | 1 | Risk Ratio (M‐H, Random, 95% CI) | Totals not selected | |
| Outcome or subgroup title | No. of studies | No. of participants | Statistical method | Effect size |
| 1 Primary outcome: short‐term clinical cure (up to 3 months after start of treatment) Show forest plot | 1 | Risk Ratio (M‐H, Random, 95% CI) | Totals not selected | |
| Outcome or subgroup title | No. of studies | No. of participants | Statistical method | Effect size |
| 1 Primary outcome: short‐term clinical cure (up to 3 months after start of treatment). Show forest plot | 1 | Risk Ratio (M‐H, Random, 95% CI) | Totals not selected | |
| Outcome or subgroup title | No. of studies | No. of participants | Statistical method | Effect size |
| 1 Primary outcome: short‐term clinical cure (up to 3 months after start of treatment) Show forest plot | 1 | Risk Ratio (M‐H, Random, 95% CI) | Totals not selected | |
| Outcome or subgroup title | No. of studies | No. of participants | Statistical method | Effect size |
| 1 Secondary outcome: medium‐term clinical cure (after 3 and up to 6 months after start of treatment) Show forest plot | 1 | Risk Ratio (M‐H, Random, 95% CI) | Totals not selected | |
| Outcome or subgroup title | No. of studies | No. of participants | Statistical method | Effect size |
| 1 Secondary outcome: medium‐term clinical cure (after 3 and up to 6 months after start of treatment) Show forest plot | 1 | Risk Ratio (M‐H, Random, 95% CI) | Totals not selected | |
| Outcome or subgroup title | No. of studies | No. of participants | Statistical method | Effect size |
| 1 Primary outcome: short‐term clinical cure (up to 3 months after start of treatment) Show forest plot | 1 | Risk Ratio (M‐H, Random, 95% CI) | Totals not selected | |
| Outcome or subgroup title | No. of studies | No. of participants | Statistical method | Effect size |
| 1 Secondary outcome: medium‐term clinical cure (after 3 and up to 6 months after start of treatment) Show forest plot | 1 | Risk Ratio (M‐H, Random, 95% CI) | Totals not selected | |
| Outcome or subgroup title | No. of studies | No. of participants | Statistical method | Effect size |
| 1 Primary outcome: short‐term clinical cure (up to 3 months after start of treatment) Show forest plot | 1 | Risk Ratio (M‐H, Random, 95% CI) | Totals not selected | |
| 2 Secondary outcome: improvement (up to 3 months after start of treatment) Show forest plot | 1 | Risk Ratio (M‐H, Random, 95% CI) | Totals not selected | |
| Outcome or subgroup title | No. of studies | No. of participants | Statistical method | Effect size |
| 1 Secondary outcome: medium‐term clinical cure (after 3 months and up to 6 months after start of treatment) Show forest plot | 1 | Risk Ratio (M‐H, Random, 95% CI) | Totals not selected | |
| 2 Secondary outcome: medium‐term improvement (after 3 months and up to 6 months after start of treatment) Show forest plot | 1 | Risk Ratio (M‐H, Random, 95% CI) | Totals not selected | |
| Outcome or subgroup title | No. of studies | No. of participants | Statistical method | Effect size |
| 1 Primary outcome: short‐term clinical cure (up to 3 months after start of treatment) Show forest plot | 1 | Risk Ratio (M‐H, Random, 95% CI) | Totals not selected | |