Contenido relacionado
Revisiones y protocolos relacionados
Gill Norman, Janice Christie, Zhenmi Liu, Maggie J Westby, Jayne M Jefferies, Thomas Hudson, Jacky Edwards, Devi Prasad Mohapatra, Ibrahim A Hassan, Jo C Dumville | 12 julio 2017
Huang-Shen Lin, Pei-Tzu Lin, Yu-Shiun Tsai, Shu-Hui Wang, Ching-Chi Chi | 26 febrero 2021
Esther J van Zuuren, Zbys Fedorowicz, Ben Carter, Mireille MD van der Linden, Lyn Charland | 28 abril 2015
Julio Heras‐Mosteiro, Begoña Monge‐Maillo, Mariona Pinart, Patricia Lopez Pereira, Ludovic Reveiz, Emely Garcia‐Carrasco, Pedro Campuzano Cuadrado, Ana Royuela, Irene Mendez Roman, Rogelio López‐Vélez | 1 diciembre 2017
Jo C Dumville, Emma McFarlane, Peggy Edwards, Allyson Lipp, Alexandra Holmes, Zhenmi Liu | 21 abril 2015
Zhirong Yang, Yuan Zhang, Elvira Lazic Mosler, Jing Hu, Hang Li, Yanchang Zhang, Jia Liu, Qian Zhang | 16 marzo 2020
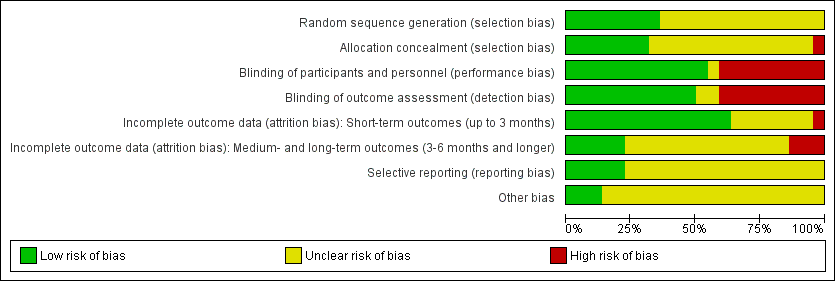
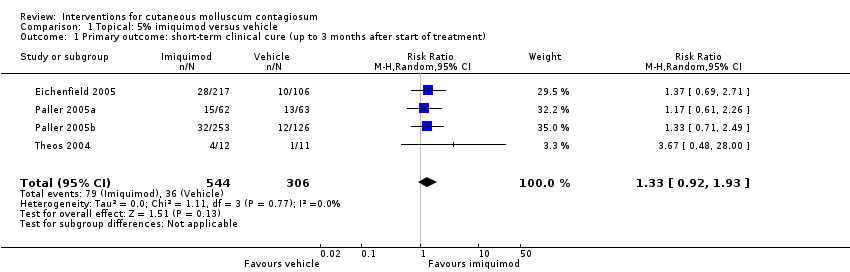
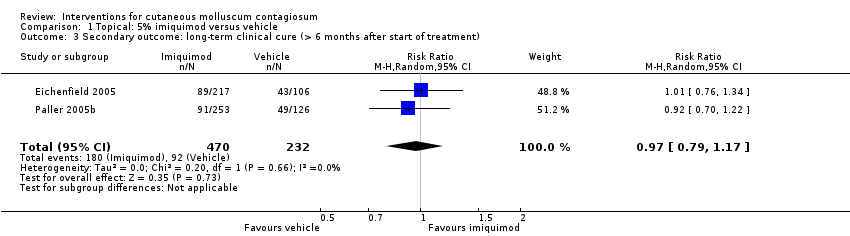
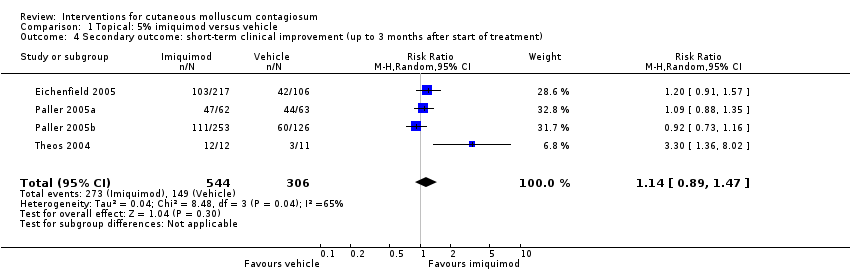
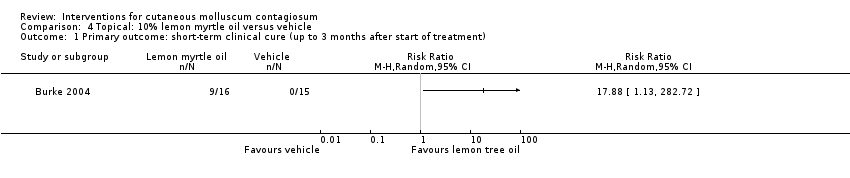
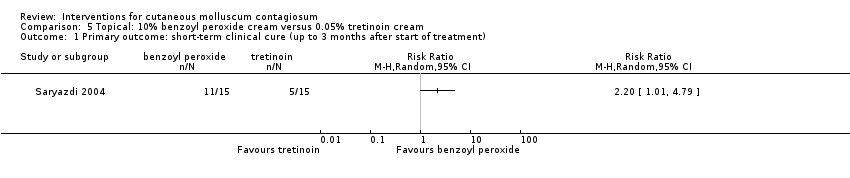
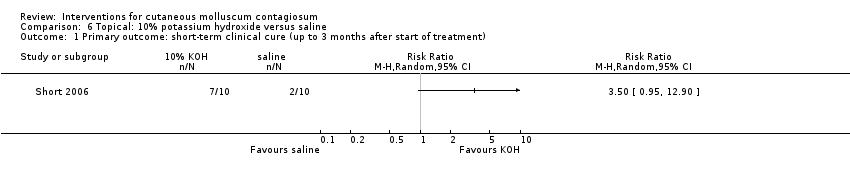
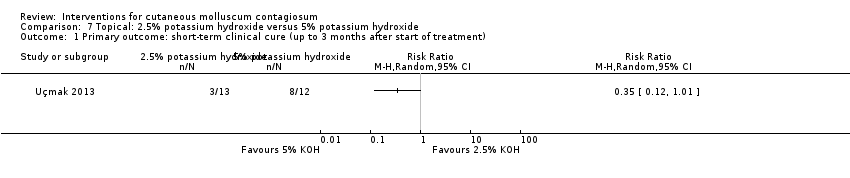
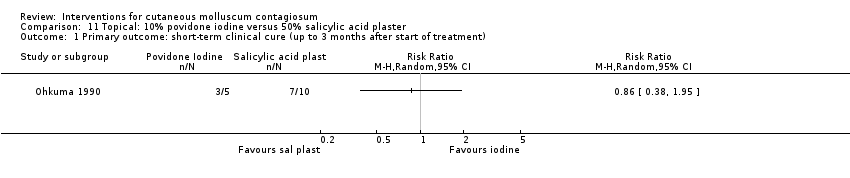
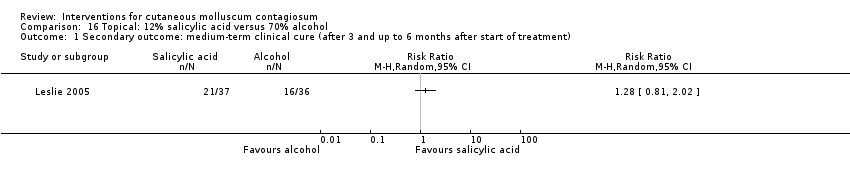
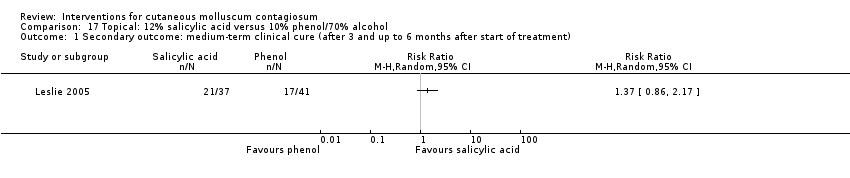
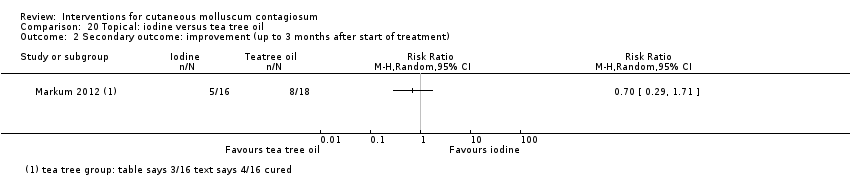
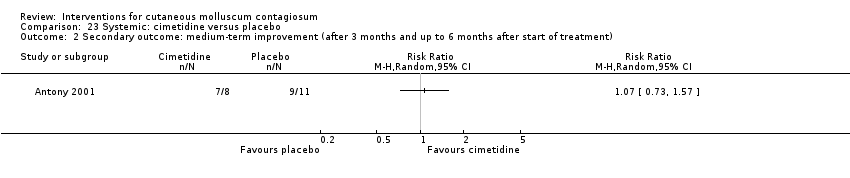
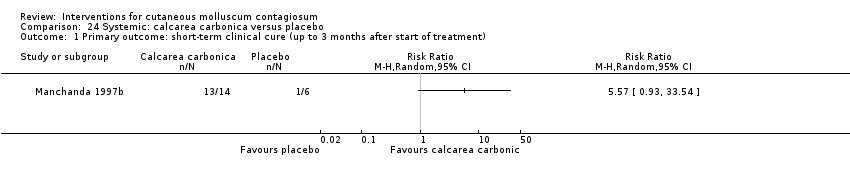
Joel TM Bamford, Sujoy Ray, Alfred Musekiwa, Christel van Gool, Rosemary Humphreys, Edzard Ernst | 30 abril 2013
Gwendy Dupire, Catherine Droitcourt, Carolyn Hughes, Laurence Le Cleach | 5 marzo 2019
Fiona J Bath‐Hextall, Rubeta N Matin, David Wilkinson, Jo Leonardi‐Bee | 24 junio 2013
Natasja HJ Van Veen, Diana NJ Lockwood, Wim H van Brakel, Jose Ramirez Jr, Jan Hendrik Richardus | 8 julio 2009
Podcast relacionado
Respuestas clínicas Cochrane
Sera Tort, Michael Eisenhut | 2 octubre 2017