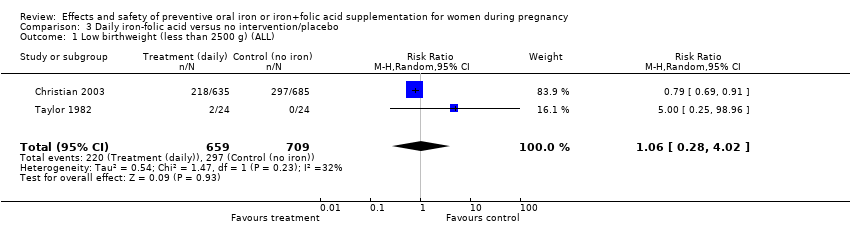
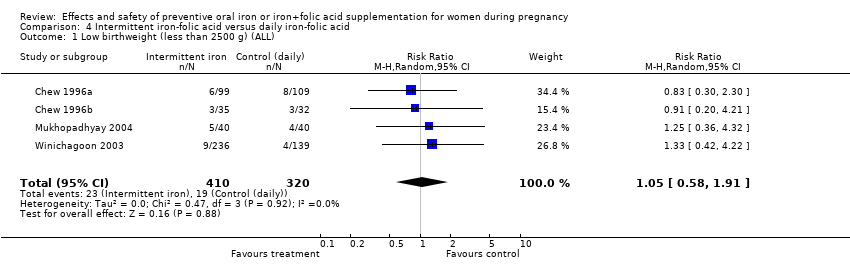
| 1 Low birthweight (less than 2500 g) (ALL) Show forest plot | 9 | 6275 | Risk Ratio (M‐H, Random, 95% CI) | 0.79 [0.61, 1.03] |
|
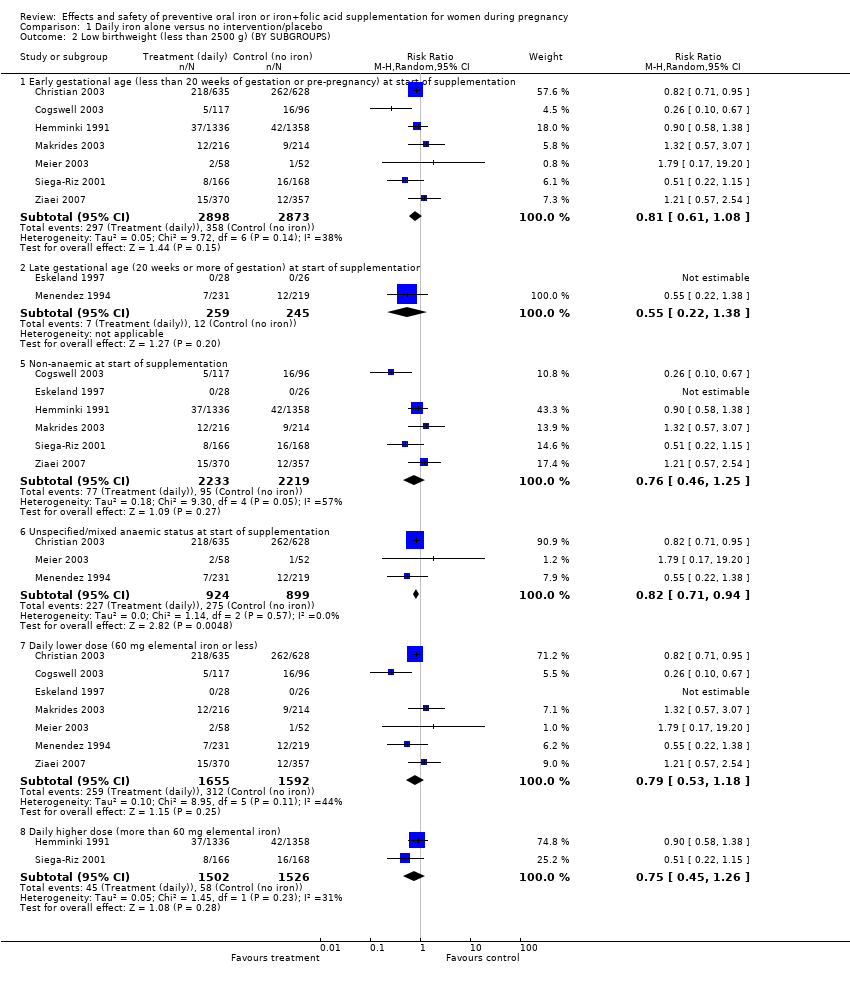
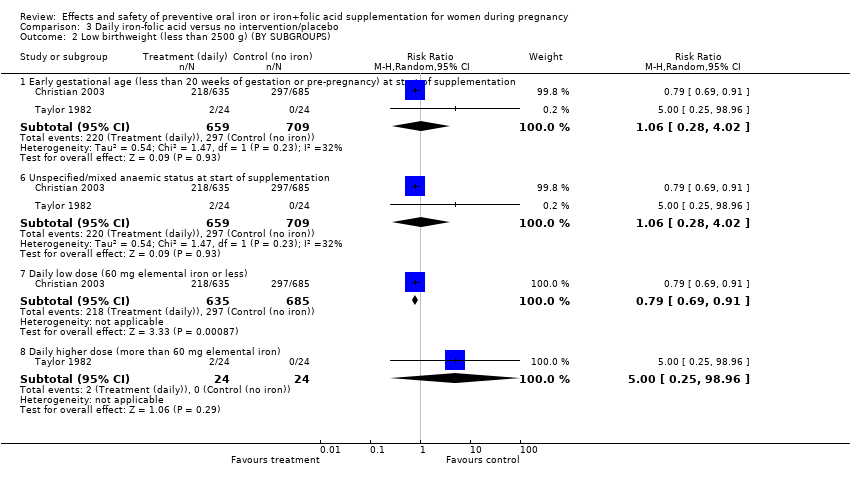
| 2 Low birthweight (less than 2500 g) (BY SUBGROUPS) Show forest plot | 9 | | Risk Ratio (M‐H, Random, 95% CI) | Subtotals only |
|
| 2.1 Early gestational age (less than 20 weeks of gestation or pre‐pregnancy) at start of supplementation | 7 | 5771 | Risk Ratio (M‐H, Random, 95% CI) | 0.81 [0.61, 1.08] |
| 2.2 Late gestational age (20 weeks or more of gestation) at start of supplementation | 2 | 504 | Risk Ratio (M‐H, Random, 95% CI) | 0.55 [0.22, 1.38] |
| 2.5 Non‐anaemic at start of supplementation | 6 | 4452 | Risk Ratio (M‐H, Random, 95% CI) | 0.76 [0.46, 1.25] |
| 2.6 Unspecified/mixed anaemic status at start of supplementation | 3 | 1823 | Risk Ratio (M‐H, Random, 95% CI) | 0.82 [0.71, 0.94] |
| 2.7 Daily lower dose (60 mg elemental iron or less) | 7 | 3247 | Risk Ratio (M‐H, Random, 95% CI) | 0.79 [0.53, 1.18] |
| 2.8 Daily higher dose (more than 60 mg elemental iron) | 2 | 3028 | Risk Ratio (M‐H, Random, 95% CI) | 0.75 [0.45, 1.26] |
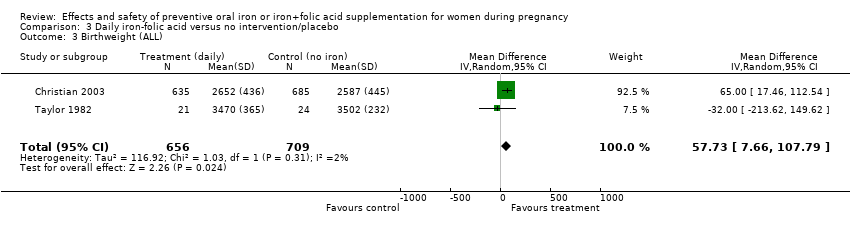
| 3 Birthweight (g) (ALL) Show forest plot | 10 | 5956 | Mean Difference (IV, Random, 95% CI) | 36.05 [‐4.84, 76.95] |
|
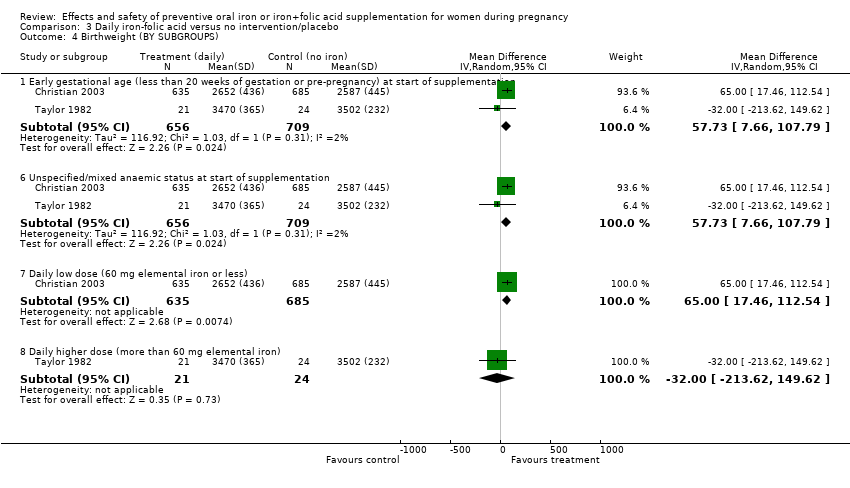
| 4 Birthweight (g) (BY SUBGROUPS) Show forest plot | 11 | | Mean Difference (IV, Random, 95% CI) | Subtotals only |
|
| 4.1 Early gestational age (less than 20 weeks of gestation or pre‐pregnancy) at start of supplementation | 9 | 5822 | Mean Difference (IV, Random, 95% CI) | 30.89 [‐13.87, 75.65] |
| 4.2 Late gestational age (20 weeks or more of gestation) at start of supplementation | 2 | 251 | Mean Difference (IV, Random, 95% CI) | 39.72 [‐67.69, 147.12] |
| 4.5 Non‐anaemic at start of supplementation | 8 | 4496 | Mean Difference (IV, Random, 95% CI) | 29.32 [‐27.08, 85.71] |
| 4.6 Unspecified/mixed anaemic status at start of supplementation | 3 | 1577 | Mean Difference (IV, Random, 95% CI) | 52.33 [10.16, 94.51] |
| 4.7 Daily low dose (60 mg elemental iron or less) | 6 | 2804 | Mean Difference (IV, Random, 95% CI) | 37.22 [‐17.82, 92.27] |
| 4.8 Daily higher dose (more than 60 mg elemental iron) | 6 | 3382 | Mean Difference (IV, Random, 95% CI) | 17.99 [‐41.28, 77.26] |
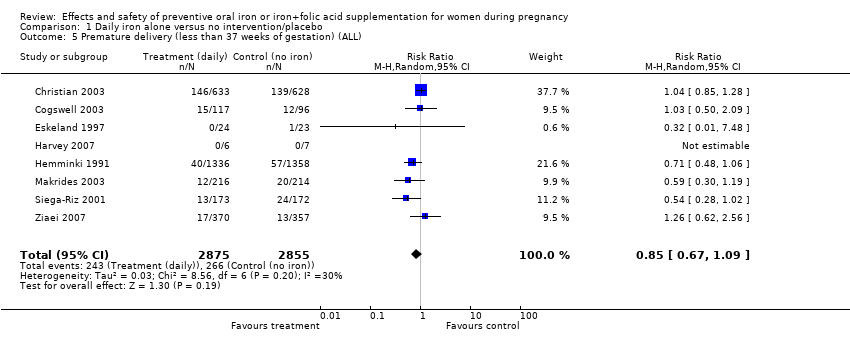
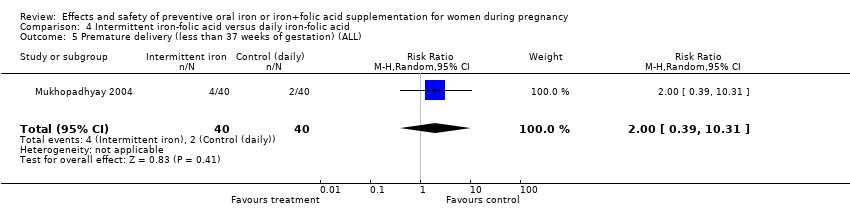
| 5 Premature delivery (less than 37 weeks of gestation) (ALL) Show forest plot | 8 | 5730 | Risk Ratio (M‐H, Random, 95% CI) | 0.85 [0.67, 1.09] |
|
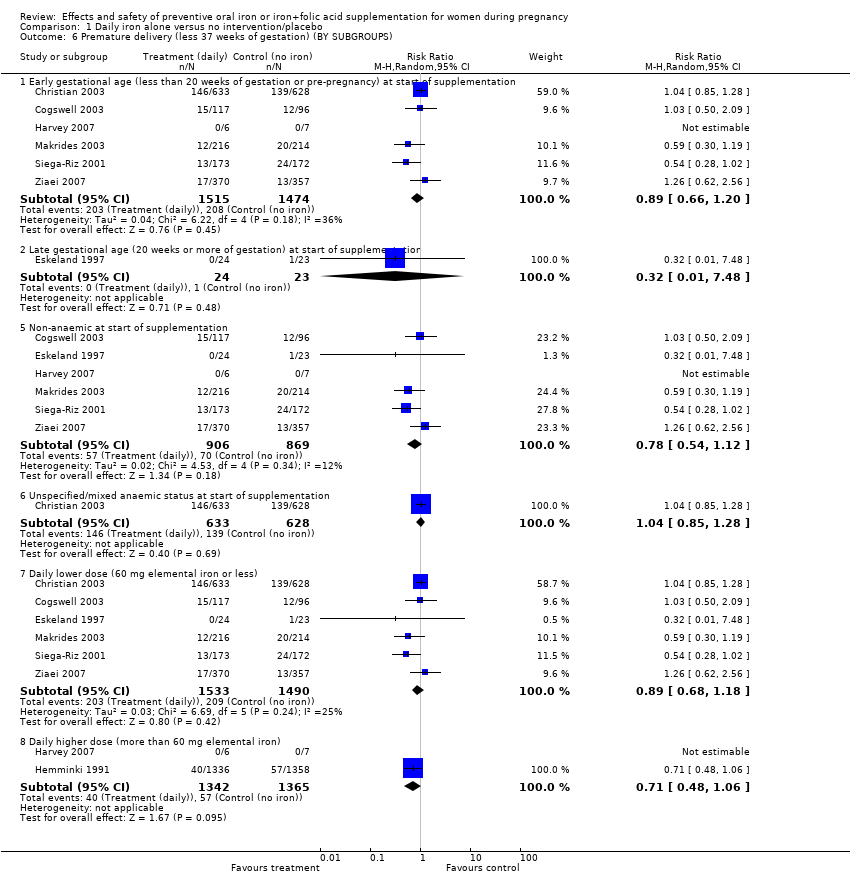
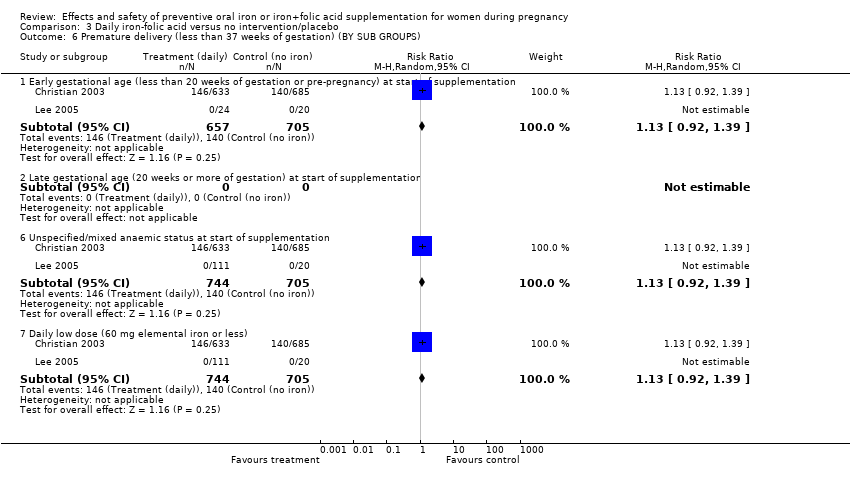
| 6 Premature delivery (less 37 weeks of gestation) (BY SUBGROUPS) Show forest plot | 8 | | Risk Ratio (M‐H, Random, 95% CI) | Subtotals only |
|
| 6.1 Early gestational age (less than 20 weeks of gestation or pre‐pregnancy) at start of supplementation | 6 | 2989 | Risk Ratio (M‐H, Random, 95% CI) | 0.89 [0.66, 1.20] |
| 6.2 Late gestational age (20 weeks or more of gestation) at start of supplementation | 1 | 47 | Risk Ratio (M‐H, Random, 95% CI) | 0.32 [0.01, 7.48] |
| 6.5 Non‐anaemic at start of supplementation | 6 | 1775 | Risk Ratio (M‐H, Random, 95% CI) | 0.78 [0.54, 1.12] |
| 6.6 Unspecified/mixed anaemic status at start of supplementation | 1 | 1261 | Risk Ratio (M‐H, Random, 95% CI) | 1.04 [0.85, 1.28] |
| 6.7 Daily lower dose (60 mg elemental iron or less) | 6 | 3023 | Risk Ratio (M‐H, Random, 95% CI) | 0.89 [0.68, 1.18] |
| 6.8 Daily higher dose (more than 60 mg elemental iron) | 2 | 2707 | Risk Ratio (M‐H, Random, 95% CI) | 0.71 [0.48, 1.06] |
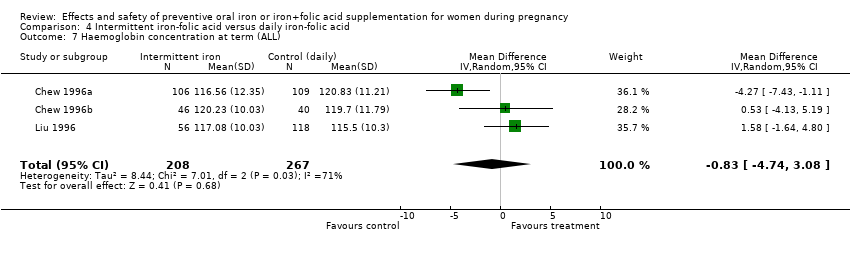
| 7 Maternal Hb concentration at term (g/L) (ALL) Show forest plot | 17 | 2463 | Mean Difference (IV, Random, 95% CI) | 8.83 [6.55, 11.11] |
|
| 8 Maternal Hb concentration at term (g/L) (BY SUBGROUPS) Show forest plot | 17 | | Mean Difference (IV, Random, 95% CI) | Subtotals only |
|
| 8.1 Early gestational age (less than 20 weeks of gestation or pre‐pregnancy) at start of supplementation | 13 | 2306 | Mean Difference (IV, Random, 95% CI) | 8.14 [5.61, 10.67] |
| 8.2 Late gestational age (20 weeks or more of gestation) at start of supplementation | 3 | 130 | Mean Difference (IV, Random, 95% CI) | 10.24 [2.45, 18.04] |
| 8.3 Unspecified/mixed gestational age at start of supplementation | 1 | 27 | Mean Difference (IV, Random, 95% CI) | 14.0 [8.07, 19.93] |
| 8.5 Non‐anaemic at start of supplementation | 11 | 2002 | Mean Difference (IV, Random, 95% CI) | 7.77 [4.86, 10.69] |
| 8.6 Unspecified/mixed anaemic status at start of supplementation | 6 | 461 | Mean Difference (IV, Random, 95% CI) | 11.03 [7.51, 14.56] |
| 8.7 Daily low dose (60 mg elemental iron or less) | 8 | 1956 | Mean Difference (IV, Random, 95% CI) | 7.16 [4.14, 10.17] |
| 8.8 Daily higher dose (more than 60 mg elemental iron) | 9 | 507 | Mean Difference (IV, Random, 95% CI) | 10.94 [7.06, 14.82] |
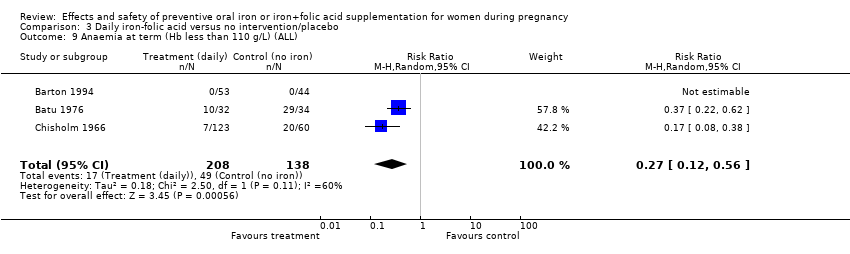
| 9 Anaemia at term (Hb less than 110 g/L) (ALL) Show forest plot | 14 | 4390 | Risk Ratio (M‐H, Random, 95% CI) | 0.27 [0.17, 0.42] |
|
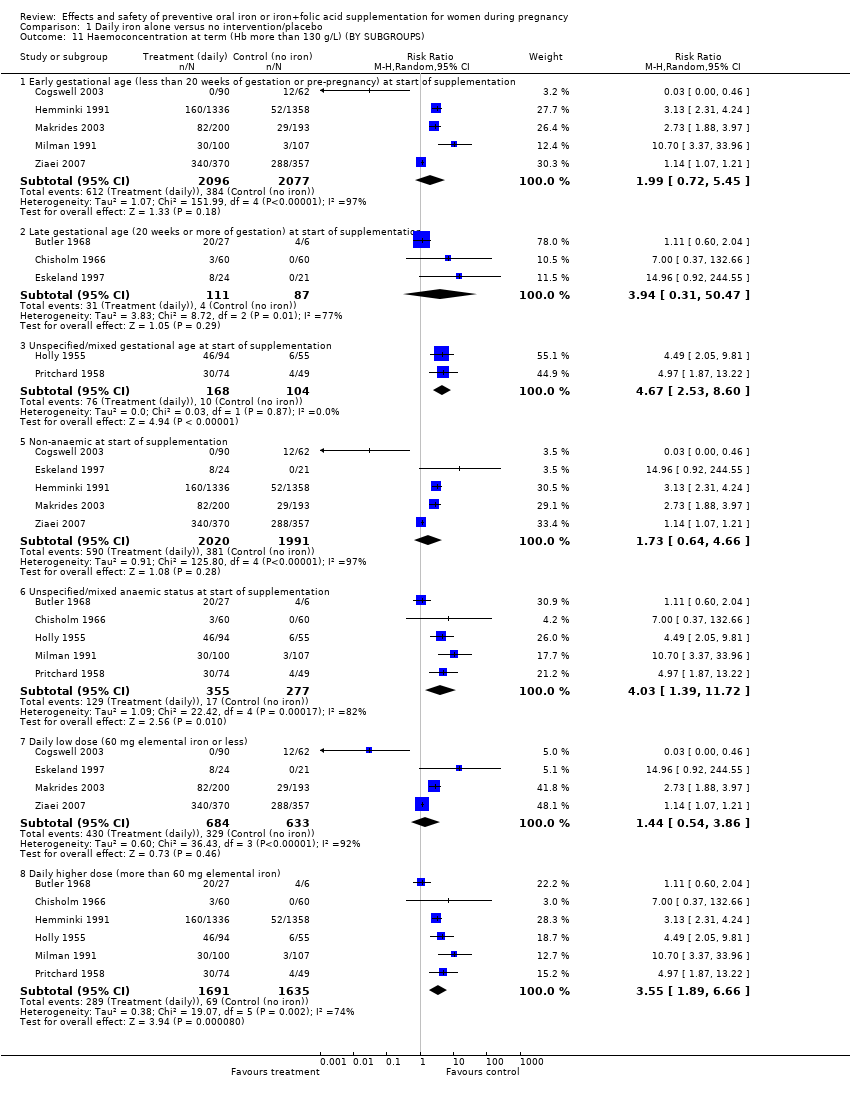
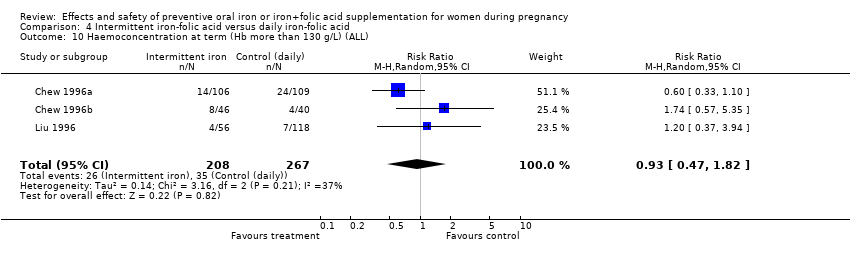
| 10 Haemoconcentration at term (Hb more than 130 g/L) (ALL) Show forest plot | 10 | 4643 | Risk Ratio (M‐H, Random, 95% CI) | 2.62 [1.21, 5.67] |
|
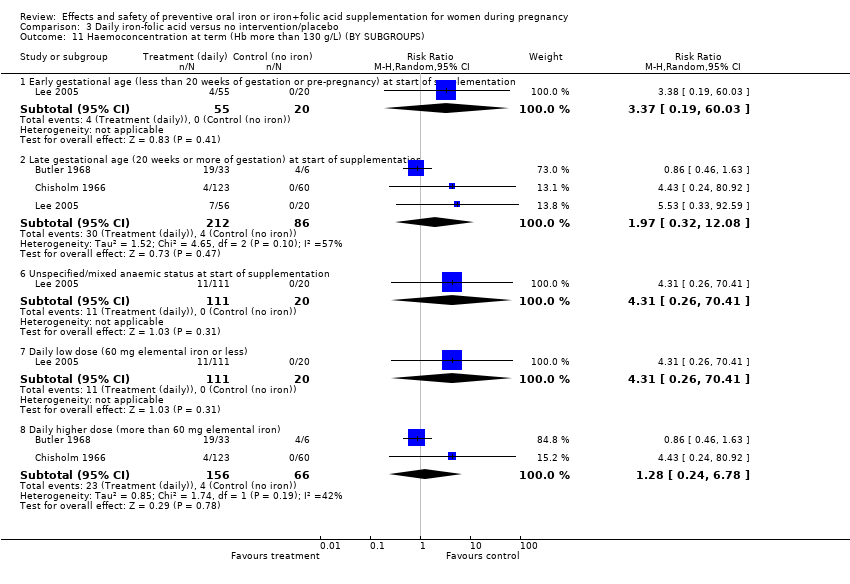
| 11 Haemoconcentration at term (Hb more than 130 g/L) (BY SUBGROUPS) Show forest plot | 10 | | Risk Ratio (M‐H, Random, 95% CI) | Subtotals only |
|
| 11.1 Early gestational age (less than 20 weeks of gestation or pre‐pregnancy) at start of supplementation | 5 | 4173 | Risk Ratio (M‐H, Random, 95% CI) | 1.99 [0.72, 5.45] |
| 11.2 Late gestational age (20 weeks or more of gestation) at start of supplementation | 3 | 198 | Risk Ratio (M‐H, Random, 95% CI) | 3.94 [0.31, 50.47] |
| 11.3 Unspecified/mixed gestational age at start of supplementation | 2 | 272 | Risk Ratio (M‐H, Random, 95% CI) | 4.67 [2.53, 8.60] |
| 11.5 Non‐anaemic at start of supplementation | 5 | 4011 | Risk Ratio (M‐H, Random, 95% CI) | 1.73 [0.64, 4.66] |
| 11.6 Unspecified/mixed anaemic status at start of supplementation | 5 | 632 | Risk Ratio (M‐H, Random, 95% CI) | 4.03 [1.39, 11.72] |
| 11.7 Daily low dose (60 mg elemental iron or less) | 4 | 1317 | Risk Ratio (M‐H, Random, 95% CI) | 1.44 [0.54, 3.86] |
| 11.8 Daily higher dose (more than 60 mg elemental iron) | 6 | 3326 | Risk Ratio (M‐H, Random, 95% CI) | 3.55 [1.89, 6.66] |
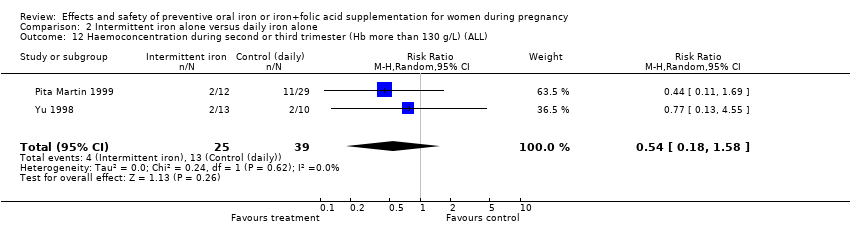
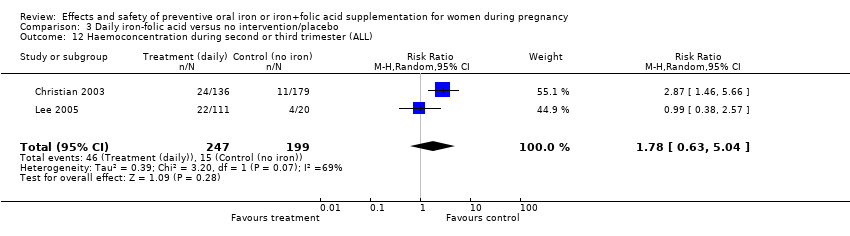
| 12 Haemoconcentration during second or third trimester (ALL) Show forest plot | 10 | 4841 | Risk Ratio (M‐H, Random, 95% CI) | 2.27 [1.40, 3.70] |
|
| 13 Haemoconcentration during second or third trimester (BY SUBGROUPS) Show forest plot | 10 | | Risk Ratio (M‐H, Random, 95% CI) | Subtotals only |
|
| 13.1 Early gestational age (less than 20 weeks of gestation or pre‐pregnancy) at start of supplementation | 7 | 4522 | Risk Ratio (M‐H, Random, 95% CI) | 2.62 [1.49, 4.60] |
| 13.2 Late gestational age (20 weeks or more of gestation) at start of supplementation | 1 | 47 | Risk Ratio (M‐H, Random, 95% CI) | 1.44 [0.72, 2.86] |
| 13.3 Unspecified/mixed gestational age at start of supplementation | 2 | 272 | Risk Ratio (M‐H, Random, 95% CI) | 1.94 [0.30, 12.29] |
| 13.5 Non‐anaemic at start of supplementation | 6 | 4088 | Risk Ratio (M‐H, Random, 95% CI) | 2.10 [1.13, 3.90] |
| 13.6 Unspecified/mixed anaemic status at start of supplementation | 4 | 753 | Risk Ratio (M‐H, Random, 95% CI) | 2.67 [0.99, 7.17] |
| 13.7 Daily low dose (60 mg elemental iron or less) | 5 | 1655 | Risk Ratio (M‐H, Random, 95% CI) | 2.35 [1.21, 4.57] |
| 13.8 Daily higher dose (more than 60 mg elemental iron) | 5 | 3186 | Risk Ratio (M‐H, Random, 95% CI) | 2.14 [1.05, 4.37] |
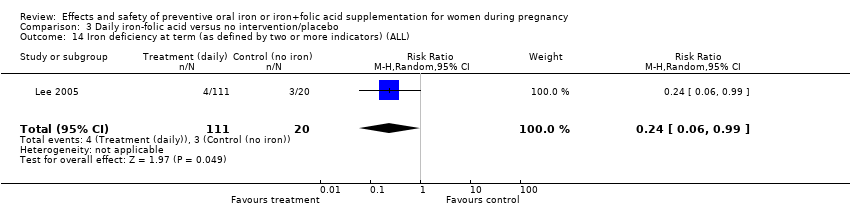
| 14 Iron deficiency at term (as defined by two or more indicators) (ALL) Show forest plot | 6 | 1108 | Risk Ratio (M‐H, Random, 95% CI) | 0.44 [0.27, 0.70] |
|
| 15 Iron deficiency at term (as defined by two or more indicators) (BY SUBGROUPS) Show forest plot | 6 | | Risk Ratio (M‐H, Random, 95% CI) | Subtotals only |
|
| 15.1 Early gestational age (less than 20 weeks of gestation or pre‐pregnancy) at start of supplementation | 4 | 867 | Risk Ratio (M‐H, Random, 95% CI) | 0.56 [0.35, 0.90] |
| 15.2 Late gestational age (20 weeks or more of gestation) at start of supplementation | 2 | 241 | Risk Ratio (M‐H, Random, 95% CI) | 0.28 [0.17, 0.44] |
| 15.5 Non‐anaemic at start of supplementation | 4 | 944 | Risk Ratio (M‐H, Random, 95% CI) | 0.60 [0.41, 0.90] |
| 15.6 Unspecified/mixed anaemic status at start of supplementation | 2 | 164 | Risk Ratio (M‐H, Random, 95% CI) | 0.14 [0.07, 0.29] |
| 15.7 Daily low dose (60 mg elemental iron or less) | 4 | 944 | Risk Ratio (M‐H, Random, 95% CI) | 0.60 [0.41, 0.90] |
| 15.8 Daily higher dose (more than 60 mg elemental iron) | 2 | 164 | Risk Ratio (M‐H, Random, 95% CI) | 0.14 [0.07, 0.29] |
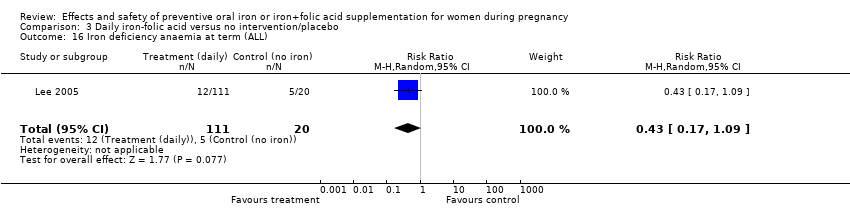
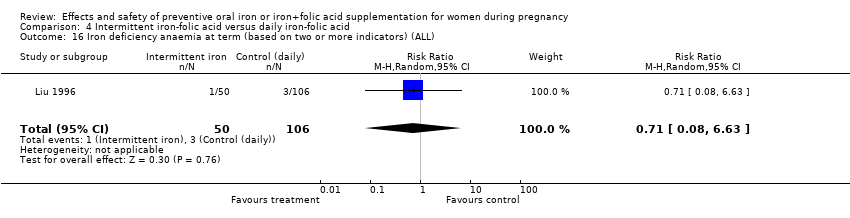
| 16 Iron deficiency anaemia at term (ALL) Show forest plot | 6 | 1667 | Risk Ratio (M‐H, Random, 95% CI) | 0.33 [0.16, 0.69] |
|
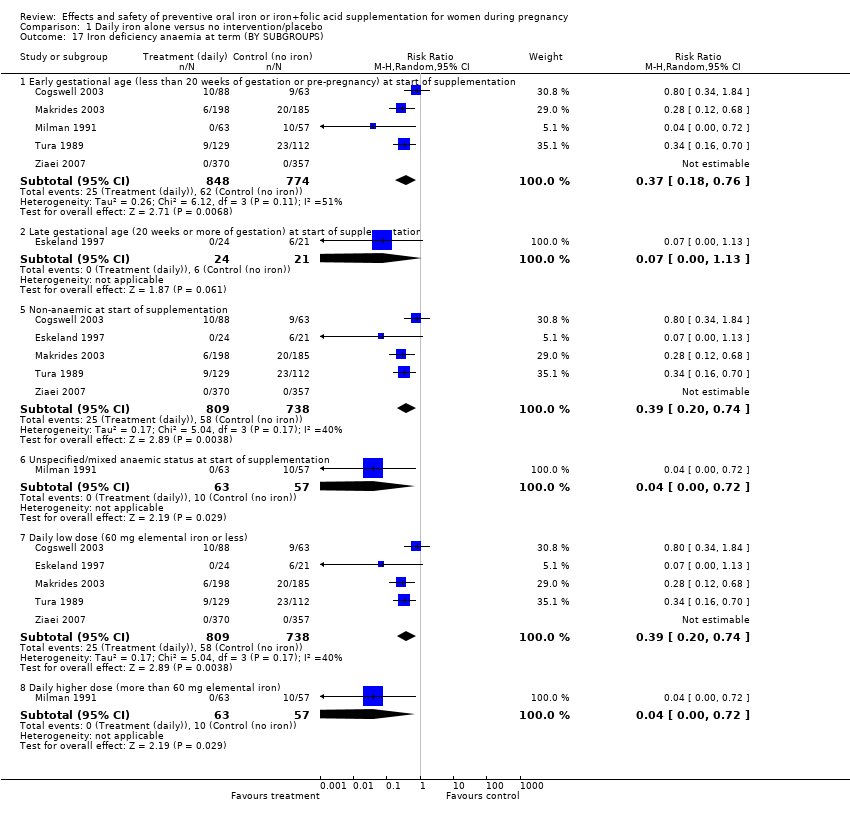
| 17 Iron deficiency anaemia at term (BY SUBGROUPS) Show forest plot | 6 | | Risk Ratio (M‐H, Random, 95% CI) | Subtotals only |
|
| 17.1 Early gestational age (less than 20 weeks of gestation or pre‐pregnancy) at start of supplementation | 5 | 1622 | Risk Ratio (M‐H, Random, 95% CI) | 0.37 [0.18, 0.76] |
| 17.2 Late gestational age (20 weeks or more of gestation) at start of supplementation | 1 | 45 | Risk Ratio (M‐H, Random, 95% CI) | 0.07 [0.00, 1.13] |
| 17.5 Non‐anaemic at start of supplementation | 5 | 1547 | Risk Ratio (M‐H, Random, 95% CI) | 0.39 [0.20, 0.74] |
| 17.6 Unspecified/mixed anaemic status at start of supplementation | 1 | 120 | Risk Ratio (M‐H, Random, 95% CI) | 0.04 [0.00, 0.72] |
| 17.7 Daily low dose (60 mg elemental iron or less) | 5 | 1547 | Risk Ratio (M‐H, Random, 95% CI) | 0.39 [0.20, 0.74] |
| 17.8 Daily higher dose (more than 60 mg elemental iron) | 1 | 120 | Risk Ratio (M‐H, Random, 95% CI) | 0.04 [0.00, 0.72] |
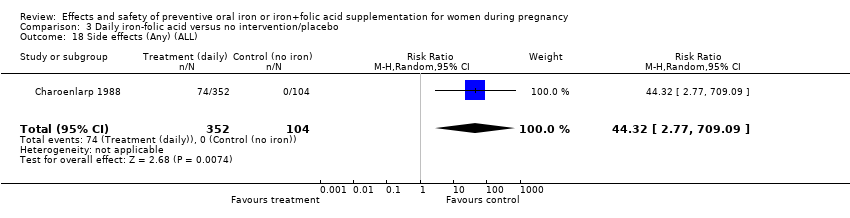
| 18 Side‐effects (Any) (ALL) Show forest plot | 8 | 3667 | Risk Ratio (M‐H, Random, 95% CI) | 3.92 [1.21, 12.64] |
|
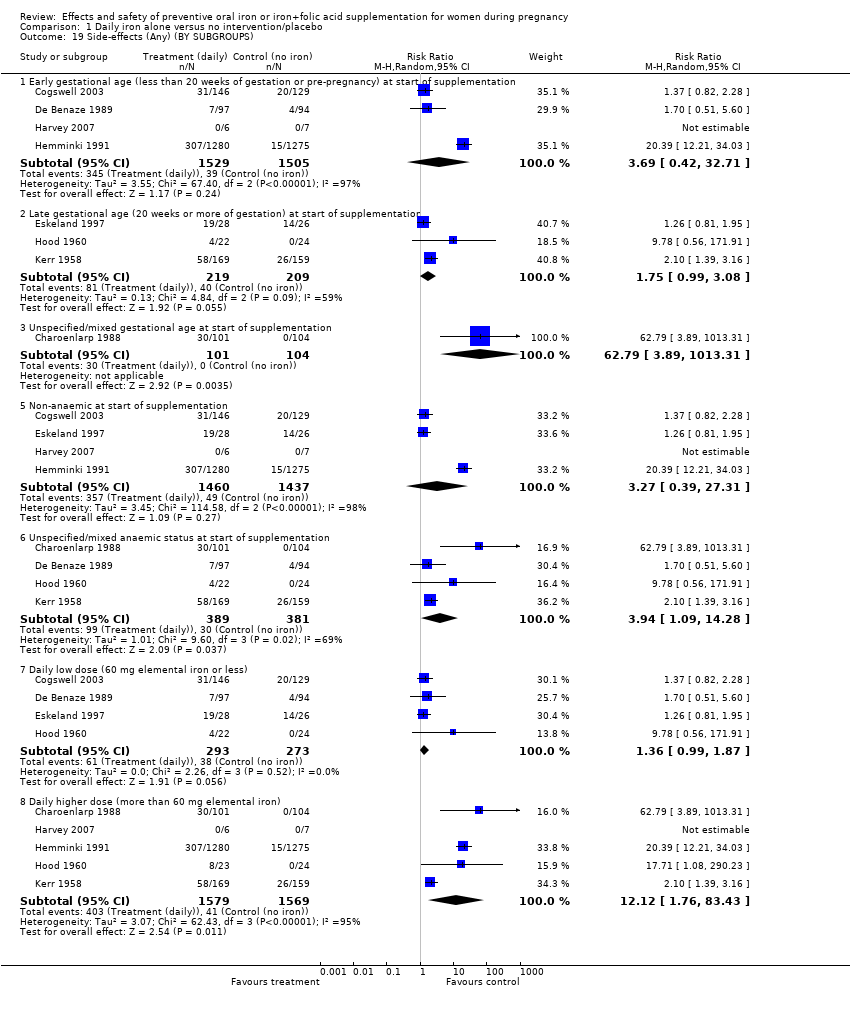
| 19 Side‐effects (Any) (BY SUBGROUPS) Show forest plot | 8 | | Risk Ratio (M‐H, Random, 95% CI) | Subtotals only |
|
| 19.1 Early gestational age (less than 20 weeks of gestation or pre‐pregnancy) at start of supplementation | 4 | 3034 | Risk Ratio (M‐H, Random, 95% CI) | 3.69 [0.42, 32.71] |
| 19.2 Late gestational age (20 weeks or more of gestation) at start of supplementation | 3 | 428 | Risk Ratio (M‐H, Random, 95% CI) | 1.75 [0.99, 3.08] |
| 19.3 Unspecified/mixed gestational age at start of supplementation | 1 | 205 | Risk Ratio (M‐H, Random, 95% CI) | 62.79 [3.89, 1013.31] |
| 19.5 Non‐anaemic at start of supplementation | 4 | 2897 | Risk Ratio (M‐H, Random, 95% CI) | 3.27 [0.39, 27.31] |
| 19.6 Unspecified/mixed anaemic status at start of supplementation | 4 | 770 | Risk Ratio (M‐H, Random, 95% CI) | 3.94 [1.09, 14.28] |
| 19.7 Daily low dose (60 mg elemental iron or less) | 4 | 566 | Risk Ratio (M‐H, Random, 95% CI) | 1.36 [0.99, 1.87] |
| 19.8 Daily higher dose (more than 60 mg elemental iron) | 5 | 3148 | Risk Ratio (M‐H, Random, 95% CI) | 12.12 [1.76, 83.43] |
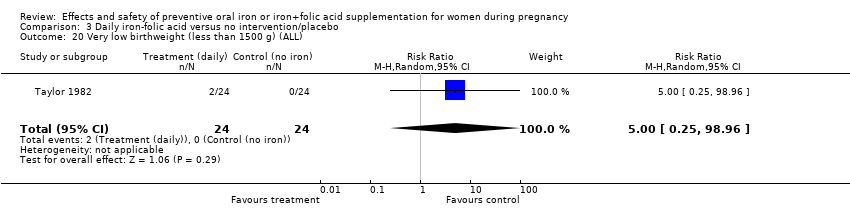
| 20 Very low birthweight (less than 1500 g) (ALL) Show forest plot | 5 | 2687 | Risk Ratio (M‐H, Random, 95% CI) | 0.73 [0.31, 1.74] |
|
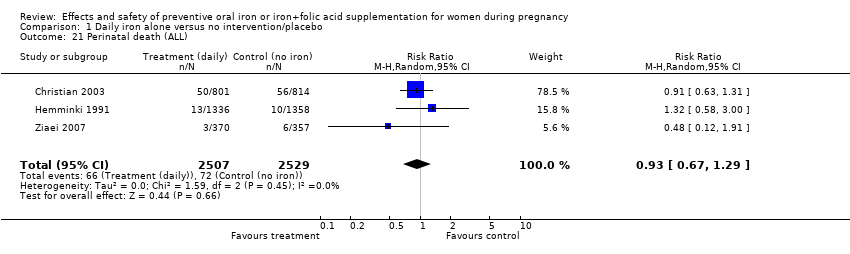
| 21 Perinatal death (ALL) Show forest plot | 3 | 5036 | Risk Ratio (M‐H, Random, 95% CI) | 0.93 [0.67, 1.29] |
|
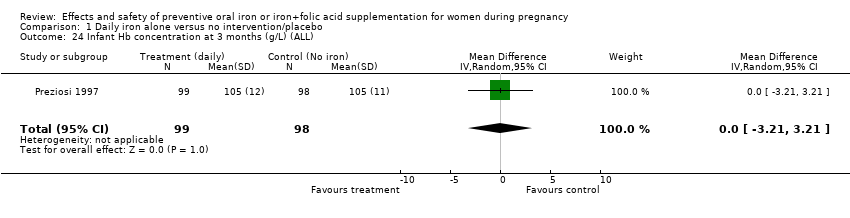
| 24 Infant Hb concentration at 3 months (g/L) (ALL) Show forest plot | 1 | 197 | Mean Difference (IV, Random, 95% CI) | 0.0 [‐3.21, 3.21] |
|
| 25 Infant serum ferritin concentration at 3 months (ug/L) (ALL) Show forest plot | 1 | 197 | Mean Difference (IV, Random, 95% CI) | 19.0 [2.75, 35.25] |
|
| 26 Infant Hb concentration at 6 months (g/L) (ALL) Show forest plot | 2 | 533 | Mean Difference (IV, Random, 95% CI) | ‐1.25 [‐8.10, 5.59] |
|
| 27 Infant serum ferritin concentration at 6 months (ug/L) (ALL) Show forest plot | 1 | 197 | Mean Difference (IV, Random, 95% CI) | 11.0 [4.37, 17.63] |
|
| 29 Admission to special care unit (ALL) Show forest plot | 2 | 2805 | Risk Ratio (M‐H, Random, 95% CI) | 0.95 [0.73, 1.23] |
|
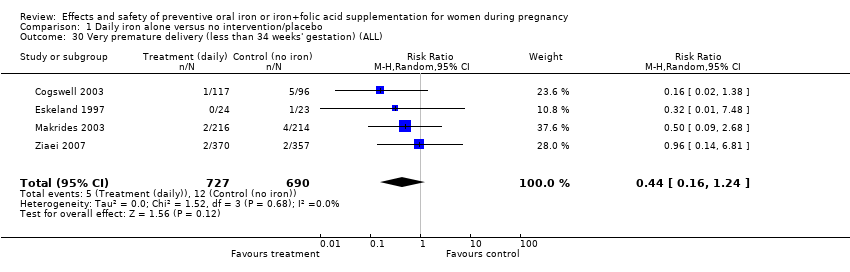
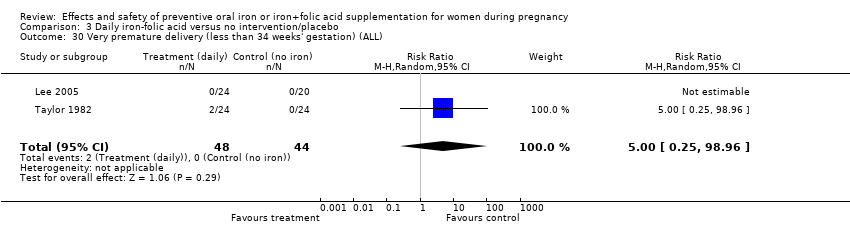
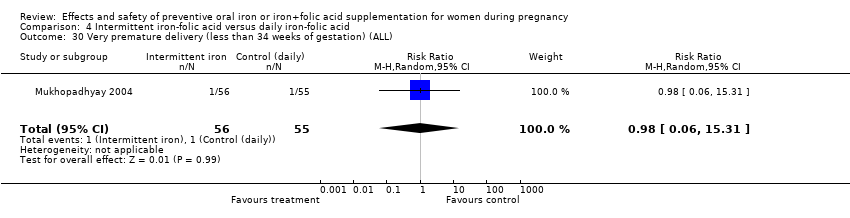
| 30 Very premature delivery (less than 34 weeks' gestation) (ALL) Show forest plot | 4 | 1417 | Risk Ratio (M‐H, Random, 95% CI) | 0.44 [0.16, 1.24] |
|
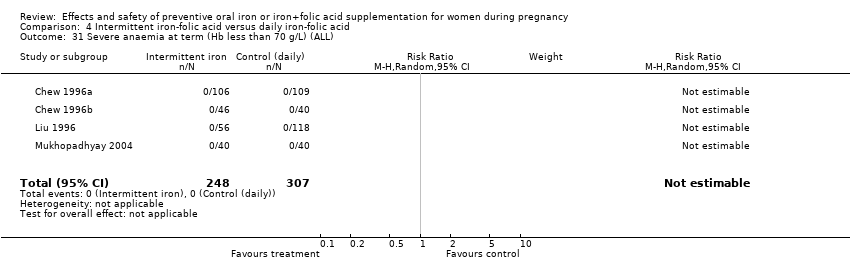
| 31 Severe anaemia at term (Hb less than 70 g/L) (ALL) Show forest plot | 8 | 1751 | Risk Ratio (M‐H, Random, 95% CI) | 4.83 [0.23, 99.88] |
|
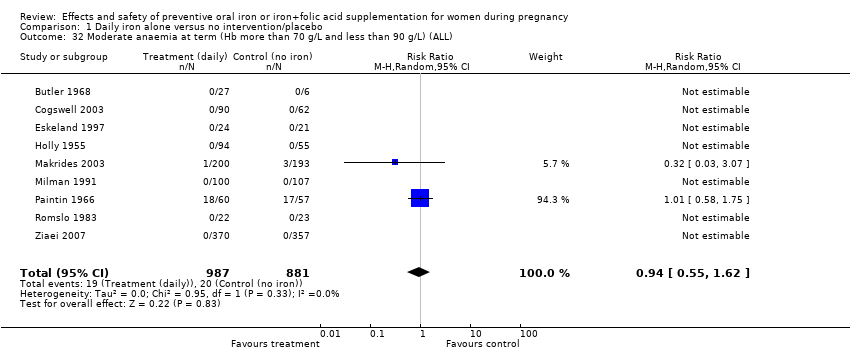
| 32 Moderate anaemia at term (Hb more than 70 g/L and less than 90 g/L) (ALL) Show forest plot | 9 | 1868 | Risk Ratio (M‐H, Random, 95% CI) | 0.94 [0.55, 1.62] |
|
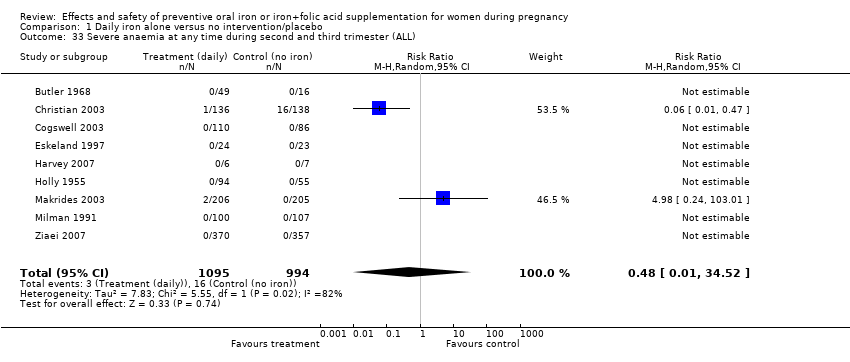
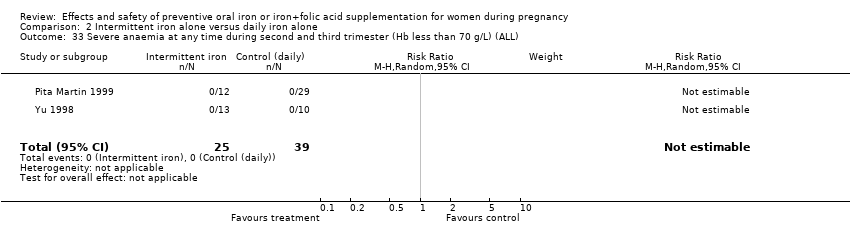
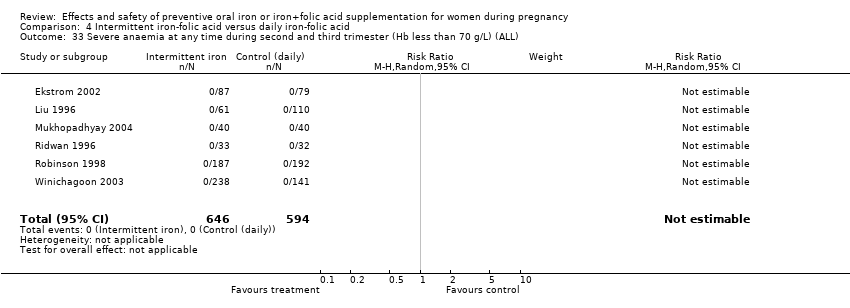
| 33 Severe anaemia at any time during second and third trimester (ALL) Show forest plot | 9 | 2089 | Risk Ratio (M‐H, Random, 95% CI) | 0.48 [0.01, 34.52] |
|
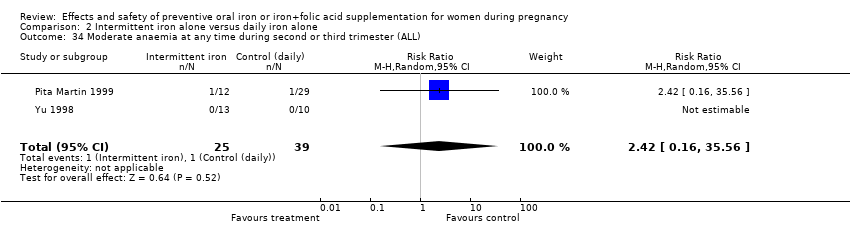
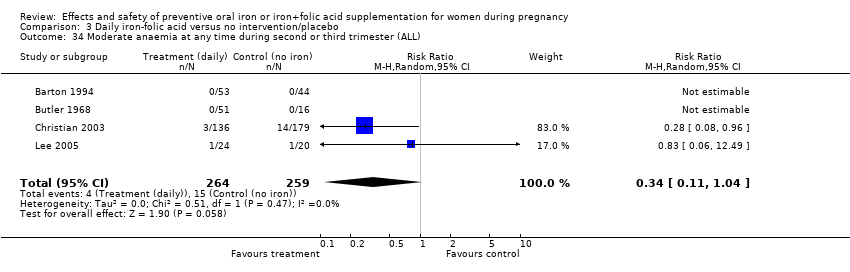
| 34 Moderate anaemia at any time during second or third trimester (ALL) Show forest plot | 10 | 2266 | Risk Ratio (M‐H, Random, 95% CI) | 0.42 [0.19, 0.92] |
|
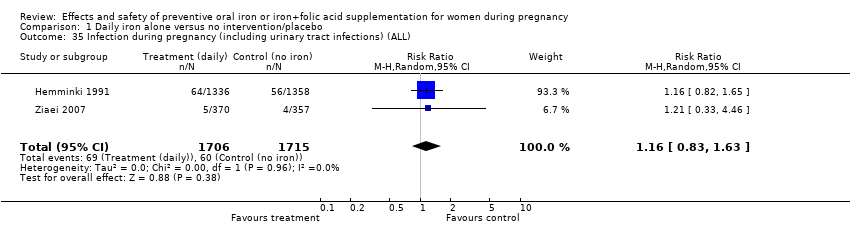
| 35 Infection during pregnancy (including urinary tract infections) (ALL) Show forest plot | 2 | 3421 | Risk Ratio (M‐H, Random, 95% CI) | 1.16 [0.83, 1.63] |
|
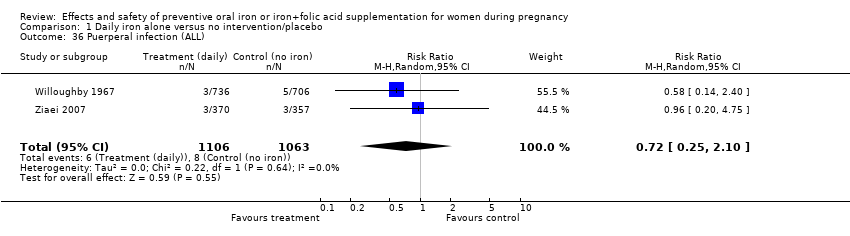
| 36 Puerperal infection (ALL) Show forest plot | 2 | 2169 | Risk Ratio (M‐H, Random, 95% CI) | 0.72 [0.25, 2.10] |
|
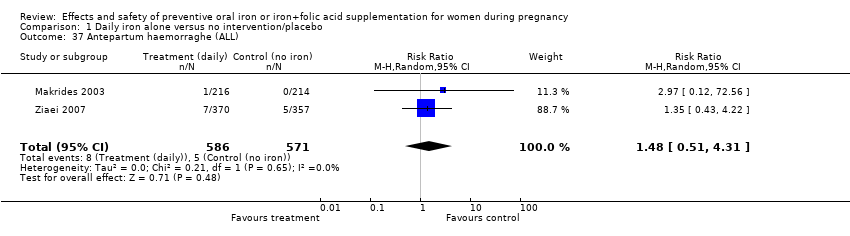
| 37 Antepartum haemorraghe (ALL) Show forest plot | 2 | 1157 | Risk Ratio (M‐H, Random, 95% CI) | 1.48 [0.51, 4.31] |
|
| 38 Postpartum haemorraghe (ALL) Show forest plot | 5 | 1554 | Risk Ratio (M‐H, Random, 95% CI) | 0.95 [0.51, 1.78] |
|
| 39 Transfusion provided (ALL) Show forest plot | 3 | 3453 | Risk Ratio (M‐H, Random, 95% CI) | 0.61 [0.38, 0.96] |
|
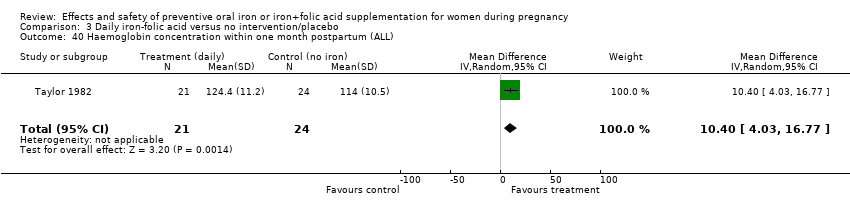
| 40 Haemoglobin concentration within one month postpartum (ALL) Show forest plot | 6 | 904 | Mean Difference (IV, Random, 95% CI) | 7.08 [4.70, 9.47] |
|
| 41 Severe anaemia at postpartum (Hb less than 80 g/L) (ALL) Show forest plot | 7 | 1094 | Risk Ratio (M‐H, Random, 95% CI) | 0.06 [0.00, 1.05] |
|
| 42 Moderate anaemia at postpartum (Hb more than 80 g/L and less than 100 g/L) (ALL) Show forest plot | 4 | 831 | Risk Ratio (M‐H, Random, 95% CI) | 0.55 [0.12, 2.51] |
|
| 43 Diarrhoea (ALL) Show forest plot | 3 | 1088 | Risk Ratio (M‐H, Random, 95% CI) | 0.55 [0.32, 0.93] |
|
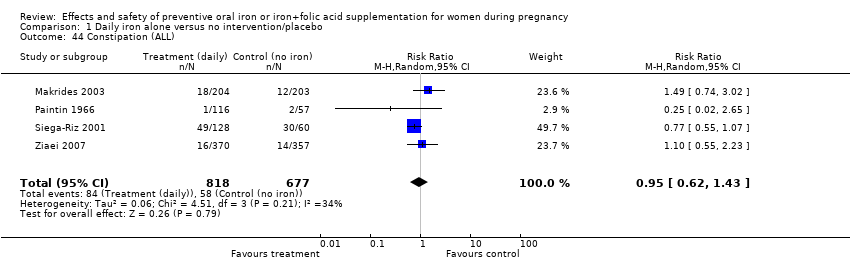
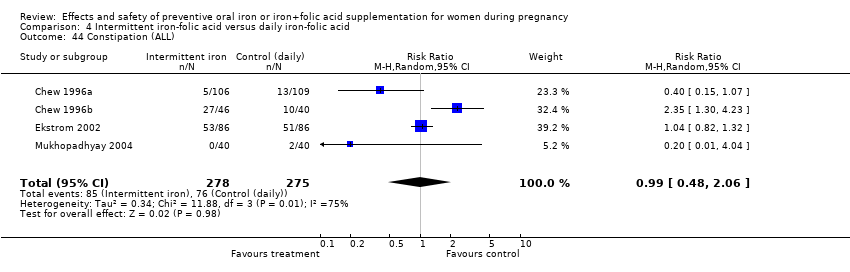
| 44 Constipation (ALL) Show forest plot | 4 | 1495 | Risk Ratio (M‐H, Random, 95% CI) | 0.95 [0.62, 1.43] |
|
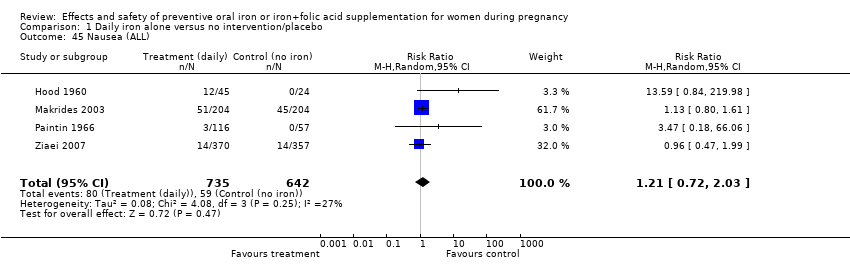
| 45 Nausea (ALL) Show forest plot | 4 | 1377 | Risk Ratio (M‐H, Random, 95% CI) | 1.21 [0.72, 2.03] |
|
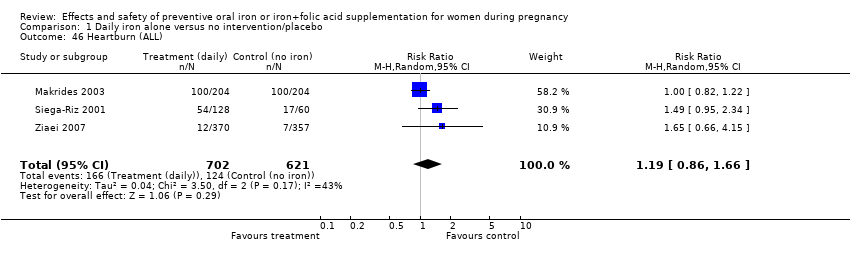
| 46 Heartburn (ALL) Show forest plot | 3 | 1323 | Risk Ratio (M‐H, Random, 95% CI) | 1.19 [0.86, 1.66] |
|
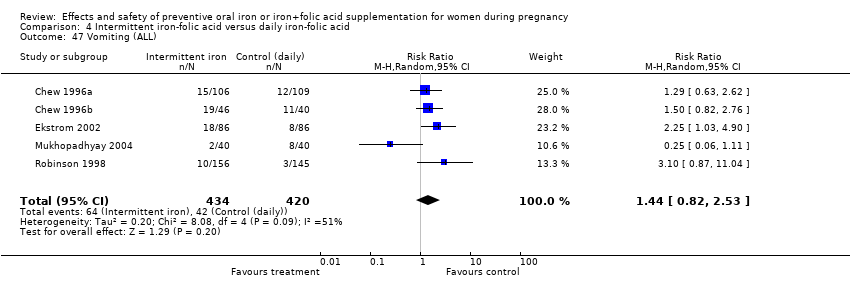
| 47 Vomiting (ALL) Show forest plot | 4 | 1392 | Risk Ratio (M‐H, Random, 95% CI) | 0.88 [0.59, 1.30] |
|
| 48 Maternal death (death while pregnant or within 42 days of termination of pregnancy) (ALL) Show forest plot | 1 | 47 | Risk Ratio (M‐H, Random, 95% CI) | 0.0 [0.0, 0.0] |
|
| 49 Maternal wellbeing/satisfaction (ALL) Show forest plot | 2 | 2604 | Risk Ratio (M‐H, Random, 95% CI) | 1.00 [0.91, 1.09] |
|
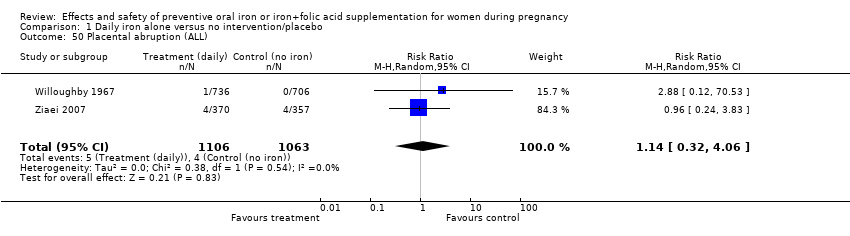
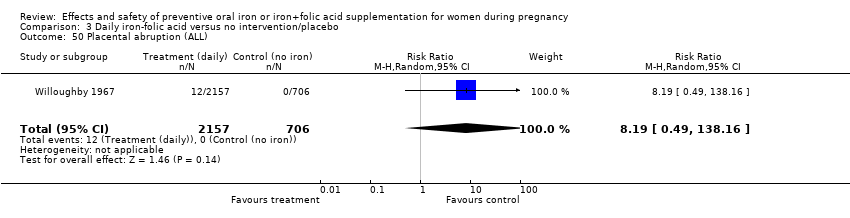
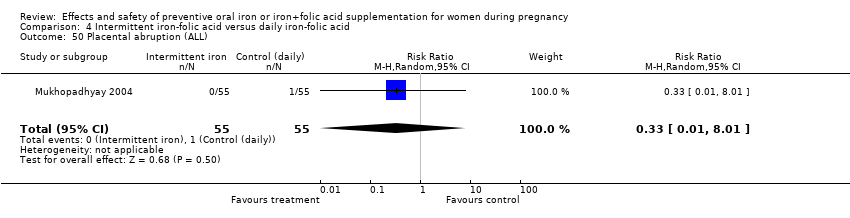
| 50 Placental abruption (ALL) Show forest plot | 2 | 2169 | Risk Ratio (M‐H, Random, 95% CI) | 1.14 [0.32, 4.06] |
|
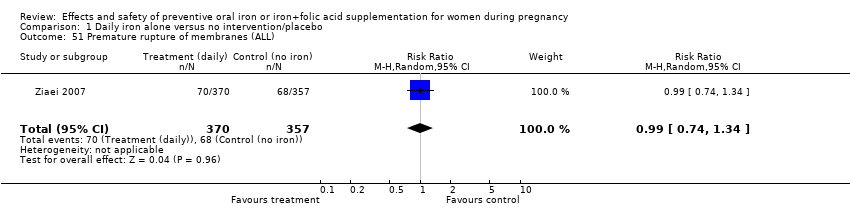
| 51 Premature rupture of membranes (ALL) Show forest plot | 1 | 727 | Risk Ratio (M‐H, Random, 95% CI) | 0.99 [0.74, 1.34] |
|
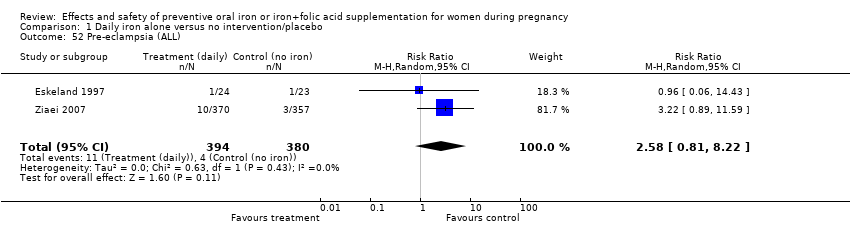
| 52 Pre‐eclampsia (ALL) Show forest plot | 2 | 774 | Risk Ratio (M‐H, Random, 95% CI) | 2.58 [0.81, 8.22] |
|
| 91 Small for gestational age (less than 10th percentile weight at birth for gestational age) (not pre‐specified) Show forest plot | 4 | 2511 | Risk Ratio (M‐H, Random, 95% CI) | 0.87 [0.58, 1.30] |
|
| 93 Cesarean delivery (not pre‐specified) Show forest plot | 7 | 4283 | Risk Ratio (M‐H, Random, 95% CI) | 0.94 [0.78, 1.13] |
|
| 94 Birth length in cm (not pre‐specified) Show forest plot | 5 | 2140 | Mean Difference (IV, Random, 95% CI) | 0.38 [0.10, 0.65] |
|
| 95 Forceps or vacuum delivery (not pre‐specified) Show forest plot | 2 | 477 | Risk Ratio (M‐H, Random, 95% CI) | 1.50 [0.94, 2.40] |
|
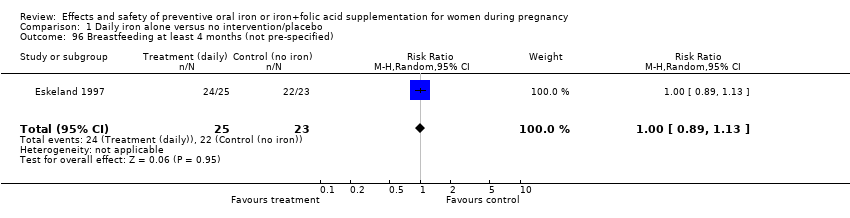
| 96 Breastfeeding at least 4 months (not pre‐specified) Show forest plot | 1 | 48 | Risk Ratio (M‐H, Random, 95% CI) | 1.00 [0.89, 1.13] |
|
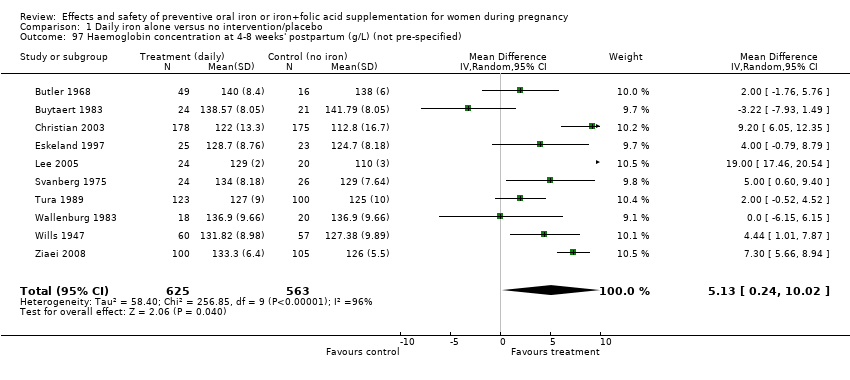
| 97 Haemoglobin concentration at 4‐8 weeks' postpartum (g/L) (not pre‐specified) Show forest plot | 10 | 1188 | Mean Difference (IV, Random, 95% CI) | 5.13 [0.24, 10.02] |
|
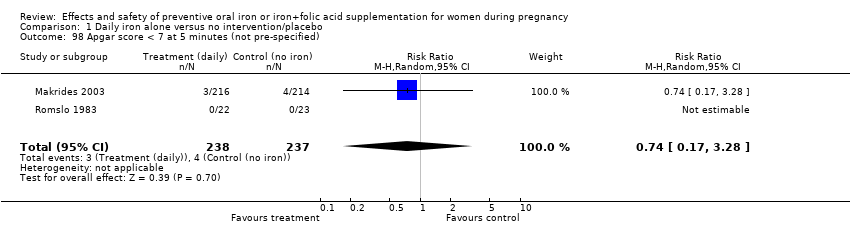
| 98 Apgar score < 7 at 5 minutes (not pre‐specified) Show forest plot | 2 | 475 | Risk Ratio (M‐H, Random, 95% CI) | 0.74 [0.17, 3.28] |
|
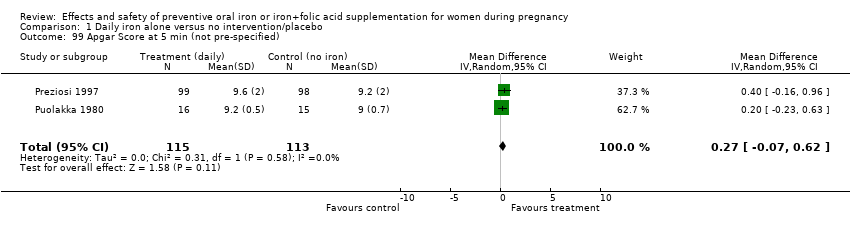
| 99 Apgar Score at 5 min (not pre‐specified) Show forest plot | 2 | 228 | Mean Difference (IV, Random, 95% CI) | 0.27 [‐0.07, 0.62] |
|