Intercambiadores de calor y humedad frente a humidificadores térmicos para adultos y niños ventilados mecánicamente
Información
- DOI:
- https://doi.org/10.1002/14651858.CD004711.pub3Copiar DOI

- Base de datos:
-
- Cochrane Database of Systematic Reviews
- Versión publicada:
-
- 14 septiembre 2017see what's new
- Tipo:
-
- Intervention
- Etapa:
-
- Review
- Grupo Editorial Cochrane:
-
Grupo Cochrane de Atención crítica y de emergencia
- Copyright:
-
- Copyright © 2018 The Cochrane Collaboration. Published by John Wiley & Sons, Ltd.
Cifras del artículo
Altmetric:
Citado por:
Autores
Contributions of authors
2017 Update
Co‐ordinating the review: Gillies D.
Screening search results: Gillies D, Todd D, Foster J, Batuwitage B.
Appraising quality of papers: Kelly MT, Gillies D, Todd D, Lockwood C.
Data extraction: Gillies D.
Writing to authors of papers for additional information: Gillies D.
Entering data into Review Manager: Gillies D.
Writing the review: Gillies D, Todd D, Foster J, Batuwitage B, Correia M, Carvalho R.
Guarantor for the review (one author): Gillies D.
People responsible for reading and checking review before submission: Gillies D, Todd D, Foster J, Batuwitage B.
Contributions of authors in original review (Kelly 2010a)
Developing protocol: Kelly MT, Gillies D, Todd D, Lockwood C.
Co‐ordinating the review: Kelly MT, Gillies D.
Screening search results: Kelly MT, Todd D, Lockwood C.
Organizing retrieval of papers: Kelly MT, Gillies D.
Screening retrieved papers against inclusion criteria: Kelly MT, Gillies D, Todd D, Lockwood C.
Data extraction: Kelly MT, Gillies D, Todd D, Lockwood C.
Writing to authors of papers for additional information: Kelly MT, Gillies D.
Entering data into Review Manager: Kelly MT, Gillies D.
Other statistical analysis not using RevMan: Kelly MT, Gillies D.
Writing the review: Kelly MT, Gillies D, Todd D.
Guarantor for the review (one author): Gillies D.
People responsible for reading and checking review before submission: Kelly MT, Gillies D.
Sources of support
Internal sources
-
The Children's Hospital at Westmead, Australia.
-
Sydney West Area Health Service, Australia.
External sources
-
No sources of support supplied
Declarations of interest
Donna Gillies: no conflict of interest.
David A Todd: no conflict of interest.
Jann P Foster: no conflict of interest.
Bisanth T Batuwitage: no conflict of interest.
Acknowledgements
We would like to thank Harald Herkner (content editor), Vibeke E Horstmann (statistical editor), Antonio M Esquinas (peer reviewer), Davide Chiumello (peer reviewer), Odie Geiger (consumer referee) for their help and editorial advice during the preparation of this updated systematic review.
We would like to thank and acknowledge the important role of Margaret Kelly and Catherine Lockwood as authors of the original review (Kelly 2010a). We would also like to thank and acknowledge Mariana Correia and Raul Carvalho for their assistance in translating and extracting data from Alcoforado 2012.
Version history
| Published | Title | Stage | Authors | Version |
| 2017 Sep 14 | Heat and moisture exchangers versus heated humidifiers for mechanically ventilated adults and children | Review | Donna Gillies, David A Todd, Jann P Foster, Bisanth T Batuwitage | |
| 2010 Apr 14 | Heated humidification versus heat and moisture exchangers for ventilated adults and children | Review | Margaret Kelly, Donna Gillies, David A Todd, Catherine Lockwood | |
| 2004 Jan 26 | Heated humidification versus heat and moisture exchangers for ventilated adults and children | Protocol | Margaret Kelly, Donna Gillies, David A Todd, Catherine Lockwood | |
Differences between protocol and review
We made the following changes to the published protocol (Kelly 2004)in the earlier version of the review (Kelly 2010a).
-
Moved mortality and pneumonia from secondary to primary outcomes.
-
In line with the new 'Risk of bias' table, added sequence generation to the assessed quality criteria.
-
There was significant heterogeneity between studies of people who had been ventilated for at least 48 hours compared to people ventilated for less than 48 hours. Therefore, a further analysis was conducted based on the types of HMEs, that is, whether they were hydrophobic or hygroscopic.
-
In the earlier version of the review (Kelly 2010a), we conducted the following subgroup analysis:
-
short‐term ventilation, defined as less than six hours;
-
medium‐term ventilation, defined as between six and 48 hours;
-
long‐term ventilation, defined as greater than 48 hours.
-
-
However, in this updated version of the review, the following additional changes were made:
-
The title was changed from "Heated humidification versus heat and moisture exchangers for mechanically ventilated adults and children" to "Heat and moisture exchangers versus heated humidifiers for mechanically ventilated adults and children." This was done because it was not clear in the original title that we were only including people who were undergoing invasive ventilation (though it was stated in the inclusion criteria). In addition, the order of heated humidification and heat and moisture exchangers was reversed because heat and moisture exchangers are treated as the intervention group in all analyses and therefore throughout the text.
We made the following changes to the published protocol (Kelly 2004), in the 2017 update:
-
Margaret Kelly and Catherine Lockwood, authors of the protocol and original review were no longer authors on this review update and there are two new authors, Jann P Foster and Bisanth T Batuwitage.
-
Incorporated a 'Summary of findings' table.
-
Modified the subgroup analysis for length of ventilation to the length of humidification, which was often, but not always, the same as the length of ventilation.
Keywords
MeSH
Medical Subject Headings (MeSH) Keywords
Medical Subject Headings Check Words
Adolescent; Adult; Child; Child, Preschool; Humans; Infant; Infant, Newborn; Young Adult;
PICO
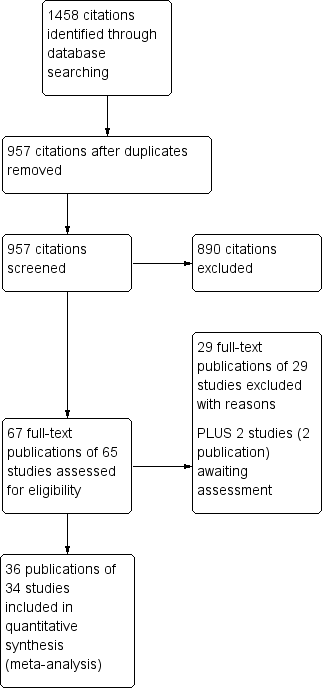
Study flow diagram.

Methodological quality graph: review authors' judgements about each methodological quality item presented as percentages across all included studies.

Methodological quality summary: review authors' judgements about each methodological quality item for each included study.
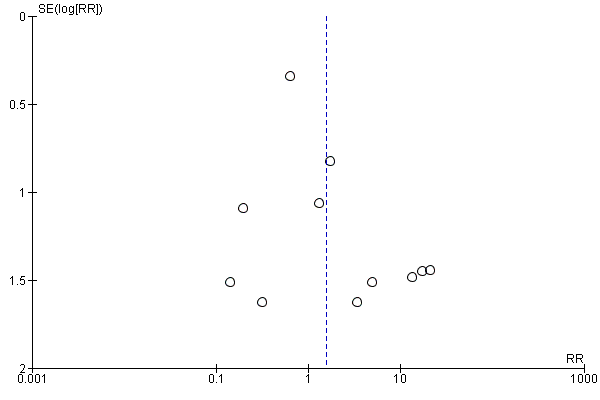
Funnel plot of comparison: 1 Heat and moisture exchanger (HME) versus heat humidifier (HH) ‐ parallel studies, outcome: 1.1 Artificial airway occlusion.
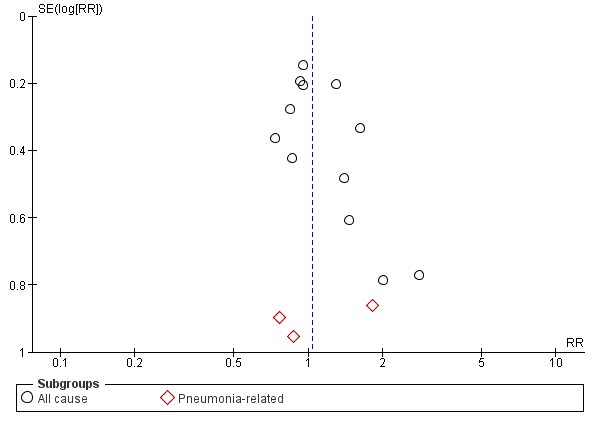
Funnel plot of comparison: 1 Heat and moisture exchanger (HME) versus heat humidifier (HH) ‐ parallel studies, outcome: 1.2 Mortality.
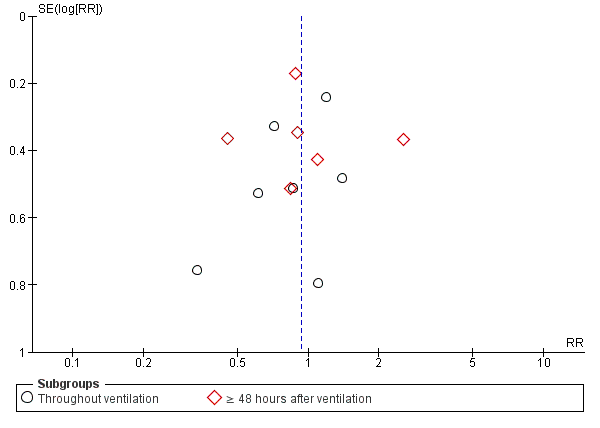
Funnel plot of comparison: 1 Heat and moisture exchanger (HME) versus heat humidifier (HH) ‐ parallel studies, outcome: 1.3 Pneumonia.

Comparison 1 Heat and moisture exchanger (HME) versus heat humidifier (HH) ‐ parallel studies, Outcome 1 Artificial airway occlusion.

Comparison 1 Heat and moisture exchanger (HME) versus heat humidifier (HH) ‐ parallel studies, Outcome 2 Mortality.

Comparison 1 Heat and moisture exchanger (HME) versus heat humidifier (HH) ‐ parallel studies, Outcome 3 Pneumonia.
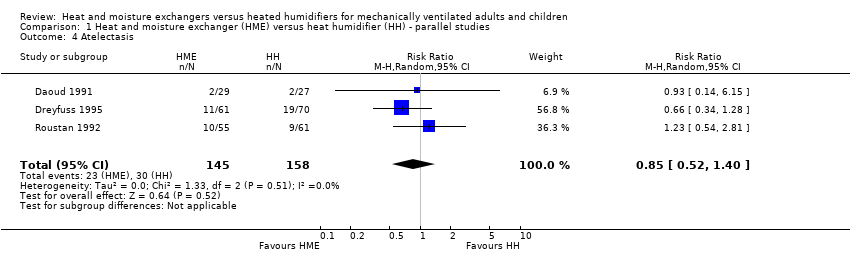
Comparison 1 Heat and moisture exchanger (HME) versus heat humidifier (HH) ‐ parallel studies, Outcome 4 Atelectasis.
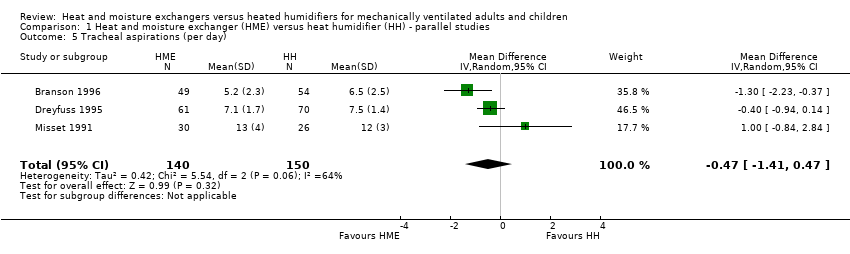
Comparison 1 Heat and moisture exchanger (HME) versus heat humidifier (HH) ‐ parallel studies, Outcome 5 Tracheal aspirations (per day).
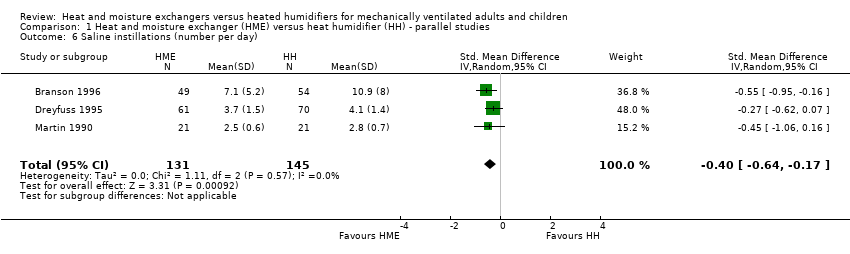
Comparison 1 Heat and moisture exchanger (HME) versus heat humidifier (HH) ‐ parallel studies, Outcome 6 Saline instillations (number per day).
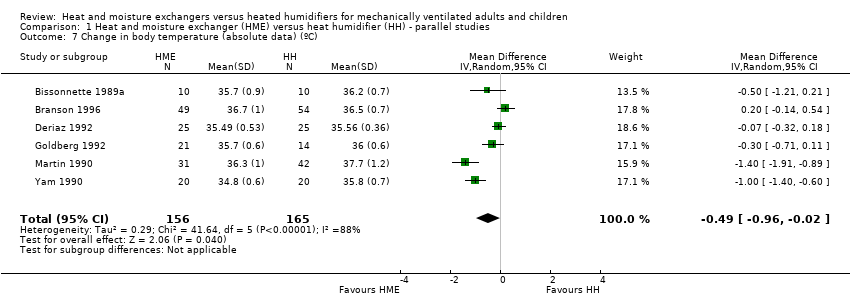
Comparison 1 Heat and moisture exchanger (HME) versus heat humidifier (HH) ‐ parallel studies, Outcome 7 Change in body temperature (absolute data) (ºC).
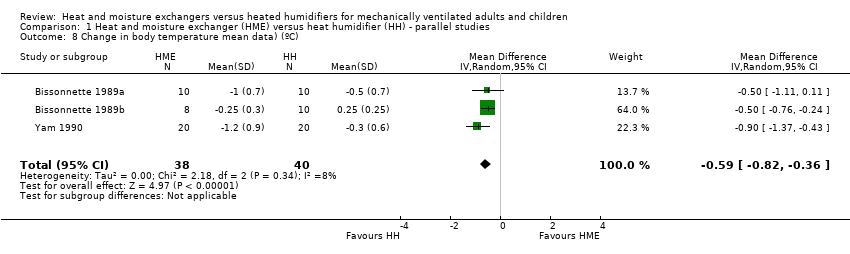
Comparison 1 Heat and moisture exchanger (HME) versus heat humidifier (HH) ‐ parallel studies, Outcome 8 Change in body temperature mean data) (ºC).
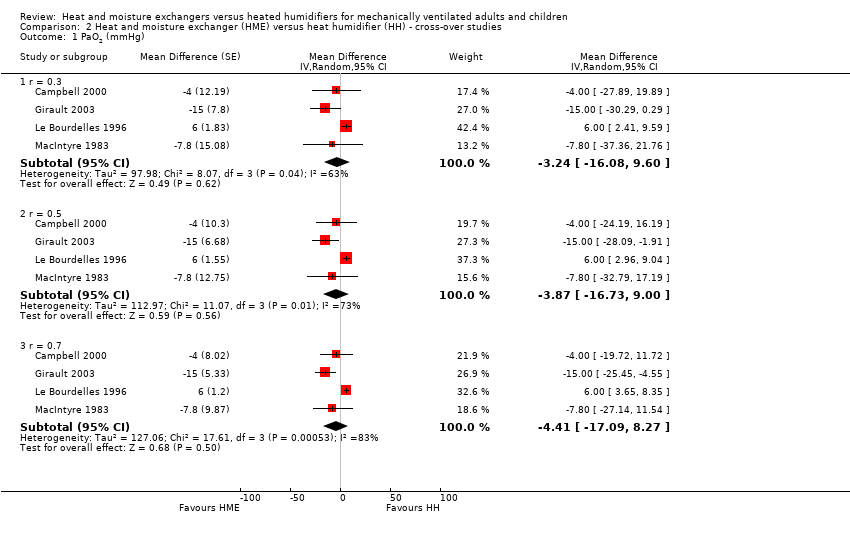
Comparison 2 Heat and moisture exchanger (HME) versus heat humidifier (HH) ‐ cross‐over studies, Outcome 1 PaO2 (mmHg).

Comparison 2 Heat and moisture exchanger (HME) versus heat humidifier (HH) ‐ cross‐over studies, Outcome 2 PaCO2 (mmHg).

Comparison 2 Heat and moisture exchanger (HME) versus heat humidifier (HH) ‐ cross‐over studies, Outcome 3 Breathing rate (breaths/minute).

Comparison 2 Heat and moisture exchanger (HME) versus heat humidifier (HH) ‐ cross‐over studies, Outcome 4 Tidal volume (L).
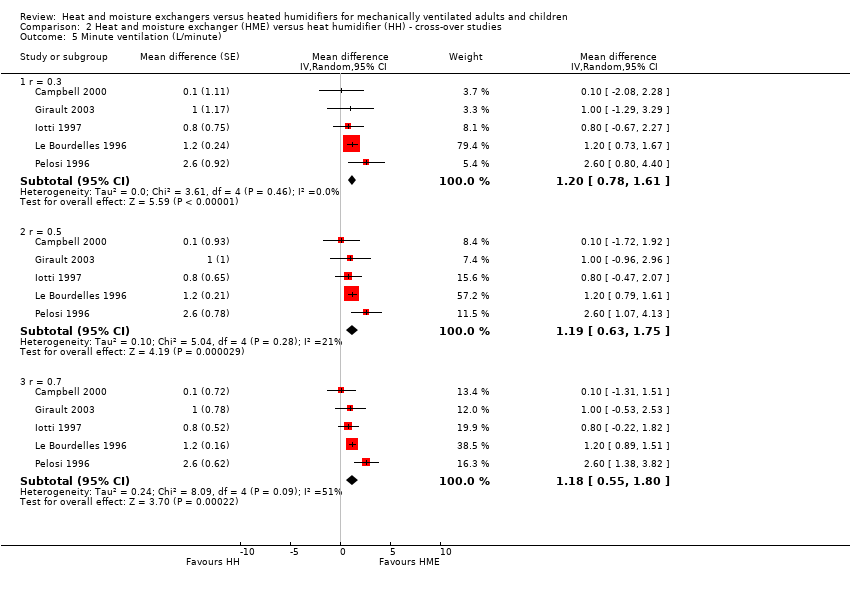
Comparison 2 Heat and moisture exchanger (HME) versus heat humidifier (HH) ‐ cross‐over studies, Outcome 5 Minute ventilation (L/minute).

Comparison 2 Heat and moisture exchanger (HME) versus heat humidifier (HH) ‐ cross‐over studies, Outcome 6 Body temperature (ºC).

Comparison 3 Subgroup analysis ‐ children versus adults, Outcome 1 Artificial airway occlusion.

Comparison 3 Subgroup analysis ‐ children versus adults, Outcome 2 All‐cause mortality.

Comparison 4 Subgroup analysis ‐ length of ventilation, Outcome 1 Artificial airway occlusion.

Comparison 4 Subgroup analysis ‐ length of ventilation, Outcome 2 All‐cause mortality.
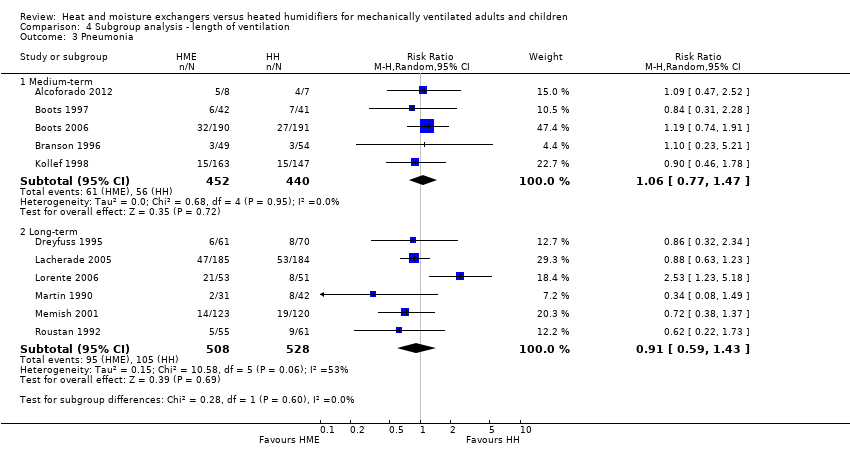
Comparison 4 Subgroup analysis ‐ length of ventilation, Outcome 3 Pneumonia.
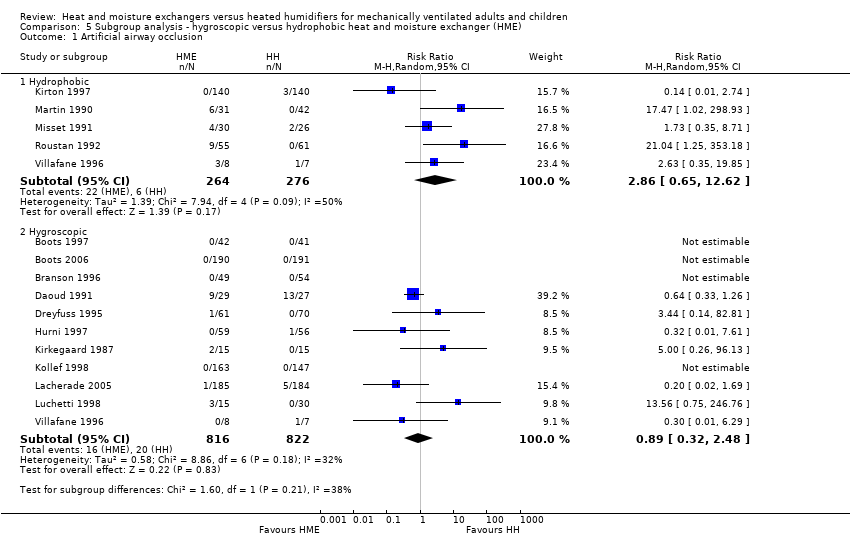
Comparison 5 Subgroup analysis ‐ hygroscopic versus hydrophobic heat and moisture exchanger (HME), Outcome 1 Artificial airway occlusion.

Comparison 5 Subgroup analysis ‐ hygroscopic versus hydrophobic heat and moisture exchanger (HME), Outcome 2 All‐cause mortality.
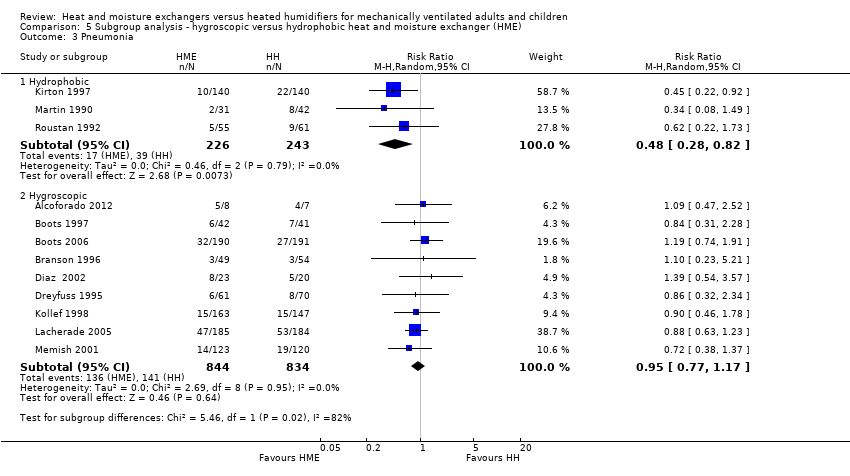
Comparison 5 Subgroup analysis ‐ hygroscopic versus hydrophobic heat and moisture exchanger (HME), Outcome 3 Pneumonia.
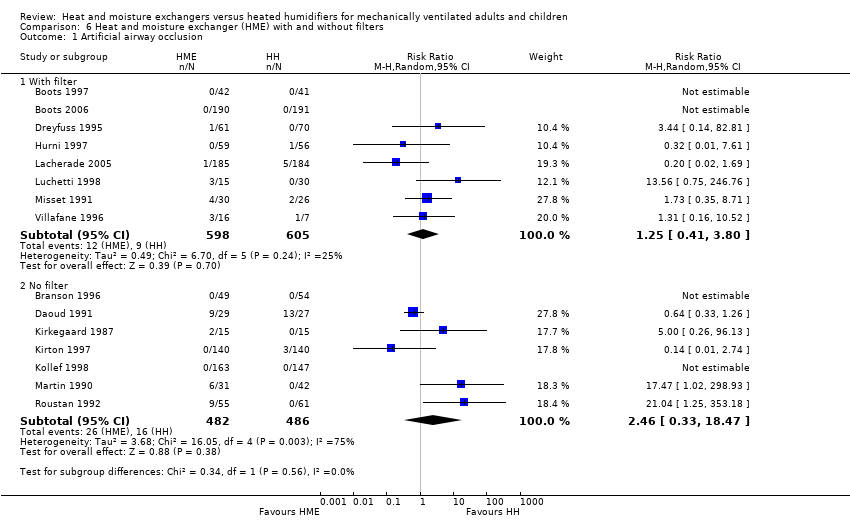
Comparison 6 Heat and moisture exchanger (HME) with and without filters, Outcome 1 Artificial airway occlusion.

Comparison 6 Heat and moisture exchanger (HME) with and without filters, Outcome 2 All‐cause mortality.

Comparison 6 Heat and moisture exchanger (HME) with and without filters, Outcome 3 Pneumonia.

Comparison 7 Sensitivity analyses ‐ selection bias, Outcome 1 Mortality.
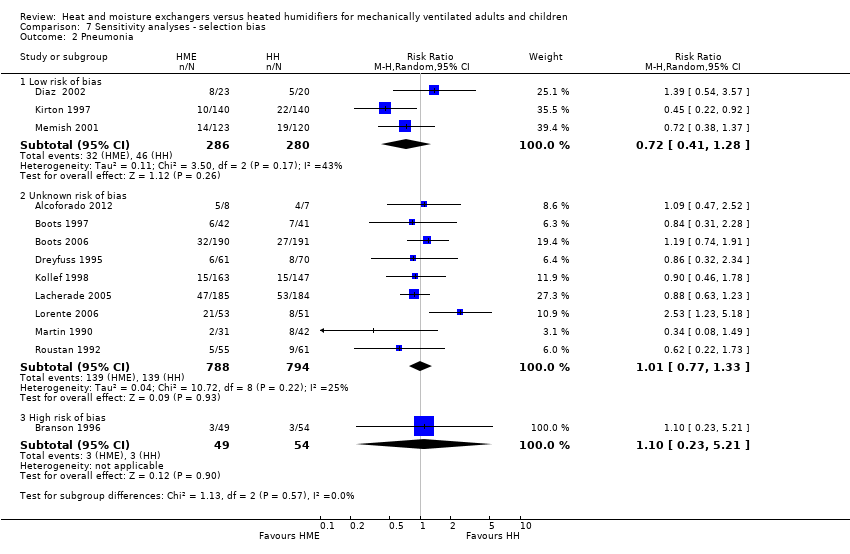
Comparison 7 Sensitivity analyses ‐ selection bias, Outcome 2 Pneumonia.

Comparison 8 Sensitivity analyses ‐ detection bias, Outcome 1 Artificial airway occlusion.
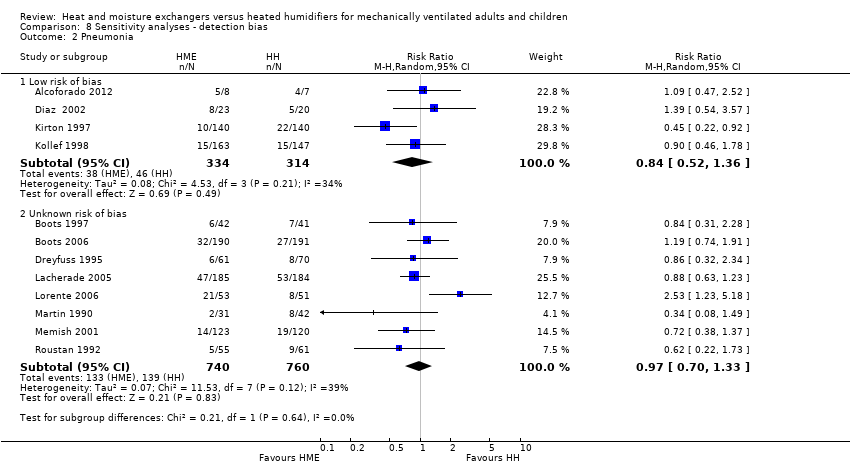
Comparison 8 Sensitivity analyses ‐ detection bias, Outcome 2 Pneumonia.
| Heat and moisture exchangers (HME) compared to heated humidifiers (HH) for ventilated adults and children | ||||||
| Patient or population: ventilated adults (18 trials) and children (1 trial) Settings: ICUs (17), NICU (1), and hospitals (1) in France (7), USA (3), Australia (2), Brazil (2), Denmark (1), Italy (1), Saudi Arabia (1), Spain (1), Switzerland (1) Intervention: HME Comparison: HH | ||||||
| Outcomes | Illustrative comparative risks* (95% CI) | Relative effect | No of participants | Quality of the evidence | Comments | |
| Assumed risk | Corresponding risk | |||||
| HH | HME | |||||
| Artificial airway occlusion (measured over 3‐15 days (median 4 days)) | 23 per 1000 | 37 per 1000 | RR 1.59 | 2171 | ⊕⊕⊝⊝ 1 L ow | Allocation and blinding unclear in 13 studies; moderate heterogeneity. |
| Mortality ‐ all cause (Measured over 3‐15 days (median 8 days)) | 247 per 1000 | 257 per 1000 | RR 1.03 | 1951 | ⊕⊕⊝⊝ 2 L ow | Allocation and blinding unclear in 9 and 11 studies; low heterogeneity. |
| Pneumonia (Measured over 4‐21 days (median 4 days)) | 32 per 1000 | 30 per 1000 | RR 0.93 | 2251 | ⊕⊕⊝⊝ 3 L ow | Allocation and blinding unclear in more than half of studies; moderate heterogeneity though this was due to only 1 study. |
| *The basis for the assumed risk (e.g. the median control group risk across studies) is provided in footnotes. The corresponding risk (and its 95% confidence interval) is based on the assumed risk in the comparison group and the relative effect of the intervention (and its 95% CI). | ||||||
| GRADE Working Group grades of evidence | ||||||
| The assumed and corresponding risks were calculated from data in included trials. 1 Quality downgraded two levels for serious indirectness because participants may not have been considered suitable for HME in three studies and could be taken out of the HME group in three studies. 2 Quality downgraded two levels for serious indirectness because participants may not have been considered suitable for HME in two studies and could be taken out of the HME group in three studies. 3 Quality downgraded two levels for serious indirectness because participants may not have been considered suitable for HME in two studies and could be taken out of the HME group in three studies. | ||||||
| Study | HH | HME | No of participants |
| 9 | 7 | 381 | |
| 4 | 4 | 43 | |
| 13.80 | 11.10 | 104 | |
| 5.30 | 5.70 | 310 | |
| 25.3 | 21.4 | 369 | |
| 9.30 | 13.90 | 116 | |
| HH: heated humidification; HME: heat and moisture exchangers. | |||
| Study | HH | HME | No of participants |
| 11 | 10 | 43 | |
| 16.50 | 16.50 | 310 | |
| HH: heated humidification; HME: heat and moisture exchangers. | |||
| Study | HME | HH | Units | Participants |
| 6.72 | 8.20 | AUD/day | 83 | |
| 8.62 | 9.27 | AUD/day | 381 | |
| 4.70 | 8.97 | USD/day | 99 | |
| 5.00 | 11.00 | USD/day (France) | 131 | |
| 17.46 | 27.80 | USD/participant | 280 | |
| 15.98 | 38.26 | USD/participant | 310 | |
| HH: heated humidification; HME: heat and moisture exchangers. | ||||
| Study | HH | HME | Participants |
| 9.86 | 16.50 | 11 | |
| 13.6 | 20.8 | 10 | |
| HH: heated humidification; HME: heat and moisture exchangers. | |||
| Outcome or subgroup title | No. of studies | No. of participants | Statistical method | Effect size |
| 1 Artificial airway occlusion Show forest plot | 15 | 2171 | Risk Ratio (M‐H, Random, 95% CI) | 1.59 [0.60, 4.19] |
| 2 Mortality Show forest plot | 12 | Risk Ratio (M‐H, Random, 95% CI) | Subtotals only | |
| 2.1 All cause | 12 | 1951 | Risk Ratio (M‐H, Random, 95% CI) | 1.03 [0.89, 1.20] |
| 2.2 Pneumonia‐related | 3 | 484 | Risk Ratio (M‐H, Random, 95% CI) | 1.09 [0.39, 3.01] |
| 3 Pneumonia Show forest plot | 13 | 2251 | Risk Ratio (M‐H, Random, 95% CI) | 0.93 [0.73, 1.19] |
| 3.1 Throughout ventilation | 7 | 1090 | Risk Ratio (M‐H, Random, 95% CI) | 0.94 [0.69, 1.27] |
| 3.2 ≥ 48 hours after ventilation | 6 | 1161 | Risk Ratio (M‐H, Random, 95% CI) | 0.96 [0.64, 1.46] |
| 4 Atelectasis Show forest plot | 3 | 303 | Risk Ratio (M‐H, Random, 95% CI) | 0.85 [0.52, 1.40] |
| 5 Tracheal aspirations (per day) Show forest plot | 3 | 290 | Mean Difference (IV, Random, 95% CI) | ‐0.47 [‐1.41, 0.47] |
| 6 Saline instillations (number per day) Show forest plot | 3 | 276 | Std. Mean Difference (IV, Random, 95% CI) | ‐0.40 [‐0.64, ‐0.17] |
| 7 Change in body temperature (absolute data) (ºC) Show forest plot | 6 | 321 | Mean Difference (IV, Random, 95% CI) | ‐0.49 [‐0.96, ‐0.02] |
| 8 Change in body temperature mean data) (ºC) Show forest plot | 3 | 78 | Mean Difference (IV, Random, 95% CI) | ‐0.59 [‐0.82, ‐0.36] |
| Outcome or subgroup title | No. of studies | No. of participants | Statistical method | Effect size |
| 1 PaO2 (mmHg) Show forest plot | 4 | Mean Difference (Random, 95% CI) | Subtotals only | |
| 1.1 r = 0.3 | 4 | Mean Difference (Random, 95% CI) | ‐3.24 [‐16.08, 9.60] | |
| 1.2 r = 0.5 | 4 | Mean Difference (Random, 95% CI) | ‐3.87 [‐16.73, 9.00] | |
| 1.3 r = 0.7 | 4 | Mean Difference (Random, 95% CI) | ‐4.41 [‐17.09, 8.27] | |
| 2 PaCO2 (mmHg) Show forest plot | 5 | Mean Difference (Random, 95% CI) | Subtotals only | |
| 2.1 r = 0.3 | 5 | Mean Difference (Random, 95% CI) | 1.93 [0.27, 3.59] | |
| 2.2 r = 0.5 | 5 | Mean Difference (Random, 95% CI) | 2.02 [0.19, 3.85] | |
| 2.3 r = 0.7 | 5 | Mean Difference (Random, 95% CI) | 2.21 [0.33, 4.09] | |
| 3 Breathing rate (breaths/minute) Show forest plot | 4 | Mean Difference (Random, 95% CI) | Subtotals only | |
| 3.1 r = 0.3 | 4 | Mean Difference (Random, 95% CI) | 1.40 [0.33, 2.46] | |
| 3.2 r = 0.5 | 4 | Mean Difference (Random, 95% CI) | 1.15 [‐0.13, 2.44] | |
| 3.3 r = 0.7 | 4 | Mean Difference (Random, 95% CI) | 1.02 [‐0.38, 2.41] | |
| 4 Tidal volume (L) Show forest plot | 5 | Mean difference (Random, 95% CI) | Subtotals only | |
| 4.1 r = 0.3 | 5 | Mean difference (Random, 95% CI) | 0.02 [‐0.00, 0.03] | |
| 4.2 r = 0.5 | 5 | Mean difference (Random, 95% CI) | 0.02 [0.00, 0.04] | |
| 4.3 r = 0.7 | 5 | Mean difference (Random, 95% CI) | 0.03 [0.01, 0.06] | |
| 5 Minute ventilation (L/minute) Show forest plot | 5 | Mean difference (Random, 95% CI) | Subtotals only | |
| 5.1 r = 0.3 | 5 | Mean difference (Random, 95% CI) | 1.20 [0.78, 1.61] | |
| 5.2 r = 0.5 | 5 | Mean difference (Random, 95% CI) | 1.19 [0.63, 1.75] | |
| 5.3 r = 0.7 | 5 | Mean difference (Random, 95% CI) | 1.18 [0.55, 1.80] | |
| 6 Body temperature (ºC) Show forest plot | 2 | Mean Difference (Random, 95% CI) | Subtotals only | |
| 6.1 r = 0.3 | 2 | Mean Difference (Random, 95% CI) | ‐1.12 [‐3.77, 1.52] | |
| 6.2 r = 0.5 | 2 | Mean Difference (Random, 95% CI) | ‐1.13 [‐3.77, 1.52] | |
| 6.3 r = 0.7 | 2 | Mean Difference (Random, 95% CI) | ‐1.13 [‐3.78, 1.51] | |
| Outcome or subgroup title | No. of studies | No. of participants | Statistical method | Effect size |
| 1 Artificial airway occlusion Show forest plot | 15 | Risk Ratio (M‐H, Random, 95% CI) | Subtotals only | |
| 1.1 Children | 1 | 56 | Risk Ratio (M‐H, Random, 95% CI) | 0.64 [0.33, 1.26] |
| 1.2 Adults | 14 | 2115 | Risk Ratio (M‐H, Random, 95% CI) | 1.94 [0.65, 5.76] |
| 2 All‐cause mortality Show forest plot | 12 | Risk Ratio (M‐H, Random, 95% CI) | Subtotals only | |
| 2.1 Children | 1 | 56 | Risk Ratio (M‐H, Random, 95% CI) | 2.79 [0.62, 12.67] |
| 2.2 Adults | 11 | 1895 | Risk Ratio (M‐H, Random, 95% CI) | 1.02 [0.88, 1.19] |
| Outcome or subgroup title | No. of studies | No. of participants | Statistical method | Effect size |
| 1 Artificial airway occlusion Show forest plot | 15 | Risk Ratio (M‐H, Random, 95% CI) | Subtotals only | |
| 1.1 Medium‐term | 8 | 1031 | Risk Ratio (M‐H, Random, 95% CI) | 1.74 [0.41, 7.30] |
| 1.2 Long‐term | 7 | 1140 | Risk Ratio (M‐H, Random, 95% CI) | 1.47 [0.34, 6.36] |
| 2 All‐cause mortality Show forest plot | 11 | Risk Ratio (M‐H, Random, 95% CI) | Subtotals only | |
| 2.1 Medium‐term | 5 | 860 | Risk Ratio (M‐H, Random, 95% CI) | 1.01 [0.78, 1.31] |
| 2.2 Long‐term | 6 | 1048 | Risk Ratio (M‐H, Random, 95% CI) | 1.03 [0.85, 1.25] |
| 3 Pneumonia Show forest plot | 11 | Risk Ratio (M‐H, Random, 95% CI) | Subtotals only | |
| 3.1 Medium‐term | 5 | 892 | Risk Ratio (M‐H, Random, 95% CI) | 1.06 [0.77, 1.47] |
| 3.2 Long‐term | 6 | 1036 | Risk Ratio (M‐H, Random, 95% CI) | 0.91 [0.59, 1.43] |
| Outcome or subgroup title | No. of studies | No. of participants | Statistical method | Effect size |
| 1 Artificial airway occlusion Show forest plot | 15 | Risk Ratio (M‐H, Random, 95% CI) | Subtotals only | |
| 1.1 Hydrophobic | 5 | 540 | Risk Ratio (M‐H, Random, 95% CI) | 2.86 [0.65, 12.62] |
| 1.2 Hygroscopic | 11 | 1638 | Risk Ratio (M‐H, Random, 95% CI) | 0.89 [0.32, 2.48] |
| 2 All‐cause mortality Show forest plot | 11 | Risk Ratio (M‐H, Random, 95% CI) | Subtotals only | |
| 2.1 Hydrophobic | 2 | 189 | Risk Ratio (M‐H, Random, 95% CI) | 0.79 [0.46, 1.35] |
| 2.2 Hygroscopic | 9 | 1719 | Risk Ratio (M‐H, Random, 95% CI) | 1.05 [0.89, 1.23] |
| 3 Pneumonia Show forest plot | 12 | Risk Ratio (M‐H, Random, 95% CI) | Subtotals only | |
| 3.1 Hydrophobic | 3 | 469 | Risk Ratio (M‐H, Random, 95% CI) | 0.48 [0.28, 0.82] |
| 3.2 Hygroscopic | 9 | 1678 | Risk Ratio (M‐H, Random, 95% CI) | 0.95 [0.77, 1.17] |
| Outcome or subgroup title | No. of studies | No. of participants | Statistical method | Effect size |
| 1 Artificial airway occlusion Show forest plot | 15 | Risk Ratio (M‐H, Random, 95% CI) | Subtotals only | |
| 1.1 With filter | 8 | 1203 | Risk Ratio (M‐H, Random, 95% CI) | 1.25 [0.41, 3.80] |
| 1.2 No filter | 7 | 968 | Risk Ratio (M‐H, Random, 95% CI) | 2.46 [0.33, 18.47] |
| 2 All‐cause mortality Show forest plot | 12 | Risk Ratio (M‐H, Random, 95% CI) | Subtotals only | |
| 2.1 With filter | 5 | 1080 | Risk Ratio (M‐H, Random, 95% CI) | 1.00 [0.82, 1.22] |
| 2.2 No filter | 7 | 871 | Risk Ratio (M‐H, Random, 95% CI) | 1.08 [0.85, 1.36] |
| 3 Pneumonia Show forest plot | 13 | Risk Ratio (M‐H, Random, 95% CI) | Subtotals only | |
| 3.1 With filter | 5 | 979 | Risk Ratio (M‐H, Random, 95% CI) | 0.97 [0.76, 1.24] |
| 3.2 no filter | 8 | 1272 | Risk Ratio (M‐H, Random, 95% CI) | 0.88 [0.55, 1.38] |
| Outcome or subgroup title | No. of studies | No. of participants | Statistical method | Effect size |
| 1 Mortality Show forest plot | 12 | Risk Ratio (M‐H, Random, 95% CI) | Subtotals only | |
| 1.1 Low risk of bias | 2 | 286 | Risk Ratio (M‐H, Random, 95% CI) | 1.31 [0.91, 1.90] |
| 1.2 Unknown risk of bias | 10 | 1665 | Risk Ratio (M‐H, Random, 95% CI) | 0.98 [0.83, 1.16] |
| 2 Pneumonia Show forest plot | 13 | Risk Ratio (M‐H, Random, 95% CI) | Subtotals only | |
| 2.1 Low risk of bias | 3 | 566 | Risk Ratio (M‐H, Random, 95% CI) | 0.72 [0.41, 1.28] |
| 2.2 Unknown risk of bias | 9 | 1582 | Risk Ratio (M‐H, Random, 95% CI) | 1.01 [0.77, 1.33] |
| 2.3 High risk of bias | 1 | 103 | Risk Ratio (M‐H, Random, 95% CI) | 1.10 [0.23, 5.21] |
| Outcome or subgroup title | No. of studies | No. of participants | Statistical method | Effect size |
| 1 Artificial airway occlusion Show forest plot | 15 | 2171 | Risk Ratio (M‐H, Random, 95% CI) | 1.59 [0.60, 4.19] |
| 1.1 Low risk of bias | 2 | 590 | Risk Ratio (M‐H, Random, 95% CI) | 0.14 [0.01, 2.74] |
| 1.2 Unclear risk of bias | 13 | 1581 | Risk Ratio (M‐H, Random, 95% CI) | 1.92 [0.69, 5.34] |
| 2 Pneumonia Show forest plot | 12 | Risk Ratio (M‐H, Random, 95% CI) | Subtotals only | |
| 2.1 Low risk of bias | 4 | 648 | Risk Ratio (M‐H, Random, 95% CI) | 0.84 [0.52, 1.36] |
| 2.2 Unknown risk of bias | 8 | 1500 | Risk Ratio (M‐H, Random, 95% CI) | 0.97 [0.70, 1.33] |