Intercambiadores de calor y humedad frente a humidificadores térmicos para adultos y niños ventilados mecánicamente
Resumen
Antecedentes
La ventilación invasiva se utiliza para ayudar o reemplazar la respiración cuando una persona no puede respirar adecuadamente por sí misma. Debido a que la vía respiratoria superior se desvía durante la ventilación mecánica, el sistema respiratorio ya no es capaz de calentar y humedecer los gases inhalados, lo que puede causar problemas respiratorios adicionales en las personas que ya requieren respiración asistida. Para prevenir estos problemas, los gases se calientan y humedecen artificialmente. Hay dos formas principales de humidificación, los intercambiadores de calor y humedad (ICH) o los humidificadores de calor (HC). Ambas se asocian con beneficios y ventajas potenciales, pero no está claro si los ICH o los HC son más eficaces para prevenir algunos de los resultados negativos asociados con la ventilación mecánica. Esta revisión fue publicada originalmente en 2010 y se actualizó en 2017.
Objetivos
Evaluar si los intercambiadores de calor y humedad o los humidificadores térmicos son más eficaces para prevenir las complicaciones en las personas que reciben ventilación mecánica invasiva e identificar si el grupo etario de los participantes, la duración de la humidificación, el tipo de ICH y la ventilación administrada por medio de una traqueostomía tuvieron un efecto en estos resultados.
Métodos de búsqueda
Se realizaron búsquedas en el Registro Cochrane Central de Ensayos Controlados (Cochrane Central Register of Controlled Trials, CENTRAL), MEDLINE, Embase y CINAHL hasta mayo de 2017 para identificar ensayos controlados aleatorizados (ECA) y listas de referencias de los estudios incluidos y las revisiones pertinentes. No hubo restricciones de idioma.
Criterios de selección
Se incluyeron ECA que comparaban los ICH con los HC en adultos y niños que recibían ventilación invasiva. Se incluyeron estudios aleatorizados cruzados.
Obtención y análisis de los datos
Se evaluó la calidad de cada estudio y se extrajeron los datos relevantes. Siempre que fue posible, se analizaron los datos mediante un metanálisis. Para los resultados dicotómicos, se calculó el riesgo relativo (RR) y el intervalo de confianza del 95% (IC del 95%). Para los resultados continuos, se calculó la diferencia de medias (DM) y el IC del 95% o la diferencia de medias estandarizada (DME) y el IC del 95% para los estudios paralelos. Para los ensayos cruzados, se calculó la DM y el IC del 95% utilizando estimaciones de correlación para corregir los análisis emparejados. El objetivo era realizar análisis de subgrupos basados en el grupo etario de los participantes, el tiempo que recibieron la humidificación, el tipo de ICH y si la ventilación se administraba mediante una traqueotomía. También se realizó un análisis de sensibilidad para identificar si la calidad de los ensayos tenía un efecto en los hallazgos meta‐analíticos.
Resultados principales
Se incluyeron 34 ensayos con 2848 participantes; 26 estudios fueron de diseño de grupos paralelos (2725 participantes) y ocho utilizaron un diseño cruzado (123 participantes). Sólo tres estudios incluidos informaron datos de neonatos o niños. Hay otros dos estudios (76 participantes) que están a la espera de ser clasificados.
No hubo diferencias estadísticas generales en la oclusión de las vías respiratorias artificiales (RR 1,59; IC del 95%: 0,60 a 4,19; participantes = 2171; estudios = 15; I2 = 54%), la mortalidad (RR 1,03; IC del 95%: 0,89 a 1,20; participantes = 1951; estudios = 12; I2 = 0%) o la neumonía (RR 0,93; IC del 95%: 0,73 a 1,19; participantes = 2251; estudios = 13; I2 = 27%). Hubo alguna evidencia de que los ICH hidrófobos pueden reducir el riesgo de neumonía en comparación con los HC (RR 0,48; IC del 95%: 0,28 a 0,82; participantes = 469; estudios = 3; I2 = 0%).
La calidad general de la evidencia según el sistema GRADE fue baja. Aunque el riesgo metodológico general de sesgo no estaba claro en lo que respecta a la selección y detección de sesgos y el bajo riesgo para el seguimiento, la selección de los participantes en el estudio que se consideraron aptos para la ICH y en algunos estudios que retiraron participantes del grupo de la ICH hicieron que las conclusiones de esta revisión fueran difíciles de generalizar.
Conclusiones de los autores
La evidencia disponible no indica ninguna diferencia entre los ICH y los HC sobre los resultados principales de las obstrucciones de las vías respiratorias, la neumonía y la mortalidad. Sin embargo, la baja calidad general de esta evidencia hace que sea difícil confiar en estos hallazgos. Es necesario seguir investigando para comparar las ICH con las HC, en particular en las poblaciones pediátricas y neonatales, pero también es necesario investigar para comparar más eficazmente los diferentes tipos de ICH entre sí, así como los diferentes tipos de HC.
PICOs
Resumen en términos sencillos
Intercambiadores de calor y humedad comparados con humidificadores térmicos para adultos y niños ventilados
Pregunta de la revisión
Son los intercambiadores de calor y humedad o los humidificadores térmicos más eficaces para prevenir complicaciones como las obstrucciones de las vías respiratorias y la neumonía en adultos, niños o bebés que reciben ventilación mecánica invasiva.
Antecedentes
Cuando se utiliza ventilación mecánica para mantener la respiración efectiva de los pacientes críticamente enfermos, las vías respiratorias superiores se deben humedecer por medios artificiales. Los intercambiadores de calor y humedad y los humidificadores térmicos son los métodos más utilizados de humidificación artificial. Ambas se han asociado con ventajas y desventajas específicas; por ejemplo, se cree que los intercambiadores de calor y humedad tienen más probabilidades de causar obstrucción de las vías respiratorias, mientras que los humidificadores térmicos se han asociado con un mayor riesgo de neumonía (hinchazón (inflamación) del tejido en uno o ambos pulmones).
Características de los estudios
Se buscaron estudios hasta mayo de 2017. Se incluyeron 34 ensayos en la revisión, con 2848 participantes de 12 países. La mayoría de los ensayos (27) se realizaron en una unidad de cuidados intensivos y uno en una unidad de cuidados intensivos neonatales. Los restante siete estudios se hicieron en un departamento de cirugía. Los participantes eran lactantes en tres estudios con adultos (edad media de 40 a 69 años) en el resto.
Resultados clave
No hubo ninguna diferencia general en las tasas de obstrucción de las vías respiratorias, neumonía o muerte en los adultos que se ventilaron mediante intercambiadores de calor y humedad en comparación con los adultos ventilados mediante un humidificador térmico. Hubo alguna evidencia de que la incidencia de la neumonía puede reducirse mediante el uso de intercambiadores de calor y humedad que capturan menos humedad. No se disponía de información suficiente para sacar conclusiones sobre ninguno de estos métodos en niños o lactantes.
Calidad de la evidencia
La baja calidad general de esta evidencia fue baja, lo que hace difícil tener confianza en estos hallazgos.
Authors' conclusions
Summary of findings
| Heat and moisture exchangers (HME) compared to heated humidifiers (HH) for ventilated adults and children | ||||||
| Patient or population: ventilated adults (18 trials) and children (1 trial) Settings: ICUs (17), NICU (1), and hospitals (1) in France (7), USA (3), Australia (2), Brazil (2), Denmark (1), Italy (1), Saudi Arabia (1), Spain (1), Switzerland (1) Intervention: HME Comparison: HH | ||||||
| Outcomes | Illustrative comparative risks* (95% CI) | Relative effect | No of participants | Quality of the evidence | Comments | |
| Assumed risk | Corresponding risk | |||||
| HH | HME | |||||
| Artificial airway occlusion (measured over 3‐15 days (median 4 days)) | 23 per 1000 | 37 per 1000 | RR 1.59 | 2171 | ⊕⊕⊝⊝ 1 L ow | Allocation and blinding unclear in 13 studies; moderate heterogeneity. |
| Mortality ‐ all cause (Measured over 3‐15 days (median 8 days)) | 247 per 1000 | 257 per 1000 | RR 1.03 | 1951 | ⊕⊕⊝⊝ 2 L ow | Allocation and blinding unclear in 9 and 11 studies; low heterogeneity. |
| Pneumonia (Measured over 4‐21 days (median 4 days)) | 32 per 1000 | 30 per 1000 | RR 0.93 | 2251 | ⊕⊕⊝⊝ 3 L ow | Allocation and blinding unclear in more than half of studies; moderate heterogeneity though this was due to only 1 study. |
| *The basis for the assumed risk (e.g. the median control group risk across studies) is provided in footnotes. The corresponding risk (and its 95% confidence interval) is based on the assumed risk in the comparison group and the relative effect of the intervention (and its 95% CI). | ||||||
| GRADE Working Group grades of evidence | ||||||
| The assumed and corresponding risks were calculated from data in included trials. 1 Quality downgraded two levels for serious indirectness because participants may not have been considered suitable for HME in three studies and could be taken out of the HME group in three studies. 2 Quality downgraded two levels for serious indirectness because participants may not have been considered suitable for HME in two studies and could be taken out of the HME group in three studies. 3 Quality downgraded two levels for serious indirectness because participants may not have been considered suitable for HME in two studies and could be taken out of the HME group in three studies. | ||||||
Background
Description of the condition
Mechanical ventilation is used to assist or replace breathing when a person is unable to breathe adequately on their own (AARC 2012). Mechanical ventilation is provided through an endotracheal tube (ETT) inserted into the trachea through the mouth or nose, or directly into the trachea through a surgical incision known as a tracheostomy and now more commonly through a technique known as percutaneous dilatational tracheostomy which can be conducted at the bedside using a guidewire and tracheal inflation (Mehta 2017).
Because the upper airway is bypassed during mechanical ventilation, the respiratory system is no longer able to warm and moisten inhaled gases (Al Ashry 2014; Schiffmann 2006). The consequent delivery of cooler and dryer gases can cause a range of problems including decreased body temperature, increased difficulty in breathing and airway obstruction in people who already require assisted breathing (AARC 2012). To prevent these problems, humidification is routinely provided for people who receive invasive mechanical ventilation (Branson 2007).
Description of the intervention
The two main forms of humidification used during mechanical ventilation are active or passive.
Active humidification is provided by a heated humidifier (HH), which warms and moistens gases as they pass over the surface of a heated water reservoir attached to the ventilator. The system may also have a heated wire in the inspiratory limb of the ventilator circuit to prevent the warmed air cooling and condensing as it moves from the reservoir to the person (Al Ashry 2014).
Inhaled gases may also be passively humidified with a heat and moisture exchanger (HME). This device contains a condenser, which retains heat and moisture from every exhaled breath and returns it back to the person in the inspired breath (Al Ashry 2014). Because there are concerns that the performance of HMEs decrease with prolonged use, most manufacturers recommend changing HMEs every 24 hours (AARC 2012).
The type of condenser used in an HME varies. They can be hydrophobic, hygroscopic or combined condensers (AARC 2012; Al Ashry 2014). In hydrophobic HMEs, the condenser is made of a water repelling element. Hygroscopic condensers are based on salts (such as calcium or lithium chloride) which absorb water vapour during expiration and release it during inspiration. In combination HMEs, a hygroscopic salt is added inside the hydrophobic HME.
HMEs may have filters which prevent viruses or bacteria from inspired air reaching the person's airway (Al Ashry 2014).
An active heated water source can be added to HMEs converting them from passive to active, increasing their humidification capacity. Another active HME model releases heat through chemical reactions with exhaled carbon dioxide (AARC 2012).
Why it is important to do this review
Ventilator‐associated pneumonia (VAP) is a major source of morbidity and mortality in people who receive invasive mechanical ventilation (Lorente 2010). It increases hospital stay by a mean of seven to nine days per person and is associated with an "attributable mortality" of 33% to 50% (ATS 2005; Koenig 2006). VAP accounts for up to 25% of all intensive care unit (ICU) infections (ATS 2005; Koenig 2006; Kola 2005). The high level of bacterial colonization associated with HHs means they may be considered a greater risk for VAP than HME (Al Ashry 2014; Koenig 2006; Ricard 2006).
HMEs may be more cost effective than HHs in people without contraindications for their use (Dodek 2004; Lorente 2010; Ricard 2006), but are also associated with complications. Because HMEs are thought to provide lower levels of humidification than HHs and increase inspiratory and expiratory airway resistance (Al Ashry 2014; Rathgeber 2006), they are associated with increased rates of airway occlusion (AARC 2012; Hess 2003; Koenig 2006). Thus, they are not recommended in people with thick, copious secretions, pulmonary trauma or inflammation (AARC 2012; Branson 2007; Rathgeber 2006). HMEs may also be inappropriate for children and babies as their smaller airways may mean they are at a greater risk of airway occlusion (Rathgeber 2006; Schiffmann 2006). In addition, because HMEs require heat retention to provide effective warming of inspired gases, they can be contraindicated for people with hypothermia particularly children and babies who are more susceptible to heat loss (AARC 2012). There may, however, be differences in risk and benefit between different types of HME. Hydrophobic HMEs may be more likely to cause ETT occlusion compared to HMEs with a hygroscopic element (AARC 2012; Al Ashry 2014).
Although humidification for mechanically ventilated people is widely accepted as an essential practice, there is a lack of consensus over which method of humidification is preferable. In their review of VAP, Lorente and colleagues commented that while new evidence‐based guidelines for prevention of VAP had been published in the previous two years by American, Canadian and European scientific societies, recommendations on whether HMEs or HHs should be used were not consistent (Lorente 2010).
Our original systematic review of 33 trials, with 2833 participants of all randomized controlled trials (RCTs) comparing the use of HH to HME in people undergoing invasive mechanical ventilation found no clear evidence that either method was less likely to be associated with adverse events (Kelly 2010a; Kelly 2010b). This review update included the relevant literature from 2010 to 2015.
Objectives
To assess whether heat and moisture exchangers or heated humidifiers are more effective in preventing complications in people receiving invasive mechanical ventilation and to identify whether the age group of participants, length of humidification, type of HME, and ventilation delivered through a tracheostomy had an effect on these findings.
Methods
Criteria for considering studies for this review
Types of studies
We included RCTs comparing HMEs to HH in adults and children undergoing invasive mechanical ventilation. We included cross‐over studies if the order of the device was randomized.
Types of participants
We included children (aged 0 to 16 years) and adults (aged over 16 years) who were receiving invasive mechanical ventilation in any setting.
We imposed no any exclusion criteria.
Types of interventions
Comparison of HME and HH:
-
any type of HME (e.g. hygroscopic, hydrophobic or combination);
-
any model of HH.
Types of outcome measures
Primary outcomes
-
Artificial airway occlusion.
-
Mortality (all‐cause and related to respiratory events).
-
Pneumonia (all‐cause, nosocomial and ventilator‐associated).
Secondary outcomes
-
Respiratory complications, as defined by study authors and including: hypoxaemia, hypercapnia, aspiration from any cause, aspiration due to condensate in ventilator circuit.
-
Respiratory measures including: partial pressure of arterial oxygen (PaO2), partial pressure of arterial carbon dioxide (PaCO2), breathing rate, work of breathing, tidal volume or minute ventilation.
-
Secretion clearance or inspissated (thickened or congealed) mucous.
-
Change in body temperature.
-
Length of stay: ICU, hospital.
-
Supplemental humidification with nebulized or directly instilled saline.
-
Cost of devices.
-
Quality of life measures.
Search methods for identification of studies
Electronic searches
Before beginning this review, we searched the Cochrane Database of Systematic Reviews (CDSR) and the Database of Abstracts of Reviews of Effectiveness (DARE) to identify whether any relevant systematic reviews already existed.
We searched the current issue of the Cochrane Central Register of Controlled Trials (CENTRAL; 2017, Issue 5); MEDLINE, OvidSP (1966 to 30 May 2017); Embase, OvidSP (1980 to 30 May 2017); and CINAHL, EBSCO host (1982 to 30 May 2017) for trials.
The CENTRAL, MEDLINE, Embase and CINAHL search strategies used are detailed in Appendix 1.
Methodology filter
A modified version of the first two phases of the Cochrane RCT search strategy was used to identify RCTs and controlled clinical trials. We combined the population and intervention terms, as outlined above, with the methodology terms. Where duplicate publication occurred, we used the publication with the most data as the primary publication for the review.
Searching other resources
We checked reference lists of included studies and relevant reviews for other potentially relevant studies which may not have been identified by the electronic search.
Non‐English language articles were eligible for selection to reduce the risk of publication bias. We had the papers translated or had data extraction performed by translators identified within Cochrane (see Acknowledgements).
Data collection and analysis
Selection of studies
Two authors (of DG, DT, JF, BB) independently examined the citations retrieved by the search strategy and retrieved those reports thought to fulfil the selection criteria in full. Where a judgement could not be made, based on the citation alone, we obtained the full article. We resolved differences by consensus.
We excluded studies if there was no report of randomization in the study design. The definition of 'mechanically ventilated' was taken to be invasive ventilation via an ETT or tracheostomy. We excluded studies involving participants undergoing non‐invasive ventilation, such as mask continuous positive airway pressure or participants self‐ventilating via a tracheostomy or a T‐tube.
Data extraction and management
We devised a standard data extraction form and piloted the form on a mixed set of articles. Two authors (DG, DT, JF, BB) independently extracted the data from each study and each pair met to compare the data. We resolved differences by consensus. In the case of papers written in a language other than English, data were extracted by Cochrane identified translators. Where data was missing or further information was required, we made all reasonable attempts to contact the authors to obtain the required information. We extracted the following information:
-
country and setting where study was performed;
-
inclusion and exclusion criteria;
-
participant characteristics: age group, gender, diagnosis, severity of illness;
-
details of interventions;
-
outcomes measured;
-
duration of study;
-
numbers enrolled and completing in each group;
-
baseline characteristics of each group;
-
results per group.
Assessment of risk of bias in included studies
We independently assessed trials as 'low,' 'high' or 'unclear' risk of bias according to the following quality criteria (Higgins 2011).
-
Random sequence generation (selection bias).
-
Allocation concealment (selection bias).
-
Blinding of outcome assessment (detection bias).
-
Incomplete outcome data (attrition bias).
-
Selective reporting (reporting bias).
-
Other identified or potential bias.
If there was any disagreement about whether or not a trial fulfilled a particular quality criterion, we resolved the differences by consensus or referral to a third member of the review team.
Measures of treatment effect
Dichotomous data
For meta‐analyses of dichotomous data, we calculated the risk ratio (RR) and 95% confidence interval (95% CI) using a random‐effects model. If data were only reported by a single study, these data were also calculated and reported but a forest plot was not generated.
Continuous data
For continuous outcomes, we calculated the mean difference (MD) and corresponding 95% CI using a random‐effects model.
As a meta‐analysis is based on assumptions of normality, all continuous data were checked for skew before inclusion. Data were considered substantially skewed if the standard deviation was greater than the mean (Higgins 2011). If data were substantially skewed, they were not included in meta‐analyses and were reported separately.
We calculated the standardized mean difference (SMD) and 95% CI rather than MD for saline instillations as two different units of measurement (i.e. volume or number) were used.
Unit of analysis issues
Cross‐over trials
Since the results in a cross‐over trial are based on paired data, the meta‐analysis of cross‐over trials used the MD and standard error (SE) of the mean difference (SE (MD)) from each trial. Only one study provided adequate information to derive the SE (MD) for the outcome PaCO2 (MacIntyre 1983). Therefore, we calculated the results of the cross‐over studies based on low (0.3), moderate (0.5) and high (0.7) estimates of correlation. Meta‐analyses using each of the different correlation values are reported for each outcome.
Dealing with missing data
If information about study methods or adequate data to be used in meta‐analysis were not reported, we attempted to contact study authors to obtain this information.
Assessment of heterogeneity
We used the I2 statistic to assess heterogeneity (Higgins 2011). The I2 statistic lies between 0% and 100%, with larger values being indicative of increasing heterogeneity. Higgins 2011 suggested assigning low, moderate and high heterogeneity to I2 statistical values of 25%, 50% and 75%. Based on this, we considered that there was evidence of substantial heterogeneity when the I2 statistic was greater than 50%.
Assessment of reporting biases
We entered the primary outcome data from all included studies into a funnel plot (trial effect against trial size) to investigate the possibility of publication bias (Higgins 2011).
The quality of the included studies was assessed independently by two authors (DG, DT, JF, BB) without blinding to authorship or journal of publication. We resolved differences in the authors' allocation of studies into quality categories by consensus.
Data synthesis
Where cluster randomized trials were identified, we planned to make appropriate corrections for the cluster design if appropriate data had been reported and these data incorporated into the meta‐analyses. However, no data which could be used to make these corrections were reported in included studies.
If parallel studies reported data for more than one group for each intervention (e.g. two ventilation pressures for both HME and HH), we calculated pooled means and SDs and used them in the meta‐analysis. In three of the four studies that used more than one type of HME or HH, data were given separately for each type of intervention. Therefore, we pooled data for HME or HH in these studies (Luchetti 1998; Ricard 1999; Villafane 1996).
As there is no method for pooling mean and variance data from cross‐over studies, data were used from only one of the two groups of participants receiving each intervention in Campbell 2000 and Girault 2003. In the study by Campbell 2000, we used the data reported for people who were chemically paralysed and sedated rather than those who were breathing spontaneously as this was more consistent with the other included studies. Girault 2003 reported data for people receiving two different levels of pressure support ventilation so we used data from the group receiving ventilation at a pressure of 15 cm H2O as this was similar to what was used in the other included studies.
Subgroup analysis and investigation of heterogeneity
As adults and children have different respiratory anatomy and physiology, we decided a priori to perform subgroup analysis by age group if there were adequate data. Since the anatomical and physiological differences are even more pronounced in preterm and term neonates, the age group categories were:
-
neonates: term and preterm infants up to 28 days of age (or corrected age for preterm infants). Preterm infants have a gestational age of less than 37 weeks while term infants have a gestational age of 37 weeks or greater;
-
infants and children, aged 28 days to 16 years; and
-
adults, aged over 16 years.
As respiratory complications and damage are linked to the length of time a person is intubated and the duration of mechanical ventilation, subgroup analysis by the duration of the experimental humidification was conducted. These were:
-
ultra‐short humidification: up to 12 hours;
-
short‐term humidification: from 12 to 48 hours;
-
medium‐term humidification: from 48 hours to seven days;
-
long‐term humidification: more than seven days.
We conducted subgroup analyses based on whether the HME used was:
-
hydrophobic;
-
hygroscopic;
-
combined hydrophobic/hygroscopic.
Finally, a subgroup analysis was planned by artificial airway:
-
ETT;
-
tracheostomy.
conditional on whether sufficient studies were available.
Sensitivity analysis
We conducted sensitivity analysis based on whether studies were rated as a low, unclear or high risk of selection and detection bias.
Therefore, the sensitivity analyses were as follows.
-
Selection bias: low versus unclear versus high risk.
-
Detection bias: low versus unclear versus high risk.
'Summary of findings' table and GRADE
We produced a 'Summary of findings' table for the primary outcomes of artificial airway occlusion, all‐cause mortality and pneumonia when HME was compared to HH using GRADEpro software (GRADEpro). Baseline risk was based on the risk rates calculated by GRADEpro from included studies. We used the GRADE system to assess the quality of studies and data contributing to these analyses (Guyatt 2008). The GRADE approach gives an assessment of within‐study risk of bias (methodological quality), that may affect the directness of the evidence, heterogeneity of the data, precision of the effect estimates and potential for publication bias. For assessments of the overall quality of evidence for each outcome, we downgraded the evidence from 'high quality' by one level for single or two for multiple risks of bias.
Results
Description of studies
Results of the search
(Figure 1)

Study flow diagram.
In total, we identified 1458 citations using the search strategies detailed in Appendix 1. After the removal of duplicates, 957 citations remained. After title and abstract review, 65 of these studies (67 citations) were considered potentially relevant. Following data extraction, we included 34 studies (36 citations) and excluded 29 (29 citations). Two studies (76 participants) are awaiting classification, one by Nadir Oziş 2009 until data can be obtained from authors and one by Oguz 2013 identified from a recently published review (Vargas 2017).
Included studies
We included 34 trials in the review, with 2848 participants completing the trials (see Characteristics of included studies table). Thirteen of the trials were conducted in France (Daoud 1991; Deriaz 1992; Dreyfuss 1995; Girault 2003; Lacherade 2005; Le Bourdelles 1996; Martin 1990; Martin 1994; Misset 1991; Ricard 1999; Roustan 1992; Thomachot 2001; Villafane 1996); six in the USA (Branson 1996; Campbell 2000; Goldberg 1992; Kirton 1997; Kollef 1998; MacIntyre 1983); three in Italy (Iotti 1997; Luchetti 1998; Pelosi 1996); two each in Australia (Boots 1997; Boots 2006), Canada (Bissonnette 1989a; Bissonnette 1989b); and Brazil (Alcoforado 2012; Diaz 2002); and one each in Saudi Arabia (Memish 2001), Denmark (Kirkegaard 1987), Finland (Linko 1984), Spain (Lorente 2006), Switzerland (Hurni 1997), and the UK (Yam 1990). Seven studies were performed in the operating department (Bissonnette 1989a; Bissonnette 1989b; Deriaz 1992; Goldberg 1992; Kirkegaard 1987; Le Bourdelles 1996; Yam 1990); the remaining 27 studies were set in an ICU, one of these in a neonatal ICU (Daoud 1991). Three studies were conducted on children and infants (Bissonnette 1989a; Bissonnette 1989b; Daoud 1991). Bissonnette 1989a reported data from infants weighing between 5 kg and 10 kg; Bissonnette 1989b reported data from infants and children weighing between 5 kg and 30 kg; and Daoud 1991 reported data from a neonatal population. The remaining studies were conducted in adults; although participants in these trials were aged 15 to 95 years, the mean age was 40 to 69 years).
Twenty‐six studies used a parallel‐group design in which at least two independent groups were studied (Alcoforado 2012; Bissonnette 1989a; Bissonnette 1989b; Boots 1997; Boots 2006; Branson 1996; Daoud 1991; Deriaz 1992; Diaz 2002; Dreyfuss 1995; Goldberg 1992; Hurni 1997; Kirkegaard 1987; Kirton 1997; Kollef 1998; Lacherade 2005; Linko 1984; Lorente 2006; Luchetti 1998; Martin 1990; Memish 2001; Misset 1991; Ricard 1999; Roustan 1992; Villafane 1996; Yam 1990). Eight studies used a cross‐over design whereby two interventions were studied in the same group of participants (Campbell 2000; Girault 2003; Iotti 1997; Le Bourdelles 1996; MacIntyre 1983; Martin 1994; Pelosi 1996; Thomachot 2001). In each of the cross‐over studies, the order of the intervention (HH or HME) was randomized. Twenty‐nine of the included studies compared one type of HME to one type of HH (Alcoforado 2012; Bissonnette 1989a; Bissonnette 1989b; Boots 1997; Branson 1996; Campbell 2000; Daoud 1991; Deriaz 1992; Diaz 2002; Dreyfuss 1995; Girault 2003; Goldberg 1992; Hurni 1997; Iotti 1997; Kirkegaard 1987; Kirton 1997; Kollef 1998;Lacherade 2005; Le Bourdelles 1996; Linko 1984; Lorente 2006; MacIntyre 1983; Martin 1990; Martin 1994; Memish 2001; Pelosi 1996; Roustan 1992; Thomachot 2001; Yam 1990). Four parallel studies used more than one type of HH or HME. Two of these studies compared one HME to two HHs (Luchetti 1998; Misset 1991); one compared two HMEs to one HH (Villafane 1996); and one compared four HMEs to one HH (Ricard 1999).
Across the 34 included studies, the outcomes reported were: artificial airway occlusion, mortality, pneumonia, respiratory complications, ventilation, change in body temperature, length of stay, secretion clearance, supplemental humidification and cost. None of the included studies reported quality of life.
Excluded studies
We excluded 29 studies because participants were not undergoing invasive mechanical ventilation, there was no randomization, no relevant clinical outcomes, HME was used in conjunction with an HH, or data could not be obtained from study authors (see Characteristics of excluded studies table).
Studies awaiting classification
Two studies (76 participants) are awaiting classification. One study by Nadir Oziş 2009 is awaiting classification as we have not yet been able to obtain additional information including outcome data from the study authors. The second study (Oguz 2013) was identified from a recently published review (Vargas 2017). See Characteristics of studies awaiting classification table for further information.
Ongoing studies
We identified no ongoing studies.
Risk of bias in included studies
We rated all of the studies for risk of bias in six domains: random sequence generation and allocation concealment (both selection bias), blinding of outcome assessment (detection bias), incomplete outcome data (attrition bias), selective reporting (reporting bias) and other bias (see Figure 2, Figure 3; Characteristics of included studies table). Seven studies had a low risk of bias for one domain (Bissonnette 1989b; Hurni 1997; Kirkegaard 1987; Linko 1984; Luchetti 1998; Martin 1994; Villafane 1996), 13 studies for two domains (Alcoforado 2012; Bissonnette 1989a; Boots 2006; Branson 1996; Daoud 1991; Dreyfuss 1995; Lorente 2006; MacIntyre 1983; Martin 1990; Ricard 1999; Roustan 1992; Thomachot 2001; Yam 1990), nine studies for three domains (Boots 1997; Campbell 2000; Girault 2003; Iotti 1997; Kirton 1997; Lacherade 2005; Le Bourdelles 1996; Memish 2001; Pelosi 1996), and two studies for four domains (Diaz 2002; Kollef 1998). Two studies were not at low risk of bas for any domain (Deriaz 1992; Misset 1991). Fourteen studies were at high risk of bias for one domain (Alcoforado 2012; Boots 2006; Deriaz 1992; Dreyfuss 1995; Hurni 1997; Kirkegaard 1987; Lacherade 2005; Luchetti 1998; Martin 1990; Martin 1994; Memish 2001; Roustan 1992; Thomachot 2001; Villafane 1996) and three studies in two domains (Branson 1996; Lorente 2006; Misset 1991).

Methodological quality graph: review authors' judgements about each methodological quality item presented as percentages across all included studies.
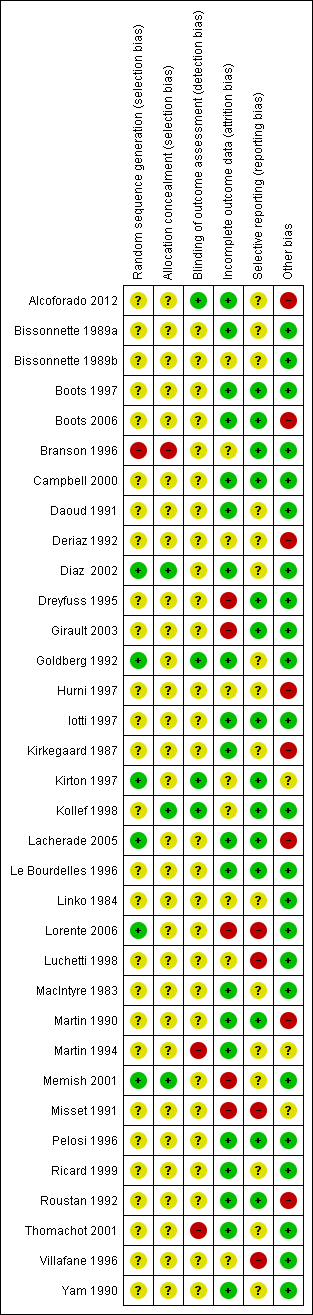
Methodological quality summary: review authors' judgements about each methodological quality item for each included study.
Allocation
Six studies described adequate generation of randomization sequences (Diaz 2002; Goldberg 1992; Kirton 1997; Lacherade 2005; Lorente 2006; Memish 2001), while it was inadequate in one study (Branson 1996). The remainder did not describe sequence generation. Three trials had adequate allocation concealment (Diaz 2002; Kollef 1998; Memish 2001), and one had inadequate allocation concealment (Branson 1996); 30 trials did not explain the allocation process.
Blinding
Four trials reported that outcome assessment was blinded (Alcoforado 2012; Goldberg 1992; Kirton 1997; Kollef 1998), while two stated that it was not blinded (Martin 1994; Thomachot 2001). Most studies contained no information about blinding.
Incomplete outcome data
Most studies were at low risk of attrition bias because they appeared to have had 100% follow‐up (Alcoforado 2012; Bissonnette 1989a; Boots 1997; Boots 2006; Campbell 2000; Diaz 2002; Goldberg 1992; Iotti 1997; Kirkegaard 1987; Lacherade 2005; Le Bourdelles 1996; MacIntyre 1983; Martin 1990; Martin 1994; Pelosi 1996; Ricard 1999; Roustan 1992; Thomachot 2001; Yam 1990). Five trials were at high risk of attrition bias (Dreyfuss 1995; Girault 2003; Lorente 2006; Memish 2001; Misset 1991). The risk due to attrition was unclear in the remaining studies.
Selective reporting
The majority of studies were at low risk of selective reporting because all expected primary outcomes were reported (Boots 1997; Boots 2006; Branson 1996; Campbell 2000; Dreyfuss 1995; Girault 2003; Iotti 1997; Kirton 1997; Kollef 1998; Lacherade 2005; Le Bourdelles 1996; Martin 1990; Pelosi 1996; Roustan 1992). Four studies were at high risk of reporting bias because they were all long‐term studies that did not report at least one of the expected outcome of pneumonia or mortality (Lorente 2006; Luchetti 1998; Misset 1991; Villafane 1996). The remainder were at unclear risk of bias.
Other potential sources of bias
Six studies were at high risk of other bias. In Alcoforado 2012, the mean time in hospital was much longer in the HH group (29 days versus 9 days) although the median duration of ventilation was shorter (161 hours versus 201 hours), and 100% of the HH group received antibiotics compared to 87.5% in the HME group. Participants in the HME group were ventilated for a significantly shorter period (six days versus eight days) in Boots 2006; the HME group were anaesthetized for significantly longer than the HH group (155 minutes versus 116 minutes) in Deriaz 1992; circuits were changed every 48 hours in the HH group and only every seven days in the HME group in Hurni 1997; in Lacherade 2005, there were five times as many participants in the HH group who had HIV and this group also had higher partial pressure arterial oxygen/fraction of inspired oxygen (PaO2/FiO2) values; and in Martin 1990 the HH group remained in the study for a mean of 14 days compared to 10 days in the HME group.
Four studies were funded by the makers of the HME (Kollef 1998) or HH (Branson 1996; Lacherade 2005), or both HME and HH (Boots 2006). The maker supplied the HME in Yam 1990.
Effects of interventions
Data from parallel studies
(See Analysis 1.1; Analysis 1.2; Table 1; Table 2.)
| Study | HH | HME | No of participants |
| 9 | 7 | 381 | |
| 4 | 4 | 43 | |
| 13.80 | 11.10 | 104 | |
| 5.30 | 5.70 | 310 | |
| 25.3 | 21.4 | 369 | |
| 9.30 | 13.90 | 116 |
HH: heated humidification; HME: heat and moisture exchangers.
| Study | HH | HME | No of participants |
| 11 | 10 | 43 | |
| 16.50 | 16.50 | 310 |
HH: heated humidification; HME: heat and moisture exchangers.
Data for the binary outcomes of artificial airway occlusion, mortality, pneumonia, atelectasis and pneumothorax came from the 26 parallel‐group studies (Alcoforado 2012; Bissonnette 1989a; Bissonnette 1989b; Boots 1997; Boots 2006; Branson 1996; Daoud 1991; Deriaz 1992; Diaz 2002; Dreyfuss 1995; Goldberg 1992; Hurni 1997; Kirkegaard 1987; Kirton 1997; Kollef 1998; Lacherade 2005; Linko 1984; Lorente 2006; Luchetti 1998; Martin 1990; Memish 2001; Misset 1991; Ricard 1999; Roustan 1992; Villafane 1996; Yam 1990). Data for the continuous outcomes of PaO2, PaCO2, tidal volume, minute ventilation, tracheal aspirations, number and volume of saline instillations, absolute and change in body temperature, length of stay (ICU and hospital) and cost also came from the parallel trials.
Primary outcomes
1. Artificial airway occlusion
Fifteen trials involving 2171 participants measured artificial airway occlusion (Boots 1997; Boots 2006; Branson 1996; Daoud 1991; Dreyfuss 1995; Hurni 1997; Kirkegaard 1987; Kirton 1997; Kollef 1998; Lacherade 2005; Luchetti 1998; Martin 1990; Misset 1991; Roustan 1992; Villafane 1996). There was no statistical difference between groups in the occurrence of artificial airway occlusion although there was substantial heterogeneity between studies (RR 1.59, 95% CI 0.60 to 4.19; I2 = 54%; Analysis 1.1).
2. Mortality
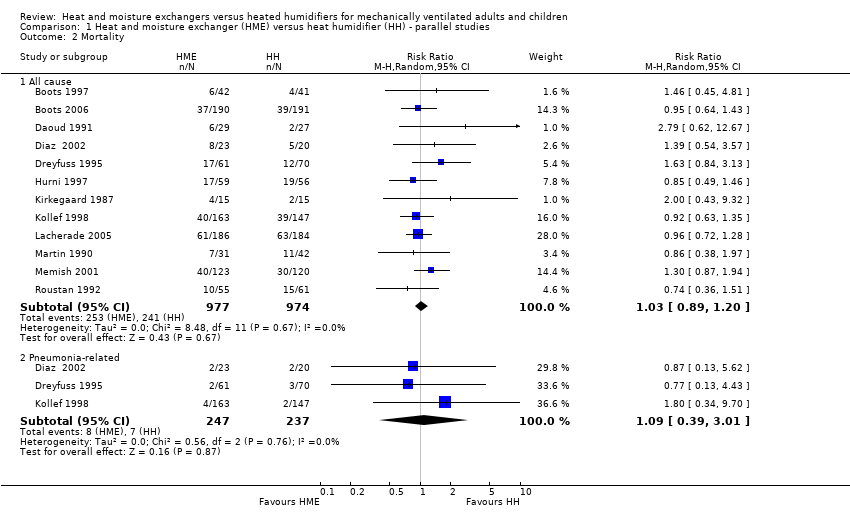
There was no statistically significant difference in all‐cause mortality (RR 1.03, 95% CI 0.89 to 1.20; 1951 participants; 12 studies; Boots 1997; Boots 2006; Daoud 1991; Diaz 2002; Dreyfuss 1995; Hurni 1997; Kirkegaard 1987; Kollef 1998; Lacherade 2005; Martin 1990; Memish 2001; Roustan 1992; I2 = 0%; Analysis 1.2) or pneumonia‐related mortality (RR 1.09, 95% CI 0.39 to 3.01; 484 participants; 3 studies; Diaz 2002; Dreyfuss 1995; Kollef 1998; I2 = 0%; Analysis 1.2).
3. Pneumonia
There was no statistically significant difference in the prevalence of pneumonia overall (RR 0.93, 95% CI 0.73 to 1.19; 2251 participants; 13 studies; Alcoforado 2012; Boots 1997; Boots 2006; Branson 1996; Diaz 2002; Dreyfuss 1995; Kirton 1997; Kollef 1998; Lacherade 2005; Lorente 2006; Martin 1990; Memish 2001; Roustan 1992; I2 = 27%; Analysis 1.3). Neither was there any difference when pneumonia was diagnosed at any time within the ventilation period (RR 0.94, 95% CI 0.69 to 1.27; 1090 participants; 7 studies; I2 = 0%; Analysis 1.3) or if the diagnosis was made at least 48 hours after ventilation was begun (RR 0.96, 95% CI 0.64 to 1.46; 1161 participants; 6 studies; I2 = 57%; Analysis 1.3), although there was substantial heterogeneity in this latter subgroup.
Secondary outcomes
1. Respiratory complications
Atelectasis
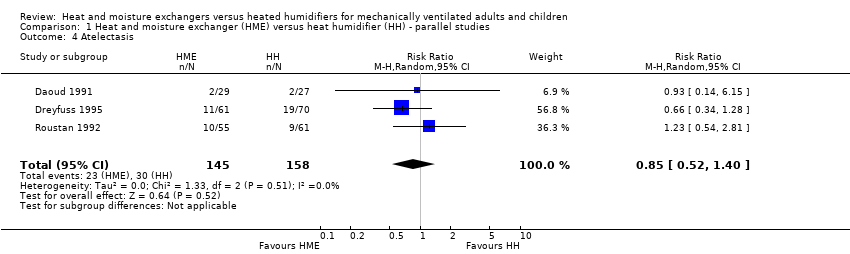
There was no statistical difference between the two forms of humidification for atelectasis (RR 0.85, 95% CI 0.52 to 1.40; 303 participants; 3 studies; Daoud 1991; Dreyfuss 1995; Roustan 1992; I2 = 0%; Analysis 1.4).
Pneumothorax
There was no statistical difference between the HME and HH groups in the prevalence of pneumothorax in the one study that reported this outcome (RR 2.79, 95% CI 0.62 to 12.67; 56 participants; 1 study; Daoud 1991; P = 0.18).
2. Respiratory measures
Arterial pressure of oxygen
The PaO2 was significantly higher in the HME group compared with the HH group (MD 2.80 kPa, 95% CI 0.13 to 5.47; 30 participants; 1 study; Kirkegaard 1987; P = 0.04 ).
Arterial pressure of carbon dioxide
There was no statistical difference between groups in PaCO2 levels (MD ‐0.20 kPa, 95% CI ‐0.67 to 0.27; 30 participants; 1 study; Kirkegaard 1987; P = 0.40).
Tidal volume
There was no difference between the HME and HH groups in tidal volume (MD ‐0.03 L, 95% CI ‐38.81 to 38.75; 85 participants; 1 study; Ricard 1999; P = 1.00).
Minute ventilation
There was no difference between groups in minute ventilation (MD ‐0.70 L/minute, 95% CI ‐1.97 to 0.57; 85 participants; 1 study; Ricard 1999; P = 0.28).
3. Secretion clearance
Tracheal aspirations
There was no significant difference between groups in tracheal aspirations (MD ‐0.47 aspirations per day, 95% CI ‐1.41 to 0.47; 290 participants; 3 studies; Branson 1996; Dreyfuss 1995; Misset 1991; I2 = 64%; Analysis 1.5).
Data from the study by Boots 1997, which measured the number of suctions per hour, could not be included in this meta‐analysis as there was no measure of variance reported.
Saline instillations
The number or volume of saline instillations per day was significantly lower in the HME group (SMD ‐0.40 instillations per day, 95% CI ‐0.64 to ‐0.17; 276 participants; 3 studies; Branson 1996; Dreyfuss 1995; Martin 1990; I2 = 0%; Analysis 1.6).
4. Change in body temperature
Six parallel‐group studies reported absolute body temperature (Bissonnette 1989a; Branson 1996; Deriaz 1992; Goldberg 1992; Martin 1990; Yam 1990), and three studies reported change in body temperature (Branson 1996; Dreyfuss 1995; Martin 1990). Body temperature was significantly lower in the HME group when analysing absolute data (MD ‐0.49 ºC, 95% CI ‐0.96 to ‐0.02; 321 participants; I2 = 88% Analysis 1.7) and mean change data (MD ‐0.59 ºC, 95% CI ‐0.82 to ‐0.36; 78 participants; I2 = 8%; Analysis 1.8).
5. Length of stay
Six studies reported ICU length of stay (Boots 2006; Diaz 2002; Hurni 1997; Kollef 1998; Lacherade 2005; Roustan 1992; 1323 participants) and two studies reported length of stay in hospital (Diaz 2002; Kollef 1998; 353 participants); however, all these data were skewed or the SDs were not reported and the data could not be added to a meta‐analysis. There was no consistent pattern in length of stay in either group (Table 1; Table 2).
6. Supplemental humidification
None of the studies reported supplemental humidification.
7. Cost of devices
Six studies reported cost data (Boots 1997; Boots 2006; Branson 1996; Dreyfuss 1995; Kirton 1997; Kollef 1998; 1284 participants). As a measure of variance was not available for these studies, these data could not be meta‐analysed. However, all studies reported lower costs for HMEs compared to HHs (Table 3).
| Study | HME | HH | Units | Participants |
| 6.72 | 8.20 | AUD/day | 83 | |
| 8.62 | 9.27 | AUD/day | 381 | |
| 4.70 | 8.97 | USD/day | 99 | |
| 5.00 | 11.00 | USD/day (France) | 131 | |
| 17.46 | 27.80 | USD/participant | 280 | |
| 15.98 | 38.26 | USD/participant | 310 |
HH: heated humidification; HME: heat and moisture exchangers.
8. Quality of life
None of the studies reported quality of life.
Data from cross‐over studies
Data for the continuous outcomes: SaO2, PaO2, PaCO2, breathing rate, tidal volume and minute ventilation came from the included cross‐over trials.
1. Respiratory complications
Arterial oxygen saturation
Only one cross‐over trial involving 11 participants reported SaO2 data (Campbell 2000). There was no significant difference between the HME and HH groups in the SaO2 at the low (MD ‐2.00, 95% CI ‐4.84 to 0.84; P = 0.17), moderate (MD ‐2.00, 95% CI ‐4.70 to 0.70; P = 0.15) or high correlation estimates (MD ‐2.00, 95% CI ‐4.57 to 0.57; P = 0.13).
2. Respiratory measures
Arterial pressure of oxygen
Four cross‐over trials involving 65 participants reported PaO2 (Campbell 2000; Girault 2003; Le Bourdelles 1996; MacIntyre 1983). There was no significant difference between groups at low (MD ‐3.24 mmHg, 95% CI ‐16.08 to 9.60; Analysis 2.1), moderate (MD ‐3.87 mmHg, 95% CI ‐16.73 to 9.00; Analysis 2.1) and high correlation estimates (MD ‐4.41 mmHg, 95% CI ‐17.09 to 8.27; P = 0.50; Analysis 2.1).
Arterial pressure of carbon dioxide
Five cross‐over trials involving 88 participants reported PaCO2 (Campbell 2000; Girault 2003; Iotti 1997; Le Bourdelles 1996; MacIntyre 1983). The PaCO2 was significantly higher in the HME group at all correlation estimates: low (MD 1.93 mmHg, 95% CI 0.27 to 3.59; Analysis 2.2), moderate (MD 2.02 mmHg, 95% CI 0.19 to 3.85; Analysis 2.2) and high (MD 2.21 mmHg, 95% CI 0.33 to 4.09; Analysis 2.2).
Breathing rate
Four cross‐over trials involving 65 participants reported breathing rate (Campbell 2000; Iotti 1997; Le Bourdelles 1996; Pelosi 1996). The breathing rate was significantly higher in the HME group at the low correlation estimate (MD 1.40 breaths per minute, 95% CI 0.33 to 2.46; Analysis 2.3), but there was no significant difference between groups at moderate (MD 1.15 breaths per minute, 95% CI ‐0.13 to 2.44; Analysis 2.3) or high (MD 1.02 breaths per minute, 95% CI ‐0.38 to 2.41; Analysis 2.3) correlation estimates.
Work of breathing
Two studies involving 21 participants measured work of breathing (Girault 2003; Iotti 1997). However, as these data were skewed, they could not be meta‐analysed. Work of breathing was higher in the HME group in both studies (Table 4).
| Study | HH | HME | Participants |
| 9.86 | 16.50 | 11 | |
| 13.6 | 20.8 | 10 |
HH: heated humidification; HME: heat and moisture exchangers.
Tidal volume
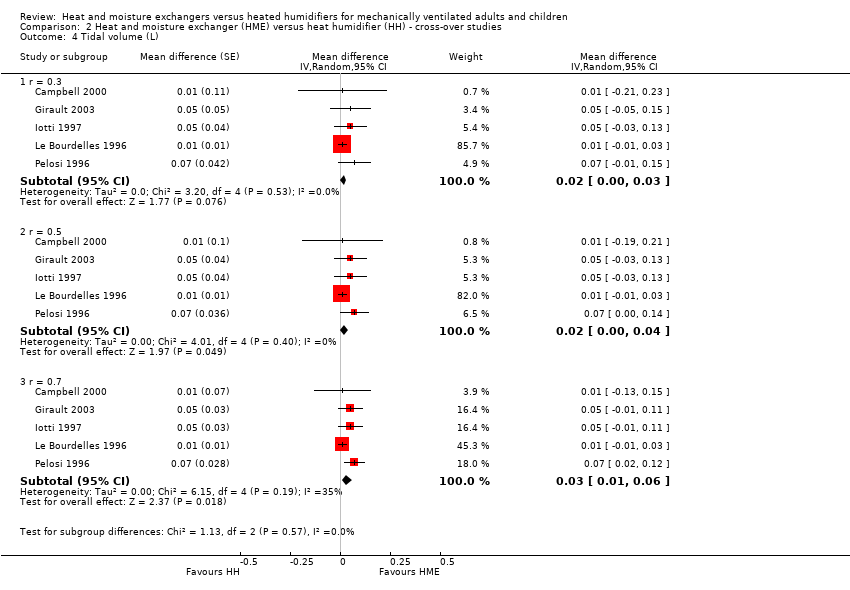
Five studies involving 76 participants measured tidal volume (Campbell 2000; Girault 2003; Iotti 1997; Le Bourdelles 1996; Pelosi 1996). There was no difference between groups at the low (MD 0.02 L, 95% CI ‐0.00 to 0.03; Analysis 2.4) or moderate (MD 0.02 L, 95% CI 0.00 to 0.04; Analysis 2.4) correlation estimates, but tidal volume was significantly higher at the high correlation estimate (MD 0.03 L, 95% CI 0.01 to 0.06; Analysis 2.4).
Minute ventilation
The five cross‐over studies involving 76 participants measuring minute ventilation were the same studies as those measuring tidal volume (Campbell 2000; Girault 2003; Iotti 1997; Le Bourdelles 1996; Pelosi 1996). There was a significantly higher minute ventilation in the HME group at the low (MD 1.20 L/minute, 95% CI 0.78 to 1.61; Analysis 2.5), moderate (MD 1.19 L/minute, 95% CI 0.63 to 1.75; Analysis 2.5) and high (MD 1.18 L/minute, 95% CI 0.55 to 1.80 Analysis 2.5) correlation estimates.
3. Change in body temperature
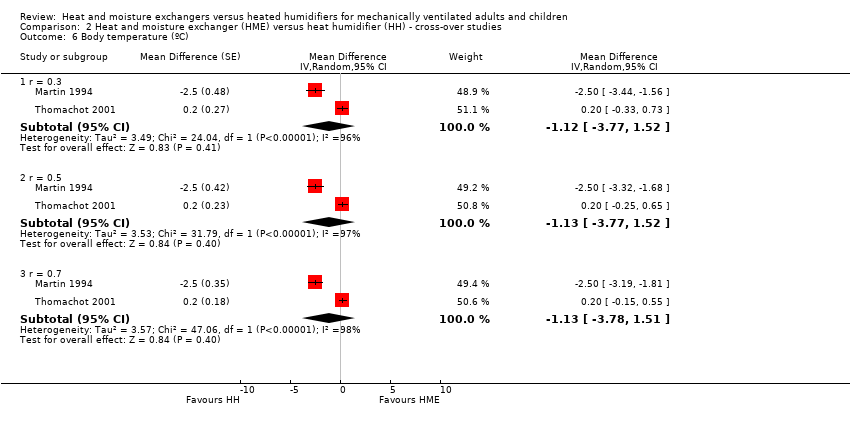
Two cross‐over studies involving 21 participants reported body temperature (Martin 1994; Thomachot 2001). There was no difference between groups at low (MD ‐1.12 ºC, 95% CI ‐3.77 to 1.52; Analysis 2.6), moderate (MD ‐1.13 ºC, 95% CI ‐3.77 to 1.52; Analysis 2.6) or high (MD ‐1.13 ºC, 95% CI ‐3.78 to 1.51; Analysis 2.6) correlation estimates, but heterogeneity was very high, ranging from an I2 statistic of 96% to 98%.
Subgroup analysis
Age group
Only two of the 34 included studies were carried out in children (Bissonnette 1989a; Bissonnette 1989b), and one was performed in the neonatal population (Daoud 1991). Daoud 1991 was the only study in infants or children which reported primary outcomes, namely: artificial airway occlusion and mortality. The remaining studies were all conducted in adults.
There was no difference between age groups for the outcomes of artificial airway occlusion (Analysis 3.1) or mortality (Analysis 3.2).
Length of ventilation
Twelve of the included studies compared methods of humidification that we categorized as ultra‐short term (up to 12 hours) (Bissonnette 1989a; Bissonnette 1989b; Campbell 2000; Deriaz 1992; Girault 2003; Goldberg 1992; Iotti 1997; Le Bourdelles 1996; Linko 1984; Pelosi 1996; Ricard 1999; Yam 1990). Three were short‐term humidification studies (12 to up to 48 hours) (MacIntyre 1983; Martin 1994; Thomachot 2001); nine were medium‐term (from 48 hours to seven days) (Alcoforado 2012; Boots 1997; Boots 2006; Branson 1996; Daoud 1991; Kirkegaard 1987; Kollef 1998; Luchetti 1998; Villafane 1996); and eight were long‐term (more than seven days) (Dreyfuss 1995; Hurni 1997; Lacherade 2005; Lorente 2006; Martin 1990; Memish 2001; Misset 1991; Roustan 1992). Two studies did not state the length of humidification (Diaz 2002; Kirton 1997).
Data were only available to compare the primary outcomes for medium and long‐term trials.
There was a no difference between medium‐term and long‐term studies for the outcome of artificial airway (Analysis 4.1).
There was no apparent subgroup difference between medium‐term and long‐term studies in all‐cause mortality (Analysis 4.2) or pneumonia (Analysis 4.3).
Hygroscopic versus hydrophobic heat and moisture exchangers
Eight studies used hydrophobic HMEs (Goldberg 1992; Kirton 1997; Martin 1990; Misset 1991; Ricard 1999; Roustan 1992; Thomachot 2001; Villafane 1996). In two studies, it was unclear whether an HME with hygroscopic properties was used (Linko 1984; Lorente 2006). The remaining studies appeared to use hygroscopic HMEs.
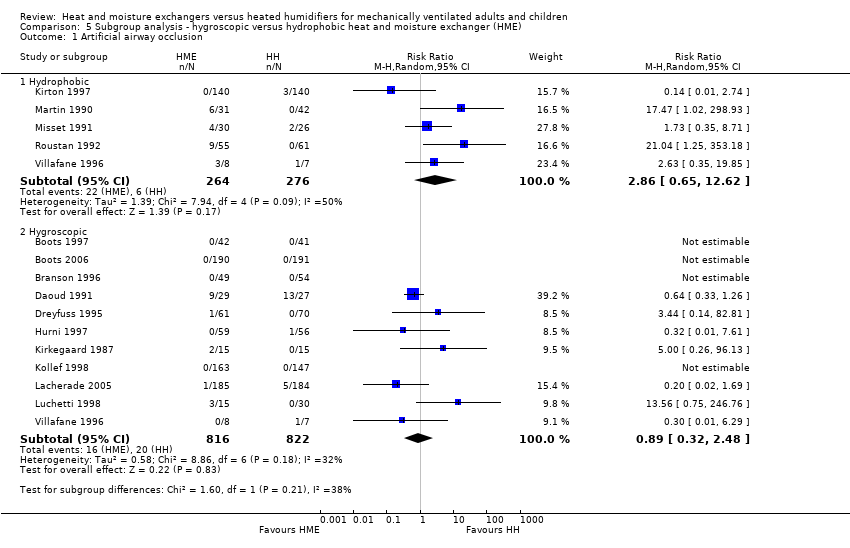
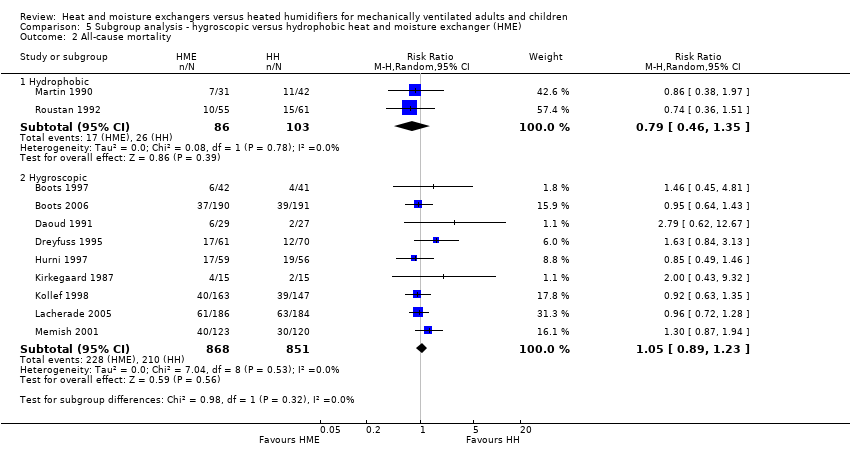
There was no difference between subgroups for the outcomes of artificial airway occlusion (Analysis 5.1) or mortality (Analysis 5.2). However, there was a significant difference between those studies using a hydrophobic HME compared to those using a hygroscopic HME for the outcome of pneumonia (Analysis 5.3). The likelihood of pneumonia appeared to be halved in studies using a hydrophobic HME (RR 0.48, 95% CI 0.28 to 0.82; 469 participants; 3 studies) compared to those using a hygroscopic HME where the risk was not significantly different from the HH group (RR 0.95, 95% CI 0.77 to 1.17; 1678 participants; 9 studies; Analysis 5.3).
Endotracheal tube versus tracheostomy
Only one study stated that ventilation was given via a tracheostomy (Martin 1990), and data for participants with a tracheostomy were not given separately from participants ventilated through an ETT. Therefore, there were insufficient data to do a subgroup analysis of people who were ventilated via tracheostomy.
Sensitivity analyses
Sensitivity analyses based on the adequacy of allocation concealment were done for the outcomes of mortality (Analysis 7.1) and pneumonia (Analysis 7.2). There was no difference between the studies rated as having either adequate or unknown allocation concealment for either outcome. A sensitivity analysis was not done for artificial airway occlusion as only one study which reported this outcome was rated as having adequate allocation concealment (Kirton 1997) and one as inadequate (Branson 1996). There was also no difference between studies that we rated as low and unclear risk of detection bias for the outcomes of artificial airway occlusion (Analysis 8.1) and pneumonia (Analysis 8.2). We only rated one study which reported mortality at low risk of detection bias and none rated as high risk reported mortality.
Funnel plot analyses
There was no evidence of funnel plot asymmetry for the outcomes of artificial airway occlusion (Figure 4), mortality (Figure 5), and pneumonia (Figure 6).
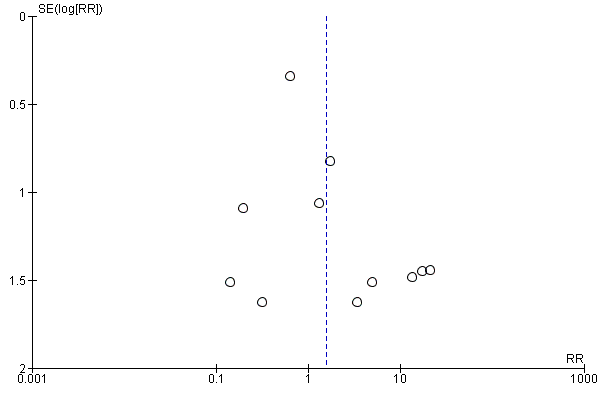
Funnel plot of comparison: 1 Heat and moisture exchanger (HME) versus heat humidifier (HH) ‐ parallel studies, outcome: 1.1 Artificial airway occlusion.

Funnel plot of comparison: 1 Heat and moisture exchanger (HME) versus heat humidifier (HH) ‐ parallel studies, outcome: 1.2 Mortality.

Funnel plot of comparison: 1 Heat and moisture exchanger (HME) versus heat humidifier (HH) ‐ parallel studies, outcome: 1.3 Pneumonia.
Discussion
Summary of main results
Overall, our results showed no evidence that either HMEs or HHs reduce the risk of artificial airway occlusion, mortality or pneumonia. However, there was substantial heterogeneity between studies for the outcomes of airway occlusion and pneumonia. HMEs may increase the PaCO2 and minute ventilation and decrease body temperature. Hydrophobic HMEs appear to reduce the prevalence of pneumonia compared to HHs but this requires further investigation.
Artificial airway occlusion
Blockage of the endotracheal or tracheostomy tube is a life‐threatening adverse event that can occur in a ventilated person. Over all studies, we found that there was no difference in the risk of artificial airway occlusion with either method of humidification. This was also the finding in the review by Bench 2003, although these data came from only one study.
Mortality
We found no effect of the type of artificial humidification on mortality. It would be difficult to attribute a person's death directly to the type of humidification used since the studies were performed in ventilated people who were critically ill. However, death could result from complications associated with the type of humidification used, for example, occlusion of the artificial airway or pneumonia.
Pneumonia
Overall, we found that the prevalence of pneumonia was no different when an HME was used. However, the use of a hydrophobic HME without hygroscopic properties may reduce the risk of pneumonia compared to an HH.
This apparent difference between HMEs may be due to the higher moisture‐retaining properties of hygroscopic HMEs, although both Dreyfuss 1995 and Boots 1997 reported that contamination was still higher with HH compared to hygroscopic HMEs. As HHs without a heated wire have been associated with a higher risk of VAP (Siempos 2007), we also considered whether the apparent difference between HME may have been explained by the HH they were compared to. All hydrophobic HME were compared to HH without a heated wire while six of the eight studies using a hygroscopic HME used an HH with a heated wire (Boots 1997; Boots 2006; Branson 1996; Dreyfuss 1995; Kollef 1998; Lacherade 2005). However, this does not appear to be the case as the prevalence of pneumonia was 16% in the HH groups with and without a heated wire, as well as the hygroscopic HME group, but only 7.5% in the hydrophobic HME group. Therefore, the prevalence of pneumonia does appear to be lower in the group with a hydrophobic HME.
Respiratory complications
There was no difference between groups for the outcomes of atelectasis, pneumothorax or tracheal aspirations. The number or volume of saline instillations was significantly lower in the HME group but given the subjectivity of these outcomes, these results may not be valid measures of potential airway blockage.
Respiratory measures
There was no difference in PaO2 over the three cross‐over studies that reported this outcome although these data were highly heterogenous (I2 statistic between 63% and 83%). The PaCO2 was higher in the HME group at all correlation estimates over the five studies that reported PaCO2, which may be because of carbon dioxide retained within the HME. This higher PaCO2 may also be related to the higher measures of work of breathing reported for the HME group in two studies although these data could not be meta‐analysed.
In the cross‐over studies, minute ventilation was significantly higher for HMEs across the five studies reporting this outcome. However, the findings for tidal volume were more equivocal, only being statistically higher in the HME group at the high correlation estimate.
While HMEs appeared to increase minute ventilation relative to HHs, as with many of the respiratory variables this may be affected by ventilatory settings and should, therefore, be interpreted with caution.
Change in body temperature
There was good evidence across parallel studies that body temperature was significantly decreased by approximately 0.5 ºC when an HME was used. Although the results of cross‐over studies were equivocal, these data came from two small contradictory studies. This decrease in body temperature in many cases may not be considered clinically relevant when the participants are adults. However, temperature control is vitally important and very finely balanced in neonates, and a drop of 0.5 ºC could have adverse effects. While to a lesser extent, a temperature drop of 0.5 ºC may also have adverse effects on older children and elderly people, particularly if they were initially hypothermic.
Cost of devises
There was evidence of cost savings with HMEs in our review but the variation in the way that the information was reported made it difficult to be definitive about how great the cost saving could be. The apparent cost advantages associated with an HME need to be weighed against the potential disadvantages.
Frequency of heat and moisture exchanger changes
Less‐frequent HME changes may increase the risk of adverse outcomes such as artificial airway occlusion (Karpadia 2001), although a number of studies have advocated that HMEs can be used safely for 48 hours (Boyer 2003; Markowicz 2000). We were unable though to make any conclusions about the frequency of HME changes from data in this review. Although HMEs were used for at least 24 hours in 16 parallel studies, six studies did not report the frequency of HME changes (Branson 1996; Diaz 2002; Dreyfuss 1995; Kollef 1998; Martin 1990; Memish 2001). In the 10 studies that did report the frequency, eight reported changing the HME at least every 24 hours (Boots 1997; Boots 2006; Daoud 1991; Kirton 1997; Luchetti 1998; Misset 1991; Roustan 1992; Villafane 1996), and only two reported 48‐hour changes (Lacherade 2005; Lorente 2006).
Overall completeness and applicability of evidence
Since the original version of this review in 2010, we identified only one new study. Therefore, there is little information which has been added to our original findings. Thus, evidence to date remains inadequate to make any conclusions about the relative risk associated with either method of humidification. We endeavoured to compare patient‐related factors (age group and type of ventilation) and humidification factors (length of ventilation and type of HME) that may have important implications on findings; however, there were inadequate data to make any conclusions about the effects of these factors. Data were particularly poor for infants and children, and people who were ventilated through a tracheostomy.
Quality of the evidence
The majority of included studies did not describe most quality criteria. We only considered six and three studies at low risk of selection bias due to sequence generation and allocation, respectively. Only four were at low risk of detection bias. We deemed the majority (22 studies) at low risk of attrition bias and of other biases (23 studies).
Potential biases in the review process
The findings of this review need to be considered with caution as a number of the studies excluded participants who were not considered suitable for an HME (Alcoforado 2012; Boots 2006; Branson 1996; Daoud 1991; Lacherade 2005; Memish 2001). In addition, participants could be swapped to the HH group because of thick and bloody secretions in the study by Branson 1996; because of hypothermia and to minimize deadspace in Hurni 1997; and due to "specific indications" in Kollef 1998. Memish 2001 excluded participants who discontinued HME although it was not clear why they were discontinued. The study by Martin 1990 was interrupted after a participant in the HME group died following total occlusion of the artificial airway. Two studies changed HMEs more frequently, if considered necessary (Boots 1997; Boots 2006).
Agreements and disagreements with other studies or reviews
Two earlier narrative reviews found that VAP was reduced when an HME was used compared to an HH but these conclusions were not strongly supported by the data (Bench 2003; Cook 1998). Only one of the five studies in the review by Cook 1998, and neither of the two studies in Bench 2003, showed a significant difference in VAP. One meta‐analysis of eight trials with 1368 participants by Kola 2005 also found pneumonia was reduced when an HME was used in people who had mechanical ventilation for seven days or more.
However, as with this review update and our original Cochrane Review (Kelly 2010a; Kelly 2010b), we found no difference in the risk of VAP when HMEs or HHs were used. These findings were also reported by Siempos 2007 in their meta‐analysis of 2580 participants in 13 trials and by Niël‐Weise 2007 in their meta‐analysis of 2014 participants in 10 trials.
As with our reviews, other reviews also reported no difference between HH and HME in the risk of artificial airway occlusion (Bench 2003; Siempos 2007), mortality (Siempos 2007), or length of ICU stay (Siempos 2007).
As with our findings, Siempos and colleagues found that HME reduced humidification costs (Siempos 2007).
An additional meta‐analysis and meta‐regression of HME versus HH in critically ill adults was published during this update (Vargas 2017). We had previously included 17 of the 18 studies included by Vargas 2017 who found no overall difference between HME and HH in the rates of airway occlusion, pneumonia or mortality.
Methodological quality graph: review authors' judgements about each methodological quality item presented as percentages across all included studies.
Methodological quality summary: review authors' judgements about each methodological quality item for each included study.
Funnel plot of comparison: 1 Heat and moisture exchanger (HME) versus heat humidifier (HH) ‐ parallel studies, outcome: 1.1 Artificial airway occlusion.
Funnel plot of comparison: 1 Heat and moisture exchanger (HME) versus heat humidifier (HH) ‐ parallel studies, outcome: 1.2 Mortality.
Funnel plot of comparison: 1 Heat and moisture exchanger (HME) versus heat humidifier (HH) ‐ parallel studies, outcome: 1.3 Pneumonia.

Comparison 1 Heat and moisture exchanger (HME) versus heat humidifier (HH) ‐ parallel studies, Outcome 1 Artificial airway occlusion.
Comparison 1 Heat and moisture exchanger (HME) versus heat humidifier (HH) ‐ parallel studies, Outcome 2 Mortality.

Comparison 1 Heat and moisture exchanger (HME) versus heat humidifier (HH) ‐ parallel studies, Outcome 3 Pneumonia.
Comparison 1 Heat and moisture exchanger (HME) versus heat humidifier (HH) ‐ parallel studies, Outcome 4 Atelectasis.

Comparison 1 Heat and moisture exchanger (HME) versus heat humidifier (HH) ‐ parallel studies, Outcome 5 Tracheal aspirations (per day).

Comparison 1 Heat and moisture exchanger (HME) versus heat humidifier (HH) ‐ parallel studies, Outcome 6 Saline instillations (number per day).
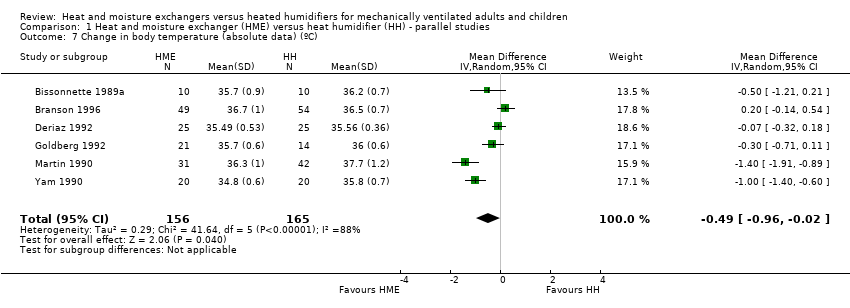
Comparison 1 Heat and moisture exchanger (HME) versus heat humidifier (HH) ‐ parallel studies, Outcome 7 Change in body temperature (absolute data) (ºC).
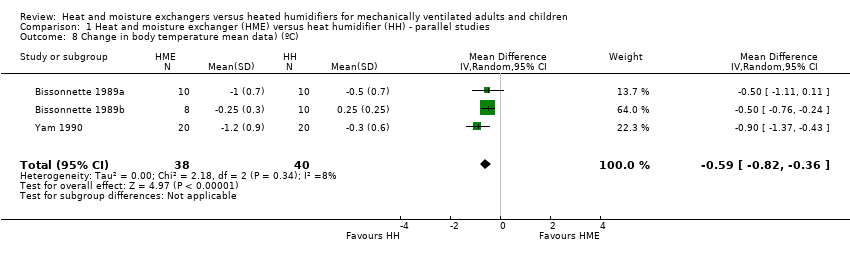
Comparison 1 Heat and moisture exchanger (HME) versus heat humidifier (HH) ‐ parallel studies, Outcome 8 Change in body temperature mean data) (ºC).

Comparison 2 Heat and moisture exchanger (HME) versus heat humidifier (HH) ‐ cross‐over studies, Outcome 1 PaO2 (mmHg).
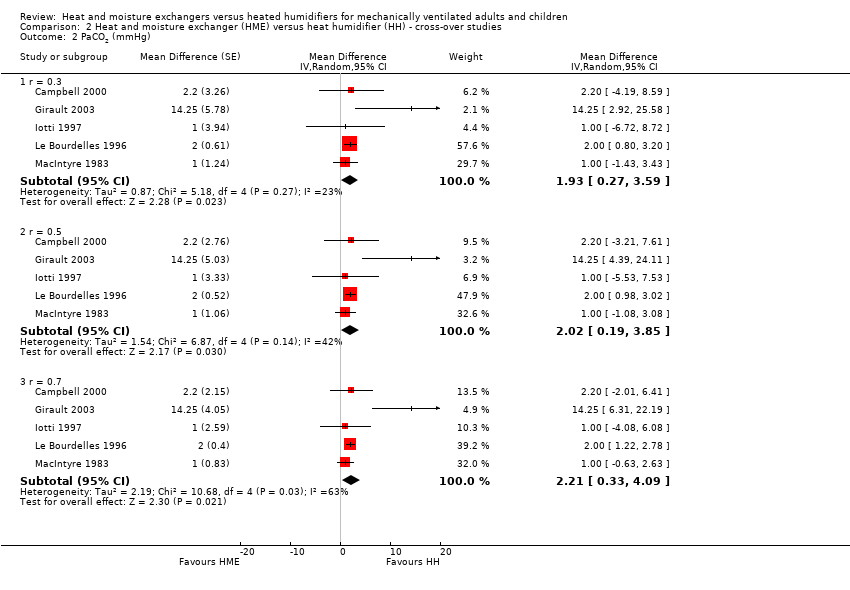
Comparison 2 Heat and moisture exchanger (HME) versus heat humidifier (HH) ‐ cross‐over studies, Outcome 2 PaCO2 (mmHg).
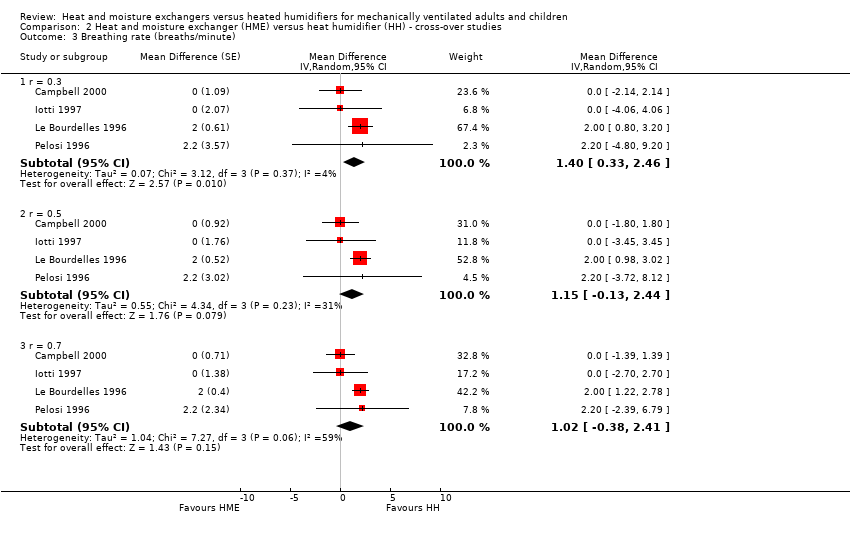
Comparison 2 Heat and moisture exchanger (HME) versus heat humidifier (HH) ‐ cross‐over studies, Outcome 3 Breathing rate (breaths/minute).
Comparison 2 Heat and moisture exchanger (HME) versus heat humidifier (HH) ‐ cross‐over studies, Outcome 4 Tidal volume (L).

Comparison 2 Heat and moisture exchanger (HME) versus heat humidifier (HH) ‐ cross‐over studies, Outcome 5 Minute ventilation (L/minute).
Comparison 2 Heat and moisture exchanger (HME) versus heat humidifier (HH) ‐ cross‐over studies, Outcome 6 Body temperature (ºC).

Comparison 3 Subgroup analysis ‐ children versus adults, Outcome 1 Artificial airway occlusion.

Comparison 3 Subgroup analysis ‐ children versus adults, Outcome 2 All‐cause mortality.

Comparison 4 Subgroup analysis ‐ length of ventilation, Outcome 1 Artificial airway occlusion.

Comparison 4 Subgroup analysis ‐ length of ventilation, Outcome 2 All‐cause mortality.

Comparison 4 Subgroup analysis ‐ length of ventilation, Outcome 3 Pneumonia.
Comparison 5 Subgroup analysis ‐ hygroscopic versus hydrophobic heat and moisture exchanger (HME), Outcome 1 Artificial airway occlusion.
Comparison 5 Subgroup analysis ‐ hygroscopic versus hydrophobic heat and moisture exchanger (HME), Outcome 2 All‐cause mortality.

Comparison 5 Subgroup analysis ‐ hygroscopic versus hydrophobic heat and moisture exchanger (HME), Outcome 3 Pneumonia.
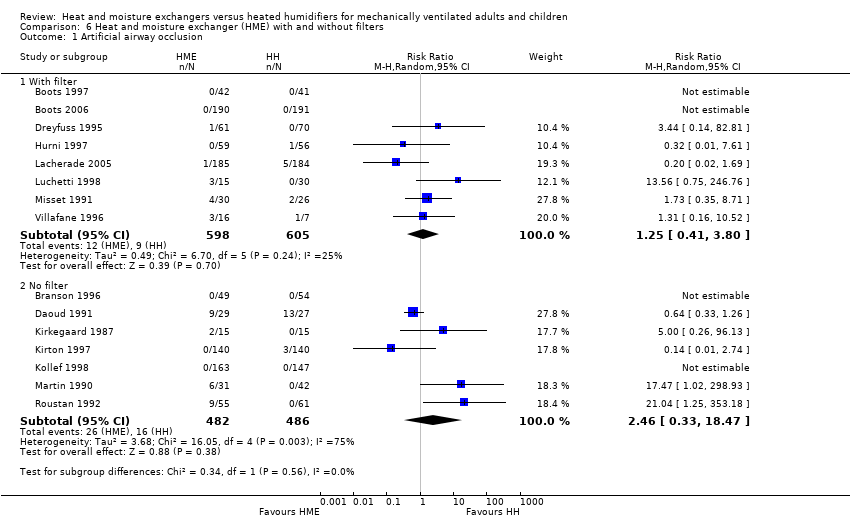
Comparison 6 Heat and moisture exchanger (HME) with and without filters, Outcome 1 Artificial airway occlusion.

Comparison 6 Heat and moisture exchanger (HME) with and without filters, Outcome 2 All‐cause mortality.
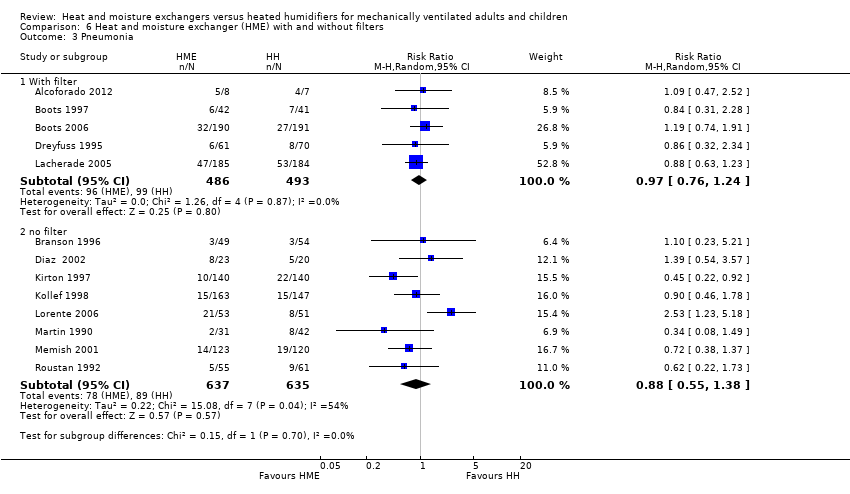
Comparison 6 Heat and moisture exchanger (HME) with and without filters, Outcome 3 Pneumonia.

Comparison 7 Sensitivity analyses ‐ selection bias, Outcome 1 Mortality.

Comparison 7 Sensitivity analyses ‐ selection bias, Outcome 2 Pneumonia.

Comparison 8 Sensitivity analyses ‐ detection bias, Outcome 1 Artificial airway occlusion.

Comparison 8 Sensitivity analyses ‐ detection bias, Outcome 2 Pneumonia.
| Heat and moisture exchangers (HME) compared to heated humidifiers (HH) for ventilated adults and children | ||||||
| Patient or population: ventilated adults (18 trials) and children (1 trial) Settings: ICUs (17), NICU (1), and hospitals (1) in France (7), USA (3), Australia (2), Brazil (2), Denmark (1), Italy (1), Saudi Arabia (1), Spain (1), Switzerland (1) Intervention: HME Comparison: HH | ||||||
| Outcomes | Illustrative comparative risks* (95% CI) | Relative effect | No of participants | Quality of the evidence | Comments | |
| Assumed risk | Corresponding risk | |||||
| HH | HME | |||||
| Artificial airway occlusion (measured over 3‐15 days (median 4 days)) | 23 per 1000 | 37 per 1000 | RR 1.59 | 2171 | ⊕⊕⊝⊝ 1 L ow | Allocation and blinding unclear in 13 studies; moderate heterogeneity. |
| Mortality ‐ all cause (Measured over 3‐15 days (median 8 days)) | 247 per 1000 | 257 per 1000 | RR 1.03 | 1951 | ⊕⊕⊝⊝ 2 L ow | Allocation and blinding unclear in 9 and 11 studies; low heterogeneity. |
| Pneumonia (Measured over 4‐21 days (median 4 days)) | 32 per 1000 | 30 per 1000 | RR 0.93 | 2251 | ⊕⊕⊝⊝ 3 L ow | Allocation and blinding unclear in more than half of studies; moderate heterogeneity though this was due to only 1 study. |
| *The basis for the assumed risk (e.g. the median control group risk across studies) is provided in footnotes. The corresponding risk (and its 95% confidence interval) is based on the assumed risk in the comparison group and the relative effect of the intervention (and its 95% CI). | ||||||
| GRADE Working Group grades of evidence | ||||||
| The assumed and corresponding risks were calculated from data in included trials. 1 Quality downgraded two levels for serious indirectness because participants may not have been considered suitable for HME in three studies and could be taken out of the HME group in three studies. 2 Quality downgraded two levels for serious indirectness because participants may not have been considered suitable for HME in two studies and could be taken out of the HME group in three studies. 3 Quality downgraded two levels for serious indirectness because participants may not have been considered suitable for HME in two studies and could be taken out of the HME group in three studies. | ||||||
| Study | HH | HME | No of participants |
| 9 | 7 | 381 | |
| 4 | 4 | 43 | |
| 13.80 | 11.10 | 104 | |
| 5.30 | 5.70 | 310 | |
| 25.3 | 21.4 | 369 | |
| 9.30 | 13.90 | 116 | |
| HH: heated humidification; HME: heat and moisture exchangers. | |||
| Study | HH | HME | No of participants |
| 11 | 10 | 43 | |
| 16.50 | 16.50 | 310 | |
| HH: heated humidification; HME: heat and moisture exchangers. | |||
| Study | HME | HH | Units | Participants |
| 6.72 | 8.20 | AUD/day | 83 | |
| 8.62 | 9.27 | AUD/day | 381 | |
| 4.70 | 8.97 | USD/day | 99 | |
| 5.00 | 11.00 | USD/day (France) | 131 | |
| 17.46 | 27.80 | USD/participant | 280 | |
| 15.98 | 38.26 | USD/participant | 310 | |
| HH: heated humidification; HME: heat and moisture exchangers. | ||||
| Study | HH | HME | Participants |
| 9.86 | 16.50 | 11 | |
| 13.6 | 20.8 | 10 | |
| HH: heated humidification; HME: heat and moisture exchangers. | |||
| Outcome or subgroup title | No. of studies | No. of participants | Statistical method | Effect size |
| 1 Artificial airway occlusion Show forest plot | 15 | 2171 | Risk Ratio (M‐H, Random, 95% CI) | 1.59 [0.60, 4.19] |
| 2 Mortality Show forest plot | 12 | Risk Ratio (M‐H, Random, 95% CI) | Subtotals only | |
| 2.1 All cause | 12 | 1951 | Risk Ratio (M‐H, Random, 95% CI) | 1.03 [0.89, 1.20] |
| 2.2 Pneumonia‐related | 3 | 484 | Risk Ratio (M‐H, Random, 95% CI) | 1.09 [0.39, 3.01] |
| 3 Pneumonia Show forest plot | 13 | 2251 | Risk Ratio (M‐H, Random, 95% CI) | 0.93 [0.73, 1.19] |
| 3.1 Throughout ventilation | 7 | 1090 | Risk Ratio (M‐H, Random, 95% CI) | 0.94 [0.69, 1.27] |
| 3.2 ≥ 48 hours after ventilation | 6 | 1161 | Risk Ratio (M‐H, Random, 95% CI) | 0.96 [0.64, 1.46] |
| 4 Atelectasis Show forest plot | 3 | 303 | Risk Ratio (M‐H, Random, 95% CI) | 0.85 [0.52, 1.40] |
| 5 Tracheal aspirations (per day) Show forest plot | 3 | 290 | Mean Difference (IV, Random, 95% CI) | ‐0.47 [‐1.41, 0.47] |
| 6 Saline instillations (number per day) Show forest plot | 3 | 276 | Std. Mean Difference (IV, Random, 95% CI) | ‐0.40 [‐0.64, ‐0.17] |
| 7 Change in body temperature (absolute data) (ºC) Show forest plot | 6 | 321 | Mean Difference (IV, Random, 95% CI) | ‐0.49 [‐0.96, ‐0.02] |
| 8 Change in body temperature mean data) (ºC) Show forest plot | 3 | 78 | Mean Difference (IV, Random, 95% CI) | ‐0.59 [‐0.82, ‐0.36] |
| Outcome or subgroup title | No. of studies | No. of participants | Statistical method | Effect size |
| 1 PaO2 (mmHg) Show forest plot | 4 | Mean Difference (Random, 95% CI) | Subtotals only | |
| 1.1 r = 0.3 | 4 | Mean Difference (Random, 95% CI) | ‐3.24 [‐16.08, 9.60] | |
| 1.2 r = 0.5 | 4 | Mean Difference (Random, 95% CI) | ‐3.87 [‐16.73, 9.00] | |
| 1.3 r = 0.7 | 4 | Mean Difference (Random, 95% CI) | ‐4.41 [‐17.09, 8.27] | |
| 2 PaCO2 (mmHg) Show forest plot | 5 | Mean Difference (Random, 95% CI) | Subtotals only | |
| 2.1 r = 0.3 | 5 | Mean Difference (Random, 95% CI) | 1.93 [0.27, 3.59] | |
| 2.2 r = 0.5 | 5 | Mean Difference (Random, 95% CI) | 2.02 [0.19, 3.85] | |
| 2.3 r = 0.7 | 5 | Mean Difference (Random, 95% CI) | 2.21 [0.33, 4.09] | |
| 3 Breathing rate (breaths/minute) Show forest plot | 4 | Mean Difference (Random, 95% CI) | Subtotals only | |
| 3.1 r = 0.3 | 4 | Mean Difference (Random, 95% CI) | 1.40 [0.33, 2.46] | |
| 3.2 r = 0.5 | 4 | Mean Difference (Random, 95% CI) | 1.15 [‐0.13, 2.44] | |
| 3.3 r = 0.7 | 4 | Mean Difference (Random, 95% CI) | 1.02 [‐0.38, 2.41] | |
| 4 Tidal volume (L) Show forest plot | 5 | Mean difference (Random, 95% CI) | Subtotals only | |
| 4.1 r = 0.3 | 5 | Mean difference (Random, 95% CI) | 0.02 [‐0.00, 0.03] | |
| 4.2 r = 0.5 | 5 | Mean difference (Random, 95% CI) | 0.02 [0.00, 0.04] | |
| 4.3 r = 0.7 | 5 | Mean difference (Random, 95% CI) | 0.03 [0.01, 0.06] | |
| 5 Minute ventilation (L/minute) Show forest plot | 5 | Mean difference (Random, 95% CI) | Subtotals only | |
| 5.1 r = 0.3 | 5 | Mean difference (Random, 95% CI) | 1.20 [0.78, 1.61] | |
| 5.2 r = 0.5 | 5 | Mean difference (Random, 95% CI) | 1.19 [0.63, 1.75] | |
| 5.3 r = 0.7 | 5 | Mean difference (Random, 95% CI) | 1.18 [0.55, 1.80] | |
| 6 Body temperature (ºC) Show forest plot | 2 | Mean Difference (Random, 95% CI) | Subtotals only | |
| 6.1 r = 0.3 | 2 | Mean Difference (Random, 95% CI) | ‐1.12 [‐3.77, 1.52] | |
| 6.2 r = 0.5 | 2 | Mean Difference (Random, 95% CI) | ‐1.13 [‐3.77, 1.52] | |
| 6.3 r = 0.7 | 2 | Mean Difference (Random, 95% CI) | ‐1.13 [‐3.78, 1.51] | |
| Outcome or subgroup title | No. of studies | No. of participants | Statistical method | Effect size |
| 1 Artificial airway occlusion Show forest plot | 15 | Risk Ratio (M‐H, Random, 95% CI) | Subtotals only | |
| 1.1 Children | 1 | 56 | Risk Ratio (M‐H, Random, 95% CI) | 0.64 [0.33, 1.26] |
| 1.2 Adults | 14 | 2115 | Risk Ratio (M‐H, Random, 95% CI) | 1.94 [0.65, 5.76] |
| 2 All‐cause mortality Show forest plot | 12 | Risk Ratio (M‐H, Random, 95% CI) | Subtotals only | |
| 2.1 Children | 1 | 56 | Risk Ratio (M‐H, Random, 95% CI) | 2.79 [0.62, 12.67] |
| 2.2 Adults | 11 | 1895 | Risk Ratio (M‐H, Random, 95% CI) | 1.02 [0.88, 1.19] |
| Outcome or subgroup title | No. of studies | No. of participants | Statistical method | Effect size |
| 1 Artificial airway occlusion Show forest plot | 15 | Risk Ratio (M‐H, Random, 95% CI) | Subtotals only | |
| 1.1 Medium‐term | 8 | 1031 | Risk Ratio (M‐H, Random, 95% CI) | 1.74 [0.41, 7.30] |
| 1.2 Long‐term | 7 | 1140 | Risk Ratio (M‐H, Random, 95% CI) | 1.47 [0.34, 6.36] |
| 2 All‐cause mortality Show forest plot | 11 | Risk Ratio (M‐H, Random, 95% CI) | Subtotals only | |
| 2.1 Medium‐term | 5 | 860 | Risk Ratio (M‐H, Random, 95% CI) | 1.01 [0.78, 1.31] |
| 2.2 Long‐term | 6 | 1048 | Risk Ratio (M‐H, Random, 95% CI) | 1.03 [0.85, 1.25] |
| 3 Pneumonia Show forest plot | 11 | Risk Ratio (M‐H, Random, 95% CI) | Subtotals only | |
| 3.1 Medium‐term | 5 | 892 | Risk Ratio (M‐H, Random, 95% CI) | 1.06 [0.77, 1.47] |
| 3.2 Long‐term | 6 | 1036 | Risk Ratio (M‐H, Random, 95% CI) | 0.91 [0.59, 1.43] |
| Outcome or subgroup title | No. of studies | No. of participants | Statistical method | Effect size |
| 1 Artificial airway occlusion Show forest plot | 15 | Risk Ratio (M‐H, Random, 95% CI) | Subtotals only | |
| 1.1 Hydrophobic | 5 | 540 | Risk Ratio (M‐H, Random, 95% CI) | 2.86 [0.65, 12.62] |
| 1.2 Hygroscopic | 11 | 1638 | Risk Ratio (M‐H, Random, 95% CI) | 0.89 [0.32, 2.48] |
| 2 All‐cause mortality Show forest plot | 11 | Risk Ratio (M‐H, Random, 95% CI) | Subtotals only | |
| 2.1 Hydrophobic | 2 | 189 | Risk Ratio (M‐H, Random, 95% CI) | 0.79 [0.46, 1.35] |
| 2.2 Hygroscopic | 9 | 1719 | Risk Ratio (M‐H, Random, 95% CI) | 1.05 [0.89, 1.23] |
| 3 Pneumonia Show forest plot | 12 | Risk Ratio (M‐H, Random, 95% CI) | Subtotals only | |
| 3.1 Hydrophobic | 3 | 469 | Risk Ratio (M‐H, Random, 95% CI) | 0.48 [0.28, 0.82] |
| 3.2 Hygroscopic | 9 | 1678 | Risk Ratio (M‐H, Random, 95% CI) | 0.95 [0.77, 1.17] |
| Outcome or subgroup title | No. of studies | No. of participants | Statistical method | Effect size |
| 1 Artificial airway occlusion Show forest plot | 15 | Risk Ratio (M‐H, Random, 95% CI) | Subtotals only | |
| 1.1 With filter | 8 | 1203 | Risk Ratio (M‐H, Random, 95% CI) | 1.25 [0.41, 3.80] |
| 1.2 No filter | 7 | 968 | Risk Ratio (M‐H, Random, 95% CI) | 2.46 [0.33, 18.47] |
| 2 All‐cause mortality Show forest plot | 12 | Risk Ratio (M‐H, Random, 95% CI) | Subtotals only | |
| 2.1 With filter | 5 | 1080 | Risk Ratio (M‐H, Random, 95% CI) | 1.00 [0.82, 1.22] |
| 2.2 No filter | 7 | 871 | Risk Ratio (M‐H, Random, 95% CI) | 1.08 [0.85, 1.36] |
| 3 Pneumonia Show forest plot | 13 | Risk Ratio (M‐H, Random, 95% CI) | Subtotals only | |
| 3.1 With filter | 5 | 979 | Risk Ratio (M‐H, Random, 95% CI) | 0.97 [0.76, 1.24] |
| 3.2 no filter | 8 | 1272 | Risk Ratio (M‐H, Random, 95% CI) | 0.88 [0.55, 1.38] |
| Outcome or subgroup title | No. of studies | No. of participants | Statistical method | Effect size |
| 1 Mortality Show forest plot | 12 | Risk Ratio (M‐H, Random, 95% CI) | Subtotals only | |
| 1.1 Low risk of bias | 2 | 286 | Risk Ratio (M‐H, Random, 95% CI) | 1.31 [0.91, 1.90] |
| 1.2 Unknown risk of bias | 10 | 1665 | Risk Ratio (M‐H, Random, 95% CI) | 0.98 [0.83, 1.16] |
| 2 Pneumonia Show forest plot | 13 | Risk Ratio (M‐H, Random, 95% CI) | Subtotals only | |
| 2.1 Low risk of bias | 3 | 566 | Risk Ratio (M‐H, Random, 95% CI) | 0.72 [0.41, 1.28] |
| 2.2 Unknown risk of bias | 9 | 1582 | Risk Ratio (M‐H, Random, 95% CI) | 1.01 [0.77, 1.33] |
| 2.3 High risk of bias | 1 | 103 | Risk Ratio (M‐H, Random, 95% CI) | 1.10 [0.23, 5.21] |
| Outcome or subgroup title | No. of studies | No. of participants | Statistical method | Effect size |
| 1 Artificial airway occlusion Show forest plot | 15 | 2171 | Risk Ratio (M‐H, Random, 95% CI) | 1.59 [0.60, 4.19] |
| 1.1 Low risk of bias | 2 | 590 | Risk Ratio (M‐H, Random, 95% CI) | 0.14 [0.01, 2.74] |
| 1.2 Unclear risk of bias | 13 | 1581 | Risk Ratio (M‐H, Random, 95% CI) | 1.92 [0.69, 5.34] |
| 2 Pneumonia Show forest plot | 12 | Risk Ratio (M‐H, Random, 95% CI) | Subtotals only | |
| 2.1 Low risk of bias | 4 | 648 | Risk Ratio (M‐H, Random, 95% CI) | 0.84 [0.52, 1.36] |
| 2.2 Unknown risk of bias | 8 | 1500 | Risk Ratio (M‐H, Random, 95% CI) | 0.97 [0.70, 1.33] |