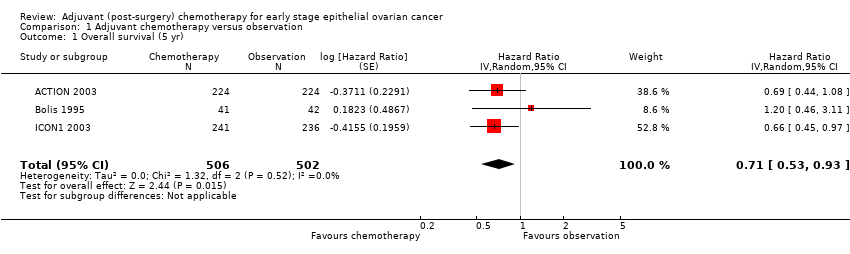
| 1 Overall survival (5 yr) Show forest plot | 3 | 1008 | Hazard Ratio (Random, 95% CI) | 0.71 [0.53, 0.93] |
|
| 2 Deaths total (5 yr) Show forest plot | 4 | 1089 | Risk Ratio (M‐H, Random, 95% CI) | 0.72 [0.56, 0.93] |
|
| 3 Overall survival (10 yr) Show forest plot | 2 | 925 | Hazard Ratio (Random, 95% CI) | 0.72 [0.57, 0.92] |
|
| 4 Death total (10 yr) Show forest plot | 2 | 923 | Risk Ratio (M‐H, Random, 95% CI) | 0.76 [0.62, 0.94] |
|
| 5 Progression‐free survival (5 yr) Show forest plot | 4 | 1170 | Hazard Ratio (Random, 95% CI) | 0.67 [0.53, 0.84] |
|
| 6 Progression total (5 yr) Show forest plot | 4 | 1089 | Risk Ratio (M‐H, Random, 95% CI) | 0.69 [0.57, 0.84] |
|
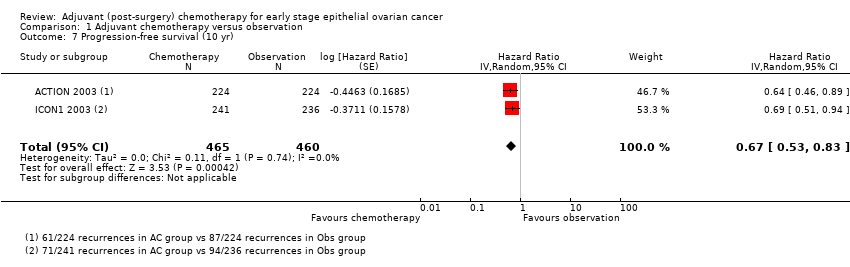
| 7 Progression‐free survival (10 yr) Show forest plot | 2 | 925 | Hazard Ratio (Random, 95% CI) | 0.67 [0.53, 0.83] |
|
| 8 Progression total (10 yr) Show forest plot | 2 | 925 | Risk Ratio (M‐H, Random, 95% CI) | 0.72 [0.60, 0.87] |
|
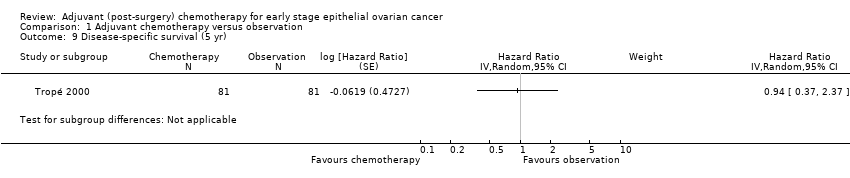
| 9 Disease‐specific survival (5 yr) Show forest plot | 1 | | Hazard Ratio (Random, 95% CI) | Subtotals only |
|
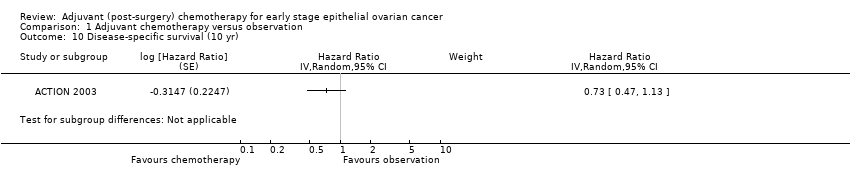
| 10 Disease‐specific survival (10 yr) Show forest plot | 1 | | Hazard Ratio (Random, 95% CI) | Subtotals only |
|
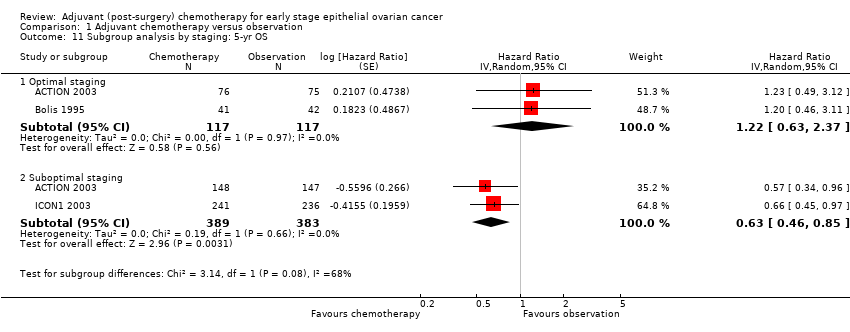
| 11 Subgroup analysis by staging: 5‐yr OS Show forest plot | 3 | | Hazard Ratio (Random, 95% CI) | Subtotals only |
|
| 11.1 Optimal staging | 2 | 234 | Hazard Ratio (Random, 95% CI) | 1.22 [0.63, 2.37] |
| 11.2 Suboptimal staging | 2 | 772 | Hazard Ratio (Random, 95% CI) | 0.63 [0.46, 0.85] |
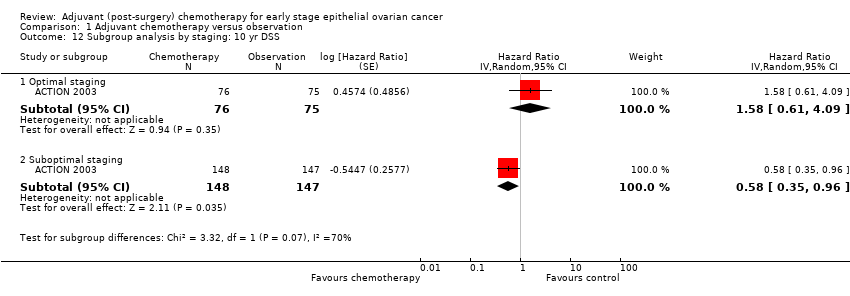
| 12 Subgroup analysis by staging: 10 yr DSS Show forest plot | 1 | | Hazard Ratio (Random, 95% CI) | Subtotals only |
|
| 12.1 Optimal staging | 1 | 151 | Hazard Ratio (Random, 95% CI) | 1.58 [0.61, 4.09] |
| 12.2 Suboptimal staging | 1 | 295 | Hazard Ratio (Random, 95% CI) | 0.58 [0.35, 0.96] |
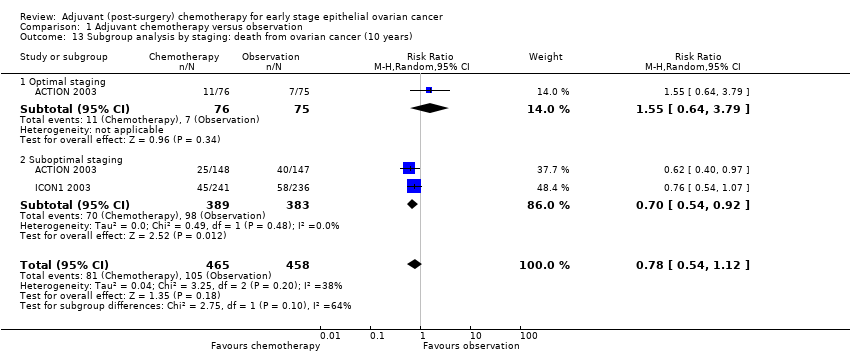
| 13 Subgroup analysis by staging: death from ovarian cancer (10 years) Show forest plot | 2 | 923 | Risk Ratio (M‐H, Random, 95% CI) | 0.78 [0.54, 1.12] |
|
| 13.1 Optimal staging | 1 | 151 | Risk Ratio (M‐H, Random, 95% CI) | 1.55 [0.64, 3.79] |
| 13.2 Suboptimal staging | 2 | 772 | Risk Ratio (M‐H, Random, 95% CI) | 0.70 [0.54, 0.92] |
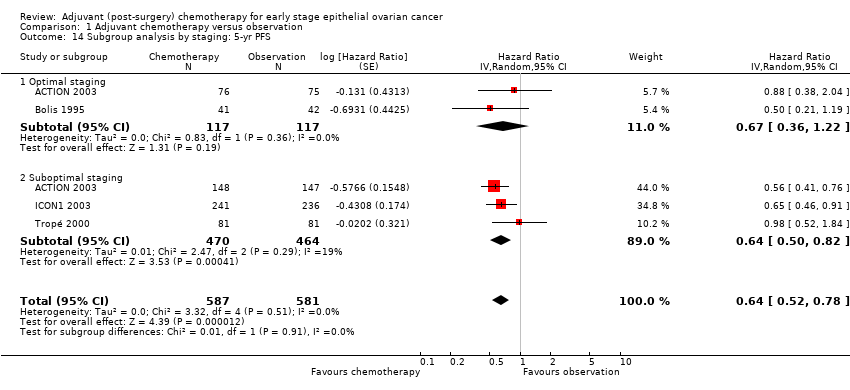
| 14 Subgroup analysis by staging: 5‐yr PFS Show forest plot | 4 | 1168 | Hazard Ratio (Random, 95% CI) | 0.64 [0.52, 0.78] |
|
| 14.1 Optimal staging | 2 | 234 | Hazard Ratio (Random, 95% CI) | 0.67 [0.36, 1.22] |
| 14.2 Suboptimal staging | 3 | 934 | Hazard Ratio (Random, 95% CI) | 0.64 [0.50, 0.82] |
| 15 Subgroup analysis by staging: 10‐yr PFS Show forest plot | 2 | 923 | Hazard Ratio (Random, 95% CI) | 0.66 [0.53, 0.83] |
|
| 15.1 Optimal staging | 1 | 151 | Hazard Ratio (Random, 95% CI) | 0.73 [0.38, 1.42] |
| 15.2 Suboptimal staging | 2 | 772 | Hazard Ratio (Random, 95% CI) | 0.65 [0.52, 0.83] |
| 16 Subgroup analysis by staging: progression of ovarian cancer (10 years) Show forest plot | 2 | 923 | Risk Ratio (M‐H, Random, 95% CI) | 0.71 [0.58, 0.87] |
|
| 16.1 Optimal staging | 1 | 151 | Risk Ratio (M‐H, Random, 95% CI) | 0.70 [0.39, 1.26] |
| 16.2 Suboptimal staging | 2 | 772 | Risk Ratio (M‐H, Random, 95% CI) | 0.71 [0.58, 0.88] |
| 17 Subgroup analysis by risk: 10‐yr OS Show forest plot | 1 | 414 | Hazard Ratio (Random, 95% CI) | 0.66 [0.38, 1.13] |
|
| 17.1 Low/intermediate risk | 1 | 198 | Hazard Ratio (Random, 95% CI) | 0.91 [0.49, 1.69] |
| 17.2 High risk | 1 | 216 | Hazard Ratio (Random, 95% CI) | 0.52 [0.33, 0.81] |
| 18 Subgroup analysis by risk: 10‐yr PFS Show forest plot | 1 | 414 | Hazard Ratio (Random, 95% CI) | 0.64 [0.34, 1.21] |
|
| 18.1 Low/medium | 1 | 198 | Hazard Ratio (Random, 95% CI) | 0.92 [0.52, 1.64] |
| 18.2 High | 1 | 216 | Hazard Ratio (Random, 95% CI) | 0.48 [0.32, 0.73] |
| 19 Subgroup analysis by risk: progression at 10 yrs Show forest plot | 1 | 414 | Risk Ratio (M‐H, Random, 95% CI) | 0.71 [0.53, 0.95] |
|
| 19.1 Low/intermediate risk | 1 | 198 | Risk Ratio (M‐H, Random, 95% CI) | 0.88 [0.53, 1.46] |
| 19.2 High risk | 1 | 216 | Risk Ratio (M‐H, Random, 95% CI) | 0.64 [0.46, 0.90] |
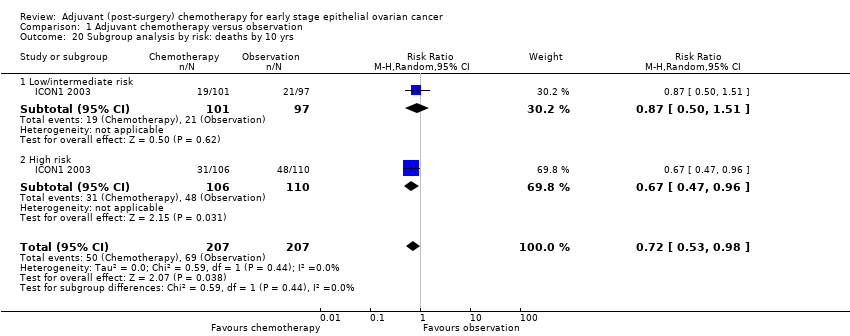
| 20 Subgroup analysis by risk: deaths by 10 yrs Show forest plot | 1 | 414 | Risk Ratio (M‐H, Random, 95% CI) | 0.72 [0.53, 0.98] |
|
| 20.1 Low/intermediate risk | 1 | 198 | Risk Ratio (M‐H, Random, 95% CI) | 0.87 [0.50, 1.51] |
| 20.2 High risk | 1 | 216 | Risk Ratio (M‐H, Random, 95% CI) | 0.67 [0.47, 0.96] |