Leche maternizada enriquecida con nutrientes versus leche maternizada estándar para lactantes prematuros después del alta hospitalaria
Información
- DOI:
- https://doi.org/10.1002/14651858.CD004696.pub5Copiar DOI

- Base de datos:
-
- Cochrane Database of Systematic Reviews
- Versión publicada:
-
- 13 diciembre 2016see what's new
- Tipo:
-
- Intervention
- Etapa:
-
- Review
- Grupo Editorial Cochrane:
-
Grupo Cochrane de Neonatología
- Copyright:
-
- Copyright © 2016 The Cochrane Collaboration. Published by John Wiley & Sons, Ltd.
Cifras del artículo
Altmetric:
Citado por:
Autores
Contributions of authors
William McGuire and Lauren Young undertook the electronic search and identified citations for possible inclusion. Lauren Young, William McGuire and Nick Embleton reviewed the citation list (title and abstract) for inclusion and undertook methodological appraisal and data extraction, entry and analysis. William McGuire acted as an arbiter for disagreements, reviewed data entered and analysed and completed the review.
Sources of support
Internal sources
-
Centre for Reviews and Dissemination, University of York, UK.
-
Royal Victoria Infirmary, Newcastle upon Tyne, UK.
External sources
-
NIHR, UK.
This report is independent research funded by a UK National Institute of Health Research Grant (NIHR) Cochrane Programme Grant (13/89/12). The views expressed in this publication are those of the review authors and are not necessarily those of the NHS, the NIHR or the UK Department of Health.
-
Eunice Kennedy Shriver National Institute of Child Health and Human Development, National Institutes of Health, Department of Health and Human Services, USA.
Editorial support of the Cochrane Neonatal Review Group has been provided by Federal funds from the Eunice Kennedy Shriver National Institute of Child Health and Human Development, National Institutes of Health, Department of Health and Human Services, USA, under Contract No. HHSN275201600005C.
Declarations of interest
Nick Embleton has conducted research with support from manufacturers of infant formula including Nestec SA (Switzerland), Wyeth UK and Nutricia UK, but did not receive payment, support nor benefit in kind for contributions to this review.
Acknowledgements
We thank Dr Litmanovitz for clarifying aspects of Litmanovitz 2004.
We thank Dr Roggero for kindly providing unpublished data from Roggero 2011 for inclusion in this review.
We thank Yolanda Brosseau and Colleen Ovelman of the Cochrane Neonatal Review Group for help in preparing this updated review.
Editorial support of the Cochrane Neonatal Review Group has been provided with Federal funds from the Eunice Kennedy Shriver National Institute of Child Health and Human Development, National Institutes of Health, Department of Health and Human Services, USA, under Contract No. HHSN275201100016C.
Version history
| Published | Title | Stage | Authors | Version |
| 2016 Dec 13 | Nutrient‐enriched formula versus standard formula for preterm infants following hospital discharge | Review | Lauren Young, Nicholas D Embleton, William McGuire | |
| 2012 Mar 14 | Nutrient‐enriched formula versus standard term formula for preterm infants following hospital discharge | Review | Lauren Young, Jessie Morgan, Felicia M McCormick, William McGuire | |
| 2007 Oct 17 | Nutrient‐enriched formula versus standard term formula for preterm infants following hospital discharge | Review | Ginny Henderson, Tom Fahey, William McGuire | |
| 2005 Apr 20 | Calorie and protein‐enriched formula versus standard term formula for improving growth and development in preterm or low birth weight infants following hospital discharge | Review | Ginny Henderson, Tom Fahey, William McGuire | |
| 2004 Apr 19 | Calorie and protein‐enriched formula versus standard term formula for improving growth and development in preterm or low birth weight infants following hospital discharge | Protocol | William McGuire, Tom Fahey | |
Differences between protocol and review
We added the methods and plan for Summary of findings tables and GRADE recommendations, which were not included in the original protocol nor in the previously published review.
Keywords
MeSH
Medical Subject Headings (MeSH) Keywords
- *Infant Formula [standards];
- Child Development [*physiology];
- Dietary Proteins [administration & dosage];
- Energy Intake [*physiology];
- Infant Nutritional Physiological Phenomena;
- Infant, Low Birth Weight [growth & development];
- Infant, Premature [*growth & development];
- Patient Discharge;
- Randomized Controlled Trials as Topic;
Medical Subject Headings Check Words
Humans; Infant; Infant, Newborn;
PICO

Study flow diagram: review update.
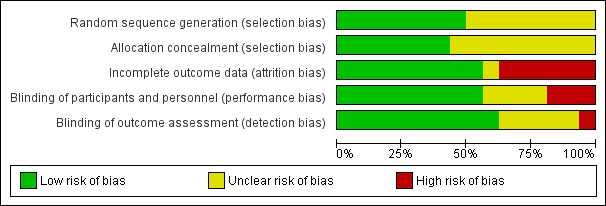
Risk of bias graph: review authors' judgements about each risk of bias item presented as percentages across all included studies.

Forest plot of comparison: 1 Postdischarge formula versus standard term formula, outcome: 1.2 Weight (grams).
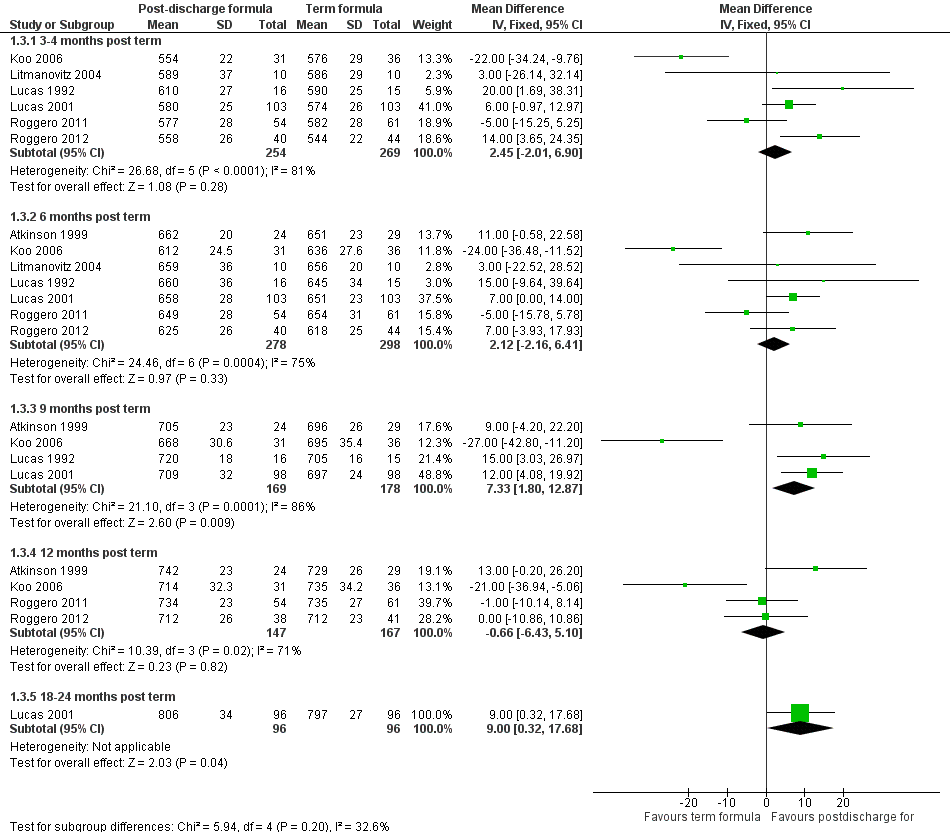
Forest plot of comparison: 1 Postdischarge formula versus standard term formula, outcome: 1.3 Crown‐heel length (mm).

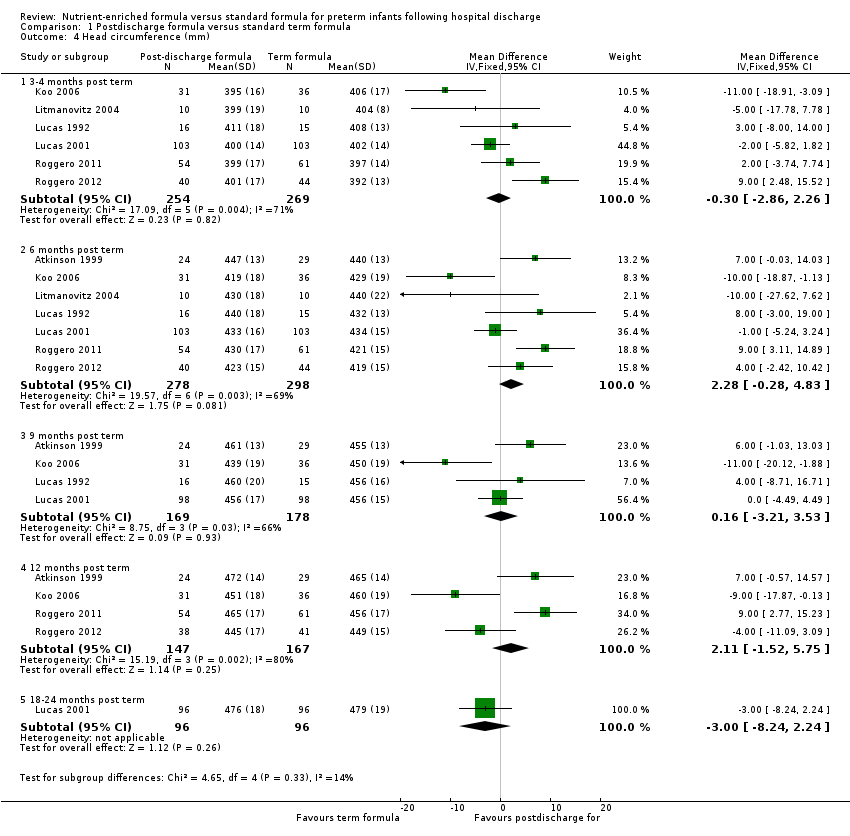
Forest plot of comparison: 1 Postdischarge formula versus standard term formula, outcome: 1.4 Head circumference (mm).

Forest plot of comparison: 2 Preterm formula versus standard term formula, outcome: 2.2 Weight (grams).

Forest plot of comparison: 2 Preterm formula versus standard term formula, outcome: 2.3 Crown‐heel length (mm).

Forest plot of comparison: 2 Preterm formula versus standard term formula, outcome: 2.4 Head circumference (mm).
Comparison 1 Postdischarge formula versus standard term formula, Outcome 1 Growth rates during trial period.

Comparison 1 Postdischarge formula versus standard term formula, Outcome 2 Weight (grams).

Comparison 1 Postdischarge formula versus standard term formula, Outcome 3 Crown‐heel length (mm).
Comparison 1 Postdischarge formula versus standard term formula, Outcome 4 Head circumference (mm).

Comparison 1 Postdischarge formula versus standard term formula, Outcome 5 Development.

Comparison 1 Postdischarge formula versus standard term formula, Outcome 6 Bone mineralisation.

Comparison 2 Preterm formula versus standard term formula, Outcome 1 Growth rates during trial period.

Comparison 2 Preterm formula versus standard term formula, Outcome 2 Weight (grams).

Comparison 2 Preterm formula versus standard term formula, Outcome 3 Crown‐heel length (mm).

Comparison 2 Preterm formula versus standard term formula, Outcome 4 Head circumference (mm).

Comparison 2 Preterm formula versus standard term formula, Outcome 5 Development.
| Postdischarge formula compared with standard term formula for preterm infants after hospital discharge | ||||
| Patient or population: preterm infants after hospital discharge | ||||
| Outcomes | Anticipated absolute effects* (95% CI) | Number of participants | Quality of the evidence | Comments |
| Postdischarge formula vs standard term formula | ||||
| Weight (grams) 3‐4 months post term | MD 7.45 g lower | 523 | ⊕⊕⊕⊝ | Downgraded for moderate inconsistency (I² = 62%) |
| Weight (grams) 6 months post term | MD 35.54 g higher | 576 | ⊕⊕⊕⊝ | Downgraded for inconsistency moderate (I² = 64%). |
| Crown‐heel length (mm) 3‐4 months post term | MD 2.45 mm higher | 523 | ⊕⊕⊕⊝ | Downgraded for high inconsistency (I² = 81%) |
| Crown‐heel length (mm) 6 months post term | MD 2.12 mm higher | 576 | ⊕⊕⊕⊝ | Downgraded for moderate inconsistency (I² = 75%) |
| Head circumference (mm) 3‐4 months post term | MD 0.3 mm lower | 523 | ⊕⊕⊕⊝ | Downgraded for moderate inconsistency (I² = 71%) |
| Head circumference (mm) 6 months post term | MD 2.28 mm higher | 576 | ⊕⊕⊕⊝ | Downgraded for moderate inconsistency (I² = 69%) |
| Development ‐ Bayley Scales of Infant Development II: Mental Development Index | MD 0.9 higher | 184 | ⊕⊕⊕⊕ | |
| Preterm formula compared with standard term formula for preterm infants after hospital discharge | ||||
| Patient or population: preterm infants after hospital discharge | ||||
| Outcomes | Anticipated absolute effects* (95% CI) | Number of participants | Quality of the evidence | Comments |
| Preterm formula vs standard term formula | ||||
| Weight (grams) 3‐4 months post term | MD 74.41 g higher | 130 | ⊕⊕⊕⊝ | Downgraded for imprecision |
| Weight (grams) 6 months post term | MD 74.6 g higher | 273 | ⊕⊕⊕⊝ | Downgraded for imprecision |
| Crown‐heel length (mm) 3‐4 months post term | MD 2.27 mm lower | 130 | ⊕⊕⊕⊝ | Downgraded for imprecision |
| Crown‐heel length (mm) 6 months post term | MD 1.83 mm higher | 160 | ⊕⊕⊕⊝ | Downgraded for imprecision |
| Head circumference (mm) 3‐4 months post term | MD 3.61 mm higher | 130 | ⊕⊕⊕⊝ | Downgraded for imprecision |
| Head circumference (mm) 6 months post term | MD 5.82 mm higher | 160 | ⊕⊕⊕⊝ | Downgraded for imprecision |
| Development ‐ Bayley Scales of Infant Development II: Mental Development Index | MD 1.44 lower | 143 | ⊕⊕⊕⊕ | |
| Outcome or subgroup title | No. of studies | No. of participants | Statistical method | Effect size |
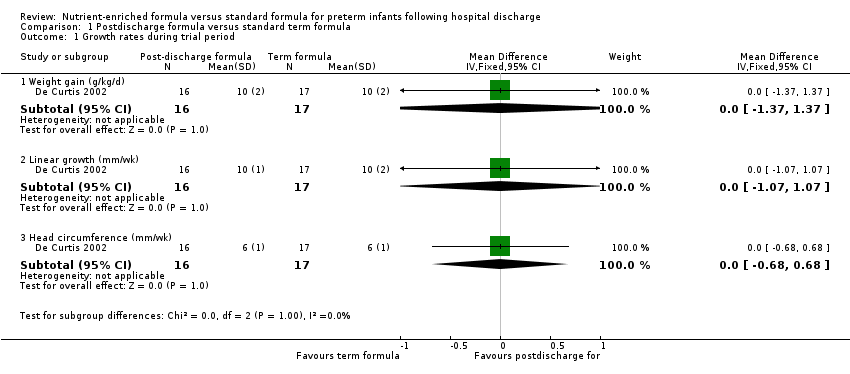
| 1 Growth rates during trial period Show forest plot | 1 | Mean Difference (IV, Fixed, 95% CI) | Subtotals only | |
| 1.1 Weight gain (g/kg/d) | 1 | 33 | Mean Difference (IV, Fixed, 95% CI) | 0.0 [‐1.37, 1.37] |
| 1.2 Linear growth (mm/wk) | 1 | 33 | Mean Difference (IV, Fixed, 95% CI) | 0.0 [‐1.07, 1.07] |
| 1.3 Head circumference (mm/wk) | 1 | 33 | Mean Difference (IV, Fixed, 95% CI) | 0.0 [‐0.68, 0.68] |
| 2 Weight (grams) Show forest plot | 7 | Mean Difference (IV, Fixed, 95% CI) | Subtotals only | |
| 2.1 3‐4 months post term | 6 | 523 | Mean Difference (IV, Fixed, 95% CI) | ‐7.45 [‐141.84, 126.93] |
| 2.2 6 months post term | 7 | 576 | Mean Difference (IV, Fixed, 95% CI) | 35.54 [‐113.71, 184.78] |
| 2.3 9 months post term | 4 | 347 | Mean Difference (IV, Fixed, 95% CI) | 244.09 [16.95, 471.23] |
| 2.4 12 months post term | 4 | 314 | Mean Difference (IV, Fixed, 95% CI) | ‐14.87 [‐243.18, 213.43] |
| 2.5 18‐24 months post term | 1 | 192 | Mean Difference (IV, Fixed, 95% CI) | 100.0 [‐246.90, 446.90] |
| 3 Crown‐heel length (mm) Show forest plot | 7 | Mean Difference (IV, Fixed, 95% CI) | Subtotals only | |
| 3.1 3‐4 months post term | 6 | 523 | Mean Difference (IV, Fixed, 95% CI) | 2.45 [‐2.01, 6.90] |
| 3.2 6 months post term | 7 | 576 | Mean Difference (IV, Fixed, 95% CI) | 2.12 [‐2.16, 6.41] |
| 3.3 9 months post term | 4 | 347 | Mean Difference (IV, Fixed, 95% CI) | 7.33 [1.80, 12.87] |
| 3.4 12 months post term | 4 | 314 | Mean Difference (IV, Fixed, 95% CI) | ‐0.66 [‐6.43, 5.10] |
| 3.5 18‐24 months post term | 1 | 192 | Mean Difference (IV, Fixed, 95% CI) | 9.0 [0.32, 17.68] |
| 4 Head circumference (mm) Show forest plot | 7 | Mean Difference (IV, Fixed, 95% CI) | Subtotals only | |
| 4.1 3‐4 months post term | 6 | 523 | Mean Difference (IV, Fixed, 95% CI) | ‐0.30 [‐2.86, 2.26] |
| 4.2 6 months post term | 7 | 576 | Mean Difference (IV, Fixed, 95% CI) | 2.28 [‐0.28, 4.83] |
| 4.3 9 months post term | 4 | 347 | Mean Difference (IV, Fixed, 95% CI) | 0.16 [‐3.21, 3.53] |
| 4.4 12 months post term | 4 | 314 | Mean Difference (IV, Fixed, 95% CI) | 2.11 [‐1.52, 5.75] |
| 4.5 18‐24 months post term | 1 | 192 | Mean Difference (IV, Fixed, 95% CI) | ‐3.0 [‐8.24, 2.24] |
| 5 Development Show forest plot | 1 | Mean Difference (IV, Fixed, 95% CI) | Subtotals only | |
| 5.1 Bayley Scales of Infant Development II: Mental Development Index | 1 | 184 | Mean Difference (IV, Fixed, 95% CI) | 0.90 [‐3.24, 5.04] |
| 5.2 Bayley Scales of Infant Development II: Psychomotor Development Index | 1 | 184 | Mean Difference (IV, Fixed, 95% CI) | 2.70 [‐1.28, 6.68] |
| 6 Bone mineralisation Show forest plot | 3 | Mean Difference (IV, Fixed, 95% CI) | Subtotals only | |
| 6.1 Bone area at 2 months post term (cm2) | 1 | 33 | Mean Difference (IV, Fixed, 95% CI) | 7.0 [‐15.46, 29.46] |
| 6.2 Bone mineral content at 2 months post term (grams) | 1 | 33 | Mean Difference (IV, Fixed, 95% CI) | 3.20 [‐4.73, 11.13] |
| 6.3 Bone 'speed of sound' assessed on ultrasonography at 6 months post term (mm/s) | 1 | 20 | Mean Difference (IV, Fixed, 95% CI) | 45.0 [‐18.48, 108.48] |
| 6.4 Bone specific serum alkaline phosphatase at 6 months post term (units/L) | 1 | 20 | Mean Difference (IV, Fixed, 95% CI) | ‐9.0 [‐42.01, 24.01] |
| 6.5 Bone width at 9 months post term (cm) | 1 | 31 | Mean Difference (IV, Fixed, 95% CI) | 0.05 [‐0.01, 0.11] |
| 6.6 Bone mineral content at 9 months post term (mg/cm) | 1 | 31 | Mean Difference (IV, Fixed, 95% CI) | 20.60 [7.78, 33.42] |
| Outcome or subgroup title | No. of studies | No. of participants | Statistical method | Effect size |
| 1 Growth rates during trial period Show forest plot | 1 | Mean Difference (IV, Fixed, 95% CI) | Subtotals only | |
| 1.1 Weight gain (g/d) | 1 | 42 | Mean Difference (IV, Fixed, 95% CI) | 3.70 [‐0.16, 7.56] |
| 1.2 Linear growth (mm/wk) | 1 | 42 | Mean Difference (IV, Fixed, 95% CI) | 1.0 [0.09, 1.91] |
| 1.3 Head circumference (mm/wk) | 1 | 42 | Mean Difference (IV, Fixed, 95% CI) | 0.5 [‐0.04, 1.04] |
| 2 Weight (grams) Show forest plot | 5 | Mean Difference (IV, Fixed, 95% CI) | Subtotals only | |
| 2.1 3‐4 months post term | 3 | 130 | Mean Difference (IV, Fixed, 95% CI) | 74.41 [‐267.10, 415.93] |
| 2.2 6 months post term | 4 | 273 | Mean Difference (IV, Fixed, 95% CI) | 74.60 [‐164.73, 313.92] |
| 2.3 9 months post term | 1 | 59 | Mean Difference (IV, Fixed, 95% CI) | 112.0 [‐482.69, 706.69] |
| 2.4 12 months post term | 4 | 265 | Mean Difference (IV, Fixed, 95% CI) | 539.48 [255.03, 823.92] |
| 2.5 18 months post term | 2 | 162 | Mean Difference (IV, Fixed, 95% CI) | 490.81 [142.19, 839.44] |
| 3 Crown‐heel length (mm) Show forest plot | 5 | Mean Difference (IV, Fixed, 95% CI) | Subtotals only | |
| 3.1 3‐4 months post term | 3 | 130 | Mean Difference (IV, Fixed, 95% CI) | ‐2.27 [‐13.09, 8.56] |
| 3.2 6 months post term | 3 | 160 | Mean Difference (IV, Fixed, 95% CI) | 1.83 [‐6.25, 9.92] |
| 3.3 9 months post term | 1 | 59 | Mean Difference (IV, Fixed, 95% CI) | ‐3.0 [‐17.03, 11.03] |
| 3.4 12 months post term | 3 | 152 | Mean Difference (IV, Fixed, 95% CI) | 5.13 [‐4.23, 14.49] |
| 3.5 18 months post term | 2 | 162 | Mean Difference (IV, Fixed, 95% CI) | 11.00 [1.89, 20.11] |
| 4 Head circumference (mm) Show forest plot | 5 | Mean Difference (IV, Fixed, 95% CI) | Subtotals only | |
| 4.1 3‐4 months post term | 3 | 130 | Mean Difference (IV, Fixed, 95% CI) | 3.61 [‐2.09, 9.31] |
| 4.2 6 months post term | 3 | 160 | Mean Difference (IV, Fixed, 95% CI) | 5.82 [1.32, 10.32] |
| 4.3 9 months post term | 1 | 59 | Mean Difference (IV, Fixed, 95% CI) | 8.0 [0.85, 15.15] |
| 4.4 12 months post term | 3 | 152 | Mean Difference (IV, Fixed, 95% CI) | 6.07 [1.07, 11.06] |
| 4.5 18 months post term | 2 | 162 | Mean Difference (IV, Fixed, 95% CI) | 5.42 [0.69, 10.14] |
| 5 Development Show forest plot | 2 | Mean Difference (IV, Fixed, 95% CI) | Subtotals only | |
| 5.1 Bayley Scales of Infant Development II: Mental Development Index | 2 | 143 | Mean Difference (IV, Fixed, 95% CI) | ‐1.44 [‐6.22, 3.35] |
| 5.2 Bayley Scales of Infant Development II: Psychomotor Development Index | 2 | 143 | Mean Difference (IV, Fixed, 95% CI) | ‐1.13 [‐4.19, 1.93] |