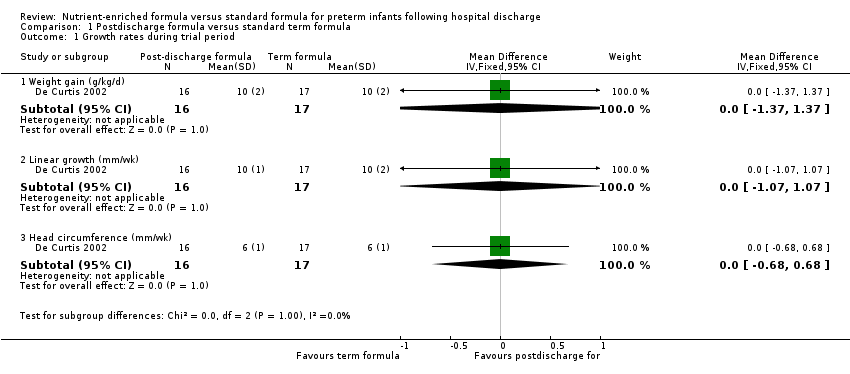
| 1 Growth rates during trial period Show forest plot | 1 | | Mean Difference (IV, Fixed, 95% CI) | Subtotals only |
|
| 1.1 Weight gain (g/kg/d) | 1 | 33 | Mean Difference (IV, Fixed, 95% CI) | 0.0 [‐1.37, 1.37] |
| 1.2 Linear growth (mm/wk) | 1 | 33 | Mean Difference (IV, Fixed, 95% CI) | 0.0 [‐1.07, 1.07] |
| 1.3 Head circumference (mm/wk) | 1 | 33 | Mean Difference (IV, Fixed, 95% CI) | 0.0 [‐0.68, 0.68] |
| 2 Weight (grams) Show forest plot | 7 | | Mean Difference (IV, Fixed, 95% CI) | Subtotals only |
|
| 2.1 3‐4 months post term | 6 | 523 | Mean Difference (IV, Fixed, 95% CI) | ‐7.45 [‐141.84, 126.93] |
| 2.2 6 months post term | 7 | 576 | Mean Difference (IV, Fixed, 95% CI) | 35.54 [‐113.71, 184.78] |
| 2.3 9 months post term | 4 | 347 | Mean Difference (IV, Fixed, 95% CI) | 244.09 [16.95, 471.23] |
| 2.4 12 months post term | 4 | 314 | Mean Difference (IV, Fixed, 95% CI) | ‐14.87 [‐243.18, 213.43] |
| 2.5 18‐24 months post term | 1 | 192 | Mean Difference (IV, Fixed, 95% CI) | 100.0 [‐246.90, 446.90] |
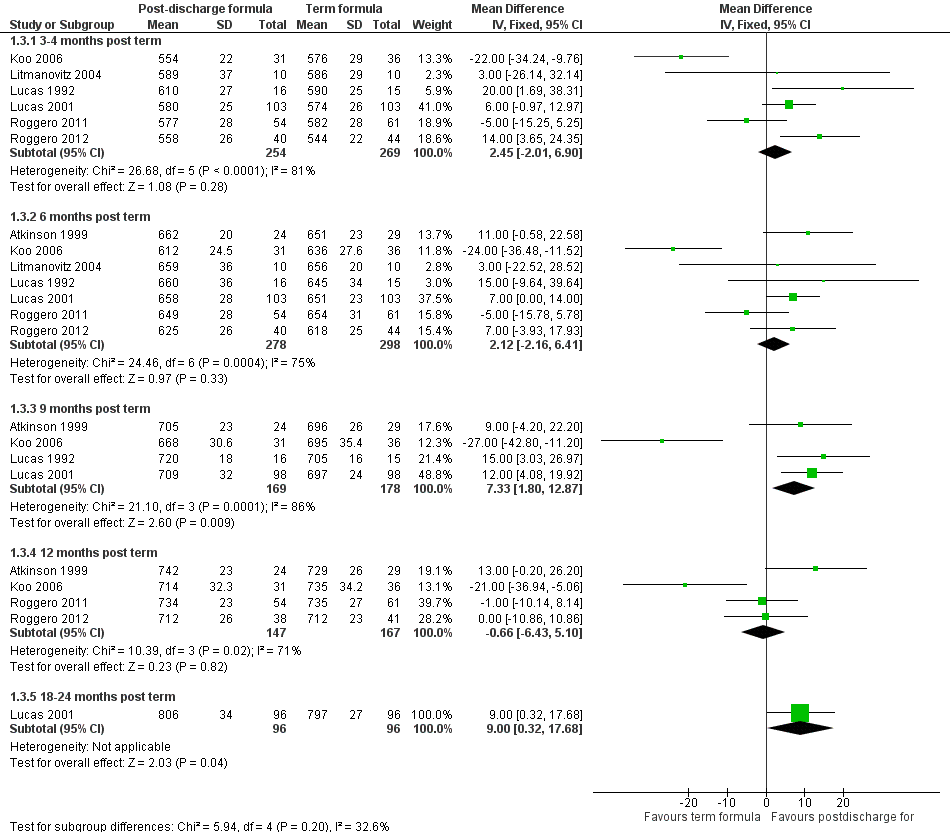
| 3 Crown‐heel length (mm) Show forest plot | 7 | | Mean Difference (IV, Fixed, 95% CI) | Subtotals only |
|
| 3.1 3‐4 months post term | 6 | 523 | Mean Difference (IV, Fixed, 95% CI) | 2.45 [‐2.01, 6.90] |
| 3.2 6 months post term | 7 | 576 | Mean Difference (IV, Fixed, 95% CI) | 2.12 [‐2.16, 6.41] |
| 3.3 9 months post term | 4 | 347 | Mean Difference (IV, Fixed, 95% CI) | 7.33 [1.80, 12.87] |
| 3.4 12 months post term | 4 | 314 | Mean Difference (IV, Fixed, 95% CI) | ‐0.66 [‐6.43, 5.10] |
| 3.5 18‐24 months post term | 1 | 192 | Mean Difference (IV, Fixed, 95% CI) | 9.0 [0.32, 17.68] |
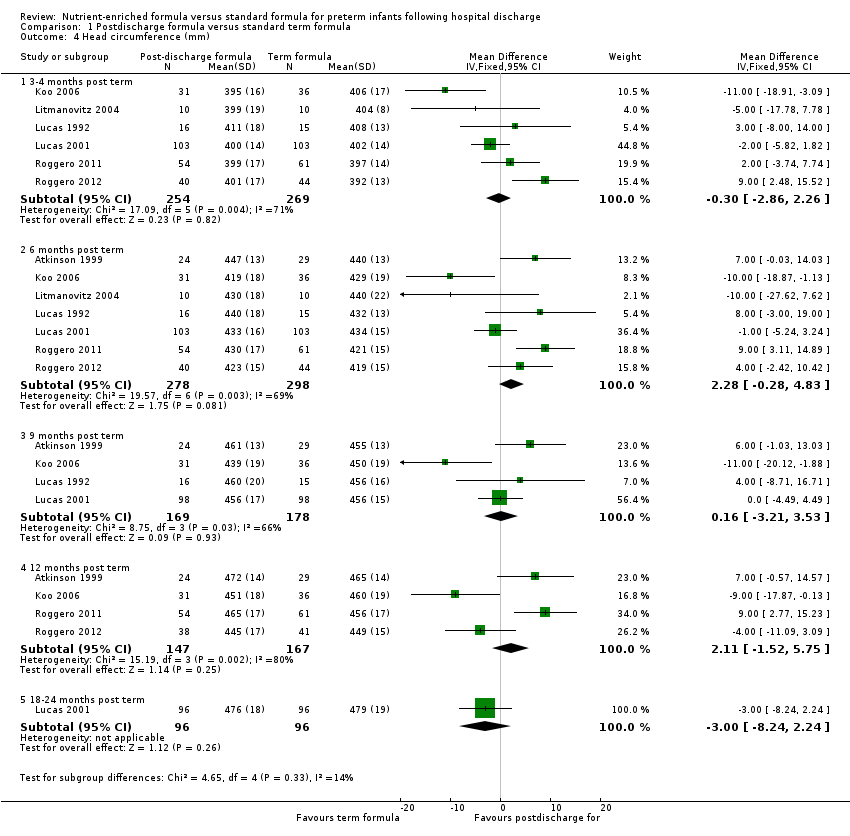
| 4 Head circumference (mm) Show forest plot | 7 | | Mean Difference (IV, Fixed, 95% CI) | Subtotals only |
|
| 4.1 3‐4 months post term | 6 | 523 | Mean Difference (IV, Fixed, 95% CI) | ‐0.30 [‐2.86, 2.26] |
| 4.2 6 months post term | 7 | 576 | Mean Difference (IV, Fixed, 95% CI) | 2.28 [‐0.28, 4.83] |
| 4.3 9 months post term | 4 | 347 | Mean Difference (IV, Fixed, 95% CI) | 0.16 [‐3.21, 3.53] |
| 4.4 12 months post term | 4 | 314 | Mean Difference (IV, Fixed, 95% CI) | 2.11 [‐1.52, 5.75] |
| 4.5 18‐24 months post term | 1 | 192 | Mean Difference (IV, Fixed, 95% CI) | ‐3.0 [‐8.24, 2.24] |
| 5 Development Show forest plot | 1 | | Mean Difference (IV, Fixed, 95% CI) | Subtotals only |
|
| 5.1 Bayley Scales of Infant Development II: Mental Development Index | 1 | 184 | Mean Difference (IV, Fixed, 95% CI) | 0.90 [‐3.24, 5.04] |
| 5.2 Bayley Scales of Infant Development II: Psychomotor Development Index | 1 | 184 | Mean Difference (IV, Fixed, 95% CI) | 2.70 [‐1.28, 6.68] |
| 6 Bone mineralisation Show forest plot | 3 | | Mean Difference (IV, Fixed, 95% CI) | Subtotals only |
|
| 6.1 Bone area at 2 months post term (cm2) | 1 | 33 | Mean Difference (IV, Fixed, 95% CI) | 7.0 [‐15.46, 29.46] |
| 6.2 Bone mineral content at 2 months post term (grams) | 1 | 33 | Mean Difference (IV, Fixed, 95% CI) | 3.20 [‐4.73, 11.13] |
| 6.3 Bone 'speed of sound' assessed on ultrasonography at 6 months post term (mm/s) | 1 | 20 | Mean Difference (IV, Fixed, 95% CI) | 45.0 [‐18.48, 108.48] |
| 6.4 Bone specific serum alkaline phosphatase at 6 months post term (units/L) | 1 | 20 | Mean Difference (IV, Fixed, 95% CI) | ‐9.0 [‐42.01, 24.01] |
| 6.5 Bone width at 9 months post term (cm) | 1 | 31 | Mean Difference (IV, Fixed, 95% CI) | 0.05 [‐0.01, 0.11] |
| 6.6 Bone mineral content at 9 months post term (mg/cm) | 1 | 31 | Mean Difference (IV, Fixed, 95% CI) | 20.60 [7.78, 33.42] |