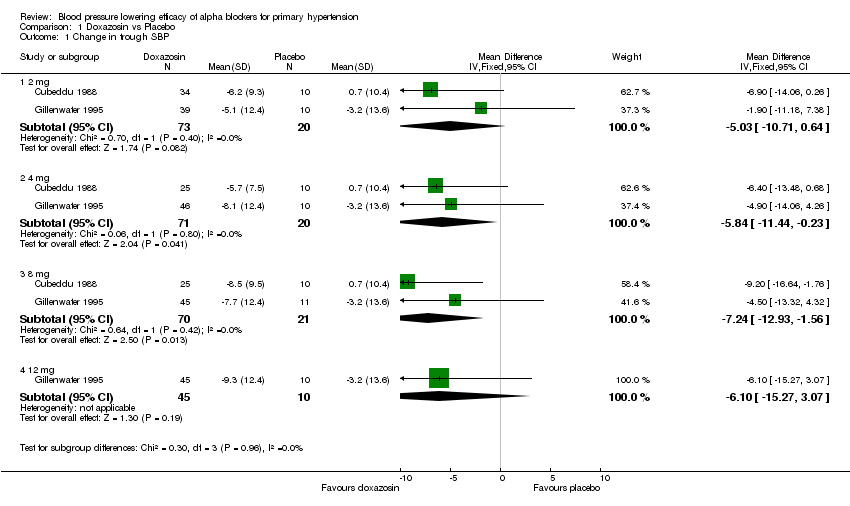
| 1 Change in trough SBP Show forest plot | 2 | | Mean Difference (IV, Fixed, 95% CI) | Subtotals only |
|
| 1.1 2 mg | 2 | 93 | Mean Difference (IV, Fixed, 95% CI) | ‐5.03 [‐10.71, 0.64] |
| 1.2 4 mg | 2 | 91 | Mean Difference (IV, Fixed, 95% CI) | ‐5.84 [‐11.44, ‐0.23] |
| 1.3 8 mg | 2 | 91 | Mean Difference (IV, Fixed, 95% CI) | ‐7.24 [‐12.93, ‐1.56] |
| 1.4 12 mg | 1 | 55 | Mean Difference (IV, Fixed, 95% CI) | ‐6.1 [‐15.27, 3.07] |
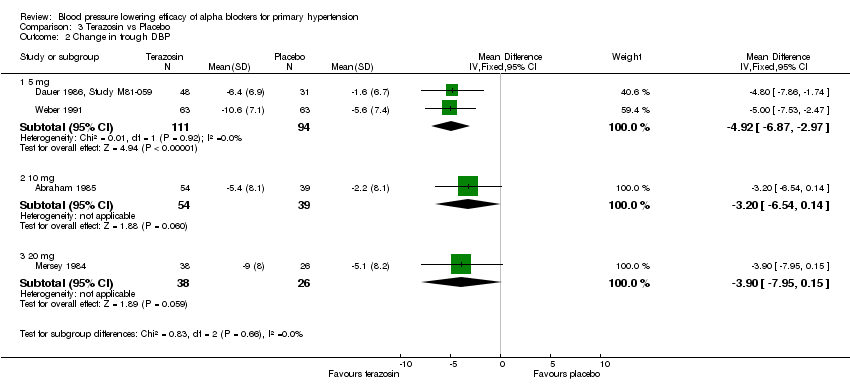
| 2 Change in trough DBP Show forest plot | 3 | | Mean Difference (IV, Fixed, 95% CI) | Subtotals only |
|
| 2.1 2 mg | 2 | 93 | Mean Difference (IV, Fixed, 95% CI) | ‐3.01 [‐6.43, 0.42] |
| 2.2 4 mg | 3 | 326 | Mean Difference (IV, Fixed, 95% CI) | ‐3.36 [‐5.06, ‐1.66] |
| 2.3 8 mg | 2 | 90 | Mean Difference (IV, Fixed, 95% CI) | ‐4.13 [‐7.61, ‐0.65] |
| 2.4 12 mg | 1 | 56 | Mean Difference (IV, Fixed, 95% CI) | ‐3.8 [‐8.64, 1.04] |
| 3 Change in peak SBP Show forest plot | 1 | | Mean Difference (IV, Fixed, 95% CI) | Subtotals only |
|
| 3.1 2 mg | 1 | 44 | Mean Difference (IV, Fixed, 95% CI) | ‐6.8 [‐13.96, 0.36] |
| 3.2 4 mg | 1 | 35 | Mean Difference (IV, Fixed, 95% CI) | ‐6.0 [‐13.08, 1.08] |
| 3.3 8 mg | 1 | 35 | Mean Difference (IV, Fixed, 95% CI) | ‐12.90 [‐20.34, ‐5.46] |
| 4 Change in peak DBP Show forest plot | 1 | | Mean Difference (IV, Fixed, 95% CI) | Subtotals only |
|
| 4.1 2 mg | 1 | 44 | Mean Difference (IV, Fixed, 95% CI) | ‐4.30 [‐8.92, 0.32] |
| 4.2 4 mg | 1 | 35 | Mean Difference (IV, Fixed, 95% CI) | ‐4.4 [‐9.02, 0.22] |
| 4.3 8 mg | 1 | 35 | Mean Difference (IV, Fixed, 95% CI) | ‐8.5 [‐13.32, ‐3.68] |
| 5 Change in trough heart rate Show forest plot | 1 | | Mean Difference (IV, Fixed, 95% CI) | Subtotals only |
|
| 5.1 2 mg | 1 | 44 | Mean Difference (IV, Fixed, 95% CI) | ‐1.90 [‐6.62, 2.82] |
| 5.2 4 mg | 1 | 35 | Mean Difference (IV, Fixed, 95% CI) | ‐1.5 [‐6.22, 3.22] |
| 5.3 8 mg | 1 | 35 | Mean Difference (IV, Fixed, 95% CI) | 1.0 [‐4.67, 6.67] |
| 6 Change in peak heart rate Show forest plot | 1 | | Mean Difference (IV, Fixed, 95% CI) | Subtotals only |
|
| 6.1 2 mg | 1 | 44 | Mean Difference (IV, Fixed, 95% CI) | ‐0.10 [‐4.82, 4.62] |
| 6.2 4 mg | 1 | 35 | Mean Difference (IV, Fixed, 95% CI) | 1.30 [‐3.42, 6.02] |
| 6.3 8 mg | 1 | 35 | Mean Difference (IV, Fixed, 95% CI) | 3.2 [‐2.47, 8.87] |
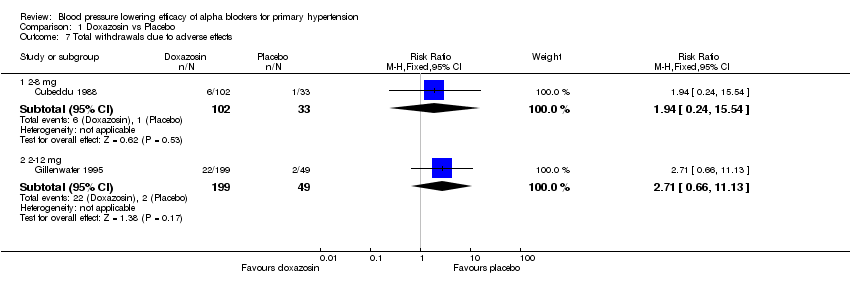
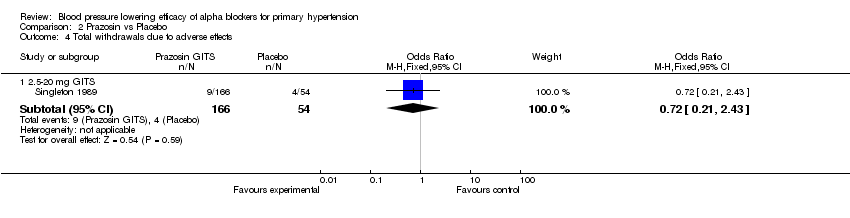
| 7 Total withdrawals due to adverse effects Show forest plot | 2 | | Risk Ratio (M‐H, Fixed, 95% CI) | Subtotals only |
|
| 7.1 2‐8 mg | 1 | 135 | Risk Ratio (M‐H, Fixed, 95% CI) | 1.94 [0.24, 15.54] |
| 7.2 2‐12 mg | 1 | 248 | Risk Ratio (M‐H, Fixed, 95% CI) | 2.71 [0.66, 11.13] |