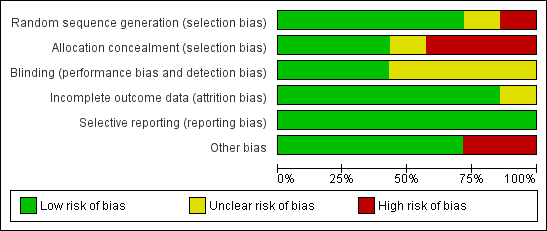
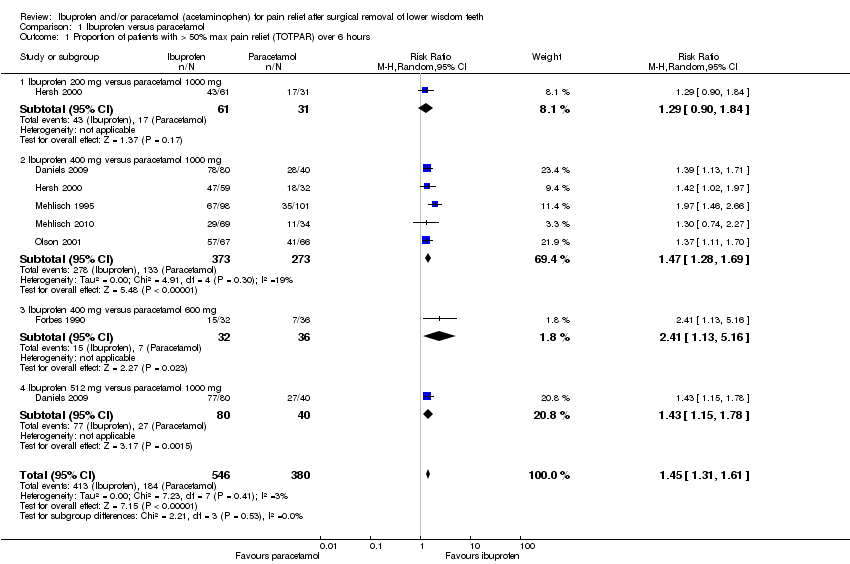
| 1 Proportion of patients with > 50% max pain relief (TOTPAR) over 6 hours Show forest plot | 6 | 926 | Risk Ratio (M‐H, Random, 95% CI) | 1.45 [1.31, 1.61] |
|
| 1.1 Ibuprofen 200 mg versus paracetamol 1000 mg | 1 | 92 | Risk Ratio (M‐H, Random, 95% CI) | 1.29 [0.90, 1.84] |
| 1.2 Ibuprofen 400 mg versus paracetamol 1000 mg | 5 | 646 | Risk Ratio (M‐H, Random, 95% CI) | 1.47 [1.28, 1.69] |
| 1.3 Ibuprofen 400 mg versus paracetamol 600 mg | 1 | 68 | Risk Ratio (M‐H, Random, 95% CI) | 2.41 [1.13, 5.16] |
| 1.4 Ibuprofen 512 mg versus paracetamol 1000 mg | 1 | 120 | Risk Ratio (M‐H, Random, 95% CI) | 1.43 [1.15, 1.78] |
| 2 Proportion of patients with > 50% max pain relief (TOTPAR) over 2 hours Show forest plot | 6 | 926 | Risk Ratio (M‐H, Random, 95% CI) | 1.29 [1.13, 1.46] |
|
| 2.1 Ibuprofen 512 mg versus paracetamol 1000 mg | 1 | 120 | Risk Ratio (M‐H, Random, 95% CI) | 1.28 [0.98, 1.67] |
| 2.2 Ibuprofen 400 mg versus paracetamol 1000 mg | 5 | 645 | Risk Ratio (M‐H, Random, 95% CI) | 1.30 [1.09, 1.55] |
| 2.3 Ibuprofen 200 mg versus paracetamol 1000 mg | 1 | 93 | Risk Ratio (M‐H, Random, 95% CI) | 1.09 [0.85, 1.41] |
| 2.4 Ibuprofen 400 mg versus paracetamol 600 mg | 1 | 68 | Risk Ratio (M‐H, Random, 95% CI) | 1.74 [0.96, 3.14] |
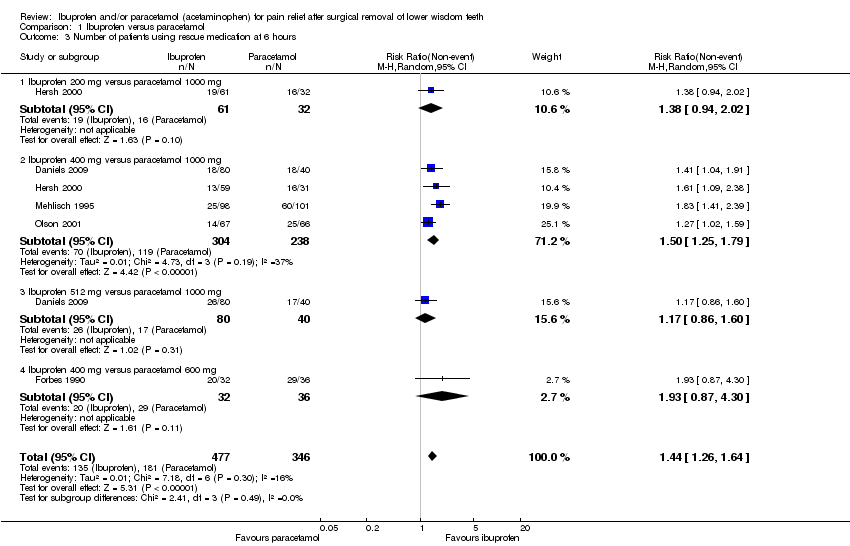
| 3 Number of patients using rescue medication at 6 hours Show forest plot | 5 | 823 | Risk Ratio (M‐H, Random, 95% CI) | 1.44 [1.26, 1.64] |
|
| 3.1 Ibuprofen 200 mg versus paracetamol 1000 mg | 1 | 93 | Risk Ratio (M‐H, Random, 95% CI) | 1.38 [0.94, 2.02] |
| 3.2 Ibuprofen 400 mg versus paracetamol 1000 mg | 4 | 542 | Risk Ratio (M‐H, Random, 95% CI) | 1.50 [1.25, 1.79] |
| 3.3 Ibuprofen 512 mg versus paracetamol 1000 mg | 1 | 120 | Risk Ratio (M‐H, Random, 95% CI) | 1.17 [0.86, 1.60] |
| 3.4 Ibuprofen 400 mg versus paracetamol 600 mg | 1 | 68 | Risk Ratio (M‐H, Random, 95% CI) | 1.93 [0.87, 4.30] |
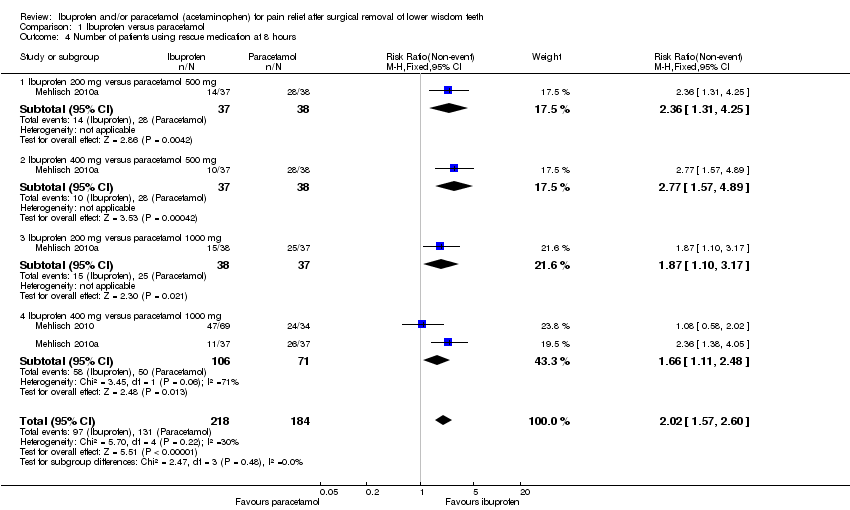
| 4 Number of patients using rescue medication at 8 hours Show forest plot | 2 | 402 | Risk Ratio (M‐H, Fixed, 95% CI) | 2.02 [1.57, 2.60] |
|
| 4.1 Ibuprofen 200 mg versus paracetamol 500 mg | 1 | 75 | Risk Ratio (M‐H, Fixed, 95% CI) | 2.36 [1.31, 4.25] |
| 4.2 Ibuprofen 400 mg versus paracetamol 500 mg | 1 | 75 | Risk Ratio (M‐H, Fixed, 95% CI) | 2.77 [1.57, 4.89] |
| 4.3 Ibuprofen 200 mg versus paracetamol 1000 mg | 1 | 75 | Risk Ratio (M‐H, Fixed, 95% CI) | 1.87 [1.10, 3.17] |
| 4.4 Ibuprofen 400 mg versus paracetamol 1000 mg | 2 | 177 | Risk Ratio (M‐H, Fixed, 95% CI) | 1.66 [1.11, 2.48] |