| 1 Treatment failure Show forest plot | 4 | | Risk Ratio (M‐H, Random, 95% CI) | Subtotals only |
|
| 1.1 Day 28 | 4 | 824 | Risk Ratio (M‐H, Random, 95% CI) | 0.17 [0.06, 0.47] |
| 1.2 Day 42 | 1 | 298 | Risk Ratio (M‐H, Random, 95% CI) | 0.23 [0.14, 0.39] |
| 1.3 Day 63 | 2 | 501 | Risk Ratio (M‐H, Random, 95% CI) | 0.26 [0.09, 0.77] |
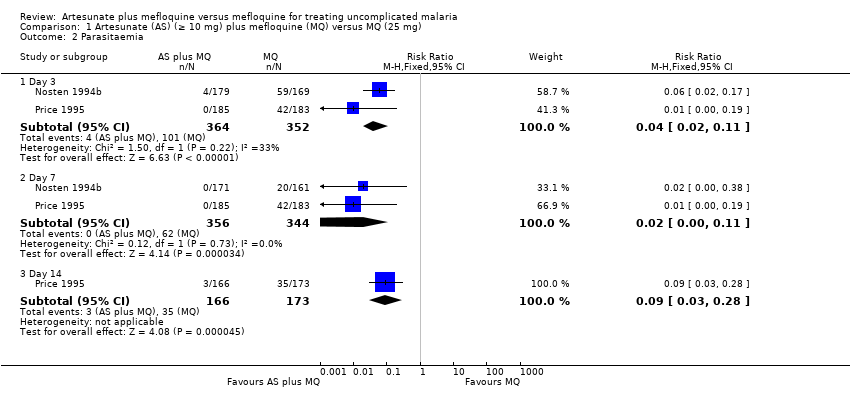
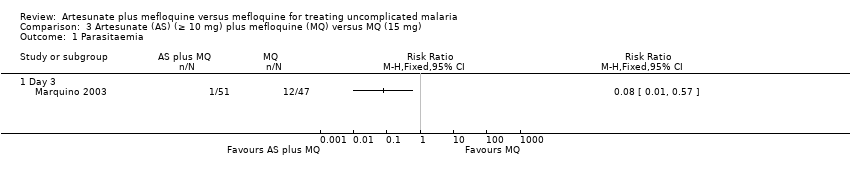
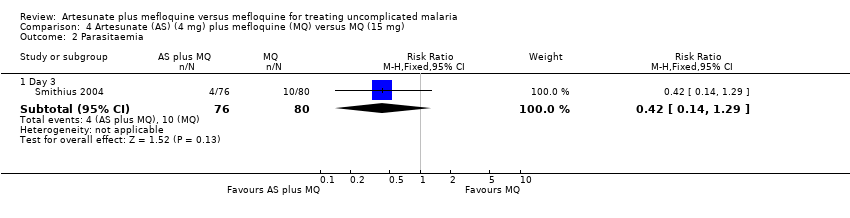
| 2 Parasitaemia Show forest plot | 2 | | Risk Ratio (M‐H, Fixed, 95% CI) | Subtotals only |
|
| 2.1 Day 3 | 2 | 716 | Risk Ratio (M‐H, Fixed, 95% CI) | 0.04 [0.02, 0.11] |
| 2.2 Day 7 | 2 | 700 | Risk Ratio (M‐H, Fixed, 95% CI) | 0.02 [0.00, 0.11] |
| 2.3 Day 14 | 1 | 339 | Risk Ratio (M‐H, Fixed, 95% CI) | 0.09 [0.03, 0.28] |
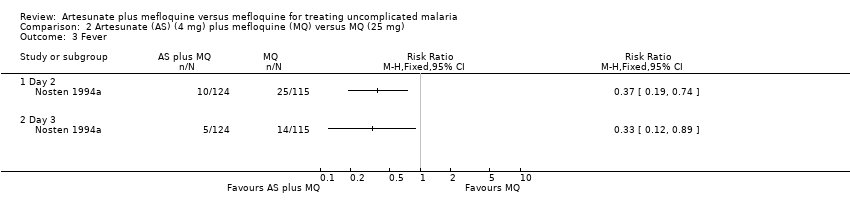
| 3 Fever Show forest plot | 1 | | Risk Ratio (M‐H, Fixed, 95% CI) | Totals not selected |
|
| 3.1 Day 2 | 1 | | Risk Ratio (M‐H, Fixed, 95% CI) | 0.0 [0.0, 0.0] |
| 3.2 Day 3 | 1 | | Risk Ratio (M‐H, Fixed, 95% CI) | 0.0 [0.0, 0.0] |
| 4 Mean fever clearance time (h) Show forest plot | 1 | | Mean Difference (IV, Fixed, 95% CI) | Totals not selected |
|
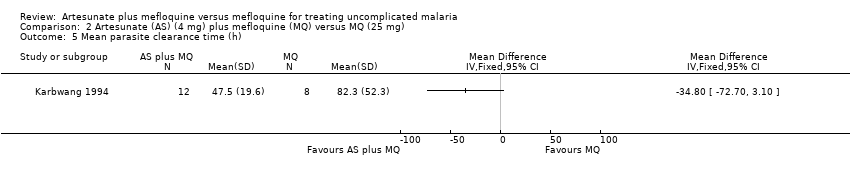
| 5 Mean parasite clearance time (h) Show forest plot | 1 | | Mean Difference (IV, Fixed, 95% CI) | Totals not selected |
|
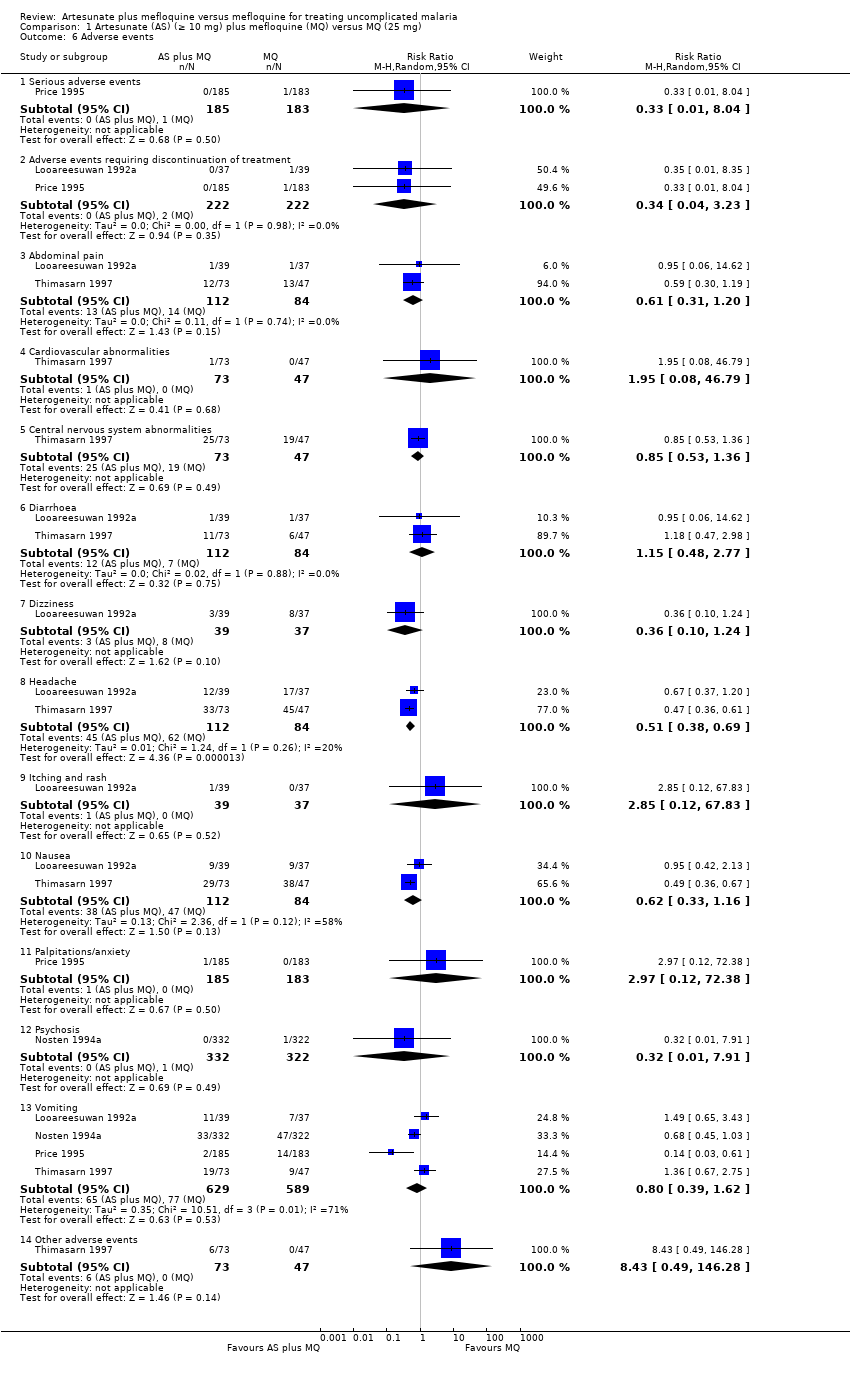
| 6 Adverse events Show forest plot | 4 | | Risk Ratio (M‐H, Random, 95% CI) | Subtotals only |
|
| 6.1 Serious adverse events | 1 | 368 | Risk Ratio (M‐H, Random, 95% CI) | 0.33 [0.01, 8.04] |
| 6.2 Adverse events requiring discontinuation of treatment | 2 | 444 | Risk Ratio (M‐H, Random, 95% CI) | 0.34 [0.04, 3.23] |
| 6.3 Abdominal pain | 2 | 196 | Risk Ratio (M‐H, Random, 95% CI) | 0.61 [0.31, 1.20] |
| 6.4 Cardiovascular abnormalities | 1 | 120 | Risk Ratio (M‐H, Random, 95% CI) | 1.95 [0.08, 46.79] |
| 6.5 Central nervous system abnormalities | 1 | 120 | Risk Ratio (M‐H, Random, 95% CI) | 0.85 [0.53, 1.36] |
| 6.6 Diarrhoea | 2 | 196 | Risk Ratio (M‐H, Random, 95% CI) | 1.15 [0.48, 2.77] |
| 6.7 Dizziness | 1 | 76 | Risk Ratio (M‐H, Random, 95% CI) | 0.36 [0.10, 1.24] |
| 6.8 Headache | 2 | 196 | Risk Ratio (M‐H, Random, 95% CI) | 0.51 [0.38, 0.69] |
| 6.9 Itching and rash | 1 | 76 | Risk Ratio (M‐H, Random, 95% CI) | 2.85 [0.12, 67.83] |
| 6.10 Nausea | 2 | 196 | Risk Ratio (M‐H, Random, 95% CI) | 0.62 [0.33, 1.16] |
| 6.11 Palpitations/anxiety | 1 | 368 | Risk Ratio (M‐H, Random, 95% CI) | 2.97 [0.12, 72.38] |
| 6.12 Psychosis | 1 | 654 | Risk Ratio (M‐H, Random, 95% CI) | 0.32 [0.01, 7.91] |
| 6.13 Vomiting | 4 | 1218 | Risk Ratio (M‐H, Random, 95% CI) | 0.80 [0.39, 1.62] |
| 6.14 Other adverse events | 1 | 120 | Risk Ratio (M‐H, Random, 95% CI) | 8.43 [0.49, 146.28] |