Scolaris Content Display Scolaris Content Display

Comparison 1 Atovaquone‐proguanil (AP) versus chloroquine, Outcome 1 Treatment failure on or by day 28.
Figuras y tablas -
Analysis 1.1

Comparison 1 Atovaquone‐proguanil (AP) versus chloroquine, Outcome 1 Treatment failure on or by day 28.

Comparison 1 Atovaquone‐proguanil (AP) versus chloroquine, Outcome 2 Parasite clearance time (mean; h).
Figuras y tablas -
Analysis 1.2

Comparison 1 Atovaquone‐proguanil (AP) versus chloroquine, Outcome 2 Parasite clearance time (mean; h).

Comparison 1 Atovaquone‐proguanil (AP) versus chloroquine, Outcome 3 Fever clearance time (mean; h).
Figuras y tablas -
Analysis 1.3

Comparison 1 Atovaquone‐proguanil (AP) versus chloroquine, Outcome 3 Fever clearance time (mean; h).

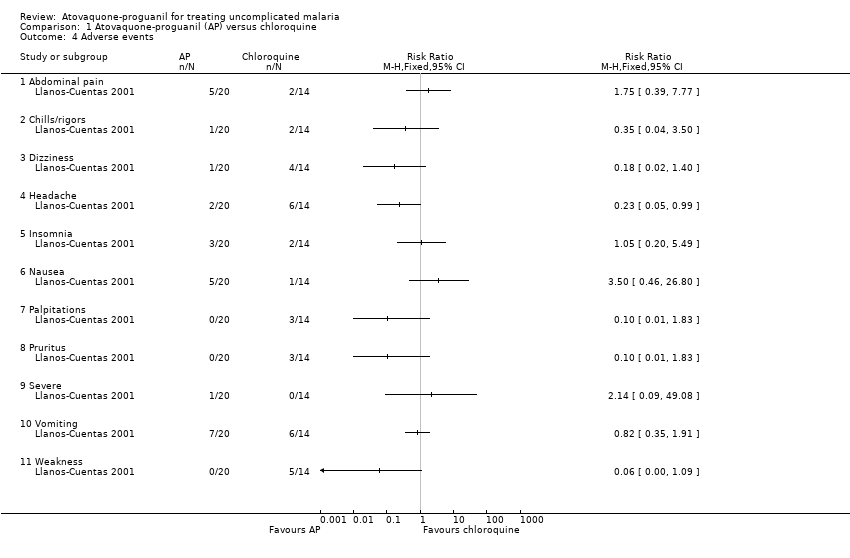
Comparison 1 Atovaquone‐proguanil (AP) versus chloroquine, Outcome 4 Adverse events.
Figuras y tablas -
Analysis 1.4

Comparison 1 Atovaquone‐proguanil (AP) versus chloroquine, Outcome 4 Adverse events.

Comparison 2 Atovaquone‐proguanil (AP) versus amodiaquine, Outcome 1 Treatment failure on or by day 28.
Figuras y tablas -
Analysis 2.1

Comparison 2 Atovaquone‐proguanil (AP) versus amodiaquine, Outcome 1 Treatment failure on or by day 28.

Comparison 2 Atovaquone‐proguanil (AP) versus amodiaquine, Outcome 2 Treatment failure on or by day 14.
Figuras y tablas -
Analysis 2.2

Comparison 2 Atovaquone‐proguanil (AP) versus amodiaquine, Outcome 2 Treatment failure on or by day 14.

Comparison 2 Atovaquone‐proguanil (AP) versus amodiaquine, Outcome 3 Parasite clearance time (mean; h).
Figuras y tablas -
Analysis 2.3

Comparison 2 Atovaquone‐proguanil (AP) versus amodiaquine, Outcome 3 Parasite clearance time (mean; h).

Comparison 2 Atovaquone‐proguanil (AP) versus amodiaquine, Outcome 4 Fever clearance time (mean; h).
Figuras y tablas -
Analysis 2.4

Comparison 2 Atovaquone‐proguanil (AP) versus amodiaquine, Outcome 4 Fever clearance time (mean; h).

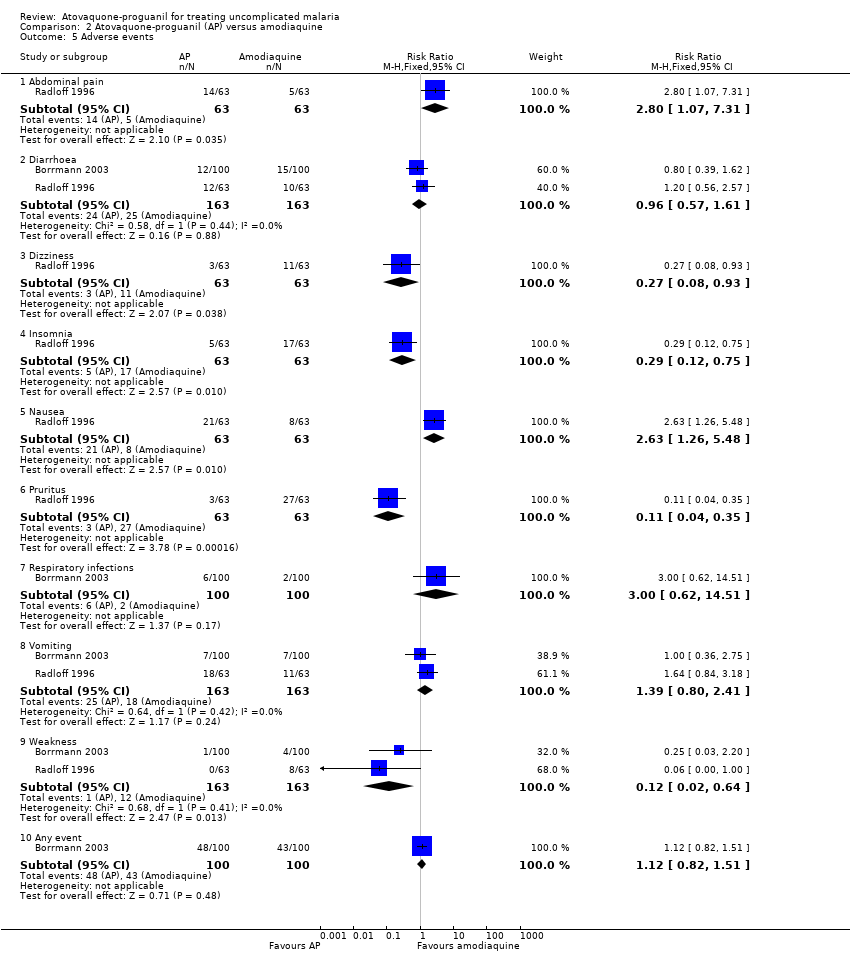
Comparison 2 Atovaquone‐proguanil (AP) versus amodiaquine, Outcome 5 Adverse events.
Figuras y tablas -
Analysis 2.5

Comparison 2 Atovaquone‐proguanil (AP) versus amodiaquine, Outcome 5 Adverse events.

Comparison 3 Atovaquone‐proguanil (AP) versus sulfadoxine‐pyrimethamine (SP), Outcome 1 Treatment failure on or by day 28.
Figuras y tablas -
Analysis 3.1

Comparison 3 Atovaquone‐proguanil (AP) versus sulfadoxine‐pyrimethamine (SP), Outcome 1 Treatment failure on or by day 28.

Comparison 3 Atovaquone‐proguanil (AP) versus sulfadoxine‐pyrimethamine (SP), Outcome 2 Parasite clearance time (mean; h).
Figuras y tablas -
Analysis 3.2

Comparison 3 Atovaquone‐proguanil (AP) versus sulfadoxine‐pyrimethamine (SP), Outcome 2 Parasite clearance time (mean; h).

Comparison 3 Atovaquone‐proguanil (AP) versus sulfadoxine‐pyrimethamine (SP), Outcome 3 Fever clearance time (mean; h).
Figuras y tablas -
Analysis 3.3

Comparison 3 Atovaquone‐proguanil (AP) versus sulfadoxine‐pyrimethamine (SP), Outcome 3 Fever clearance time (mean; h).

Comparison 3 Atovaquone‐proguanil (AP) versus sulfadoxine‐pyrimethamine (SP), Outcome 4 Progression to severe disease.
Figuras y tablas -
Analysis 3.4

Comparison 3 Atovaquone‐proguanil (AP) versus sulfadoxine‐pyrimethamine (SP), Outcome 4 Progression to severe disease.

Comparison 3 Atovaquone‐proguanil (AP) versus sulfadoxine‐pyrimethamine (SP), Outcome 5 Adverse events.
Figuras y tablas -
Analysis 3.5

Comparison 3 Atovaquone‐proguanil (AP) versus sulfadoxine‐pyrimethamine (SP), Outcome 5 Adverse events.

Comparison 4 Atovaquone‐proguanil (AP) versus quinine plus tetracycline (Q plus T), Outcome 1 Treatment failure on or by day 28.
Figuras y tablas -
Analysis 4.1

Comparison 4 Atovaquone‐proguanil (AP) versus quinine plus tetracycline (Q plus T), Outcome 1 Treatment failure on or by day 28.

Comparison 4 Atovaquone‐proguanil (AP) versus quinine plus tetracycline (Q plus T), Outcome 2 Parasite clearance time (mean; h).
Figuras y tablas -
Analysis 4.2

Comparison 4 Atovaquone‐proguanil (AP) versus quinine plus tetracycline (Q plus T), Outcome 2 Parasite clearance time (mean; h).

Comparison 4 Atovaquone‐proguanil (AP) versus quinine plus tetracycline (Q plus T), Outcome 3 Fever clearance time (mean; h).
Figuras y tablas -
Analysis 4.3

Comparison 4 Atovaquone‐proguanil (AP) versus quinine plus tetracycline (Q plus T), Outcome 3 Fever clearance time (mean; h).

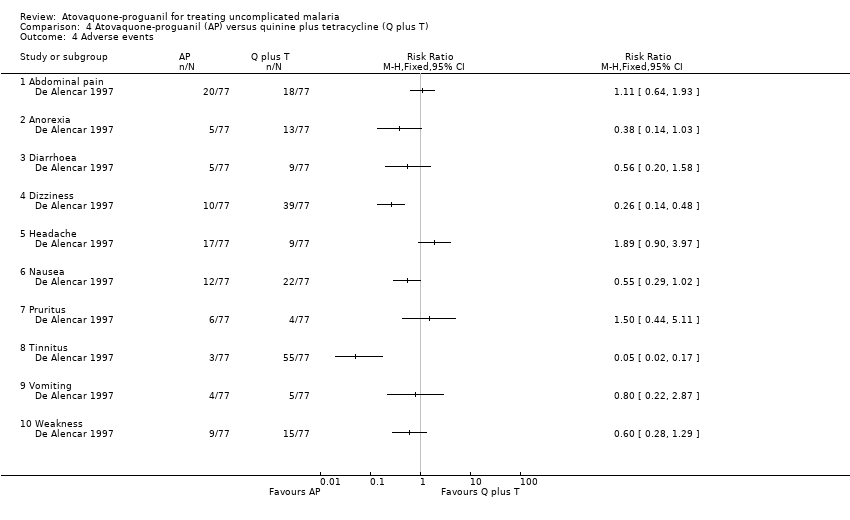
Comparison 4 Atovaquone‐proguanil (AP) versus quinine plus tetracycline (Q plus T), Outcome 4 Adverse events.
Figuras y tablas -
Analysis 4.4

Comparison 4 Atovaquone‐proguanil (AP) versus quinine plus tetracycline (Q plus T), Outcome 4 Adverse events.

Comparison 5 Atovaquone‐proguanil (AP) versus halofantrine, Outcome 1 Treatment failure on or by day 28.
Figuras y tablas -
Analysis 5.1

Comparison 5 Atovaquone‐proguanil (AP) versus halofantrine, Outcome 1 Treatment failure on or by day 28.

Comparison 5 Atovaquone‐proguanil (AP) versus halofantrine, Outcome 2 Parasite clearance time (mean; h).
Figuras y tablas -
Analysis 5.2

Comparison 5 Atovaquone‐proguanil (AP) versus halofantrine, Outcome 2 Parasite clearance time (mean; h).

Comparison 5 Atovaquone‐proguanil (AP) versus halofantrine, Outcome 3 Fever clearance time (mean; h).
Figuras y tablas -
Analysis 5.3

Comparison 5 Atovaquone‐proguanil (AP) versus halofantrine, Outcome 3 Fever clearance time (mean; h).

Comparison 5 Atovaquone‐proguanil (AP) versus halofantrine, Outcome 4 Adverse events.
Figuras y tablas -
Analysis 5.4

Comparison 5 Atovaquone‐proguanil (AP) versus halofantrine, Outcome 4 Adverse events.

Comparison 6 Atovaquone‐proguanil (AP) versus mefloquine, Outcome 1 Treatment failure on or by day 28.
Figuras y tablas -
Analysis 6.1

Comparison 6 Atovaquone‐proguanil (AP) versus mefloquine, Outcome 1 Treatment failure on or by day 28.

Comparison 6 Atovaquone‐proguanil (AP) versus mefloquine, Outcome 2 Parasite clearance time (mean; h).
Figuras y tablas -
Analysis 6.2

Comparison 6 Atovaquone‐proguanil (AP) versus mefloquine, Outcome 2 Parasite clearance time (mean; h).

Comparison 6 Atovaquone‐proguanil (AP) versus mefloquine, Outcome 3 Fever clearance time (mean; h).
Figuras y tablas -
Analysis 6.3

Comparison 6 Atovaquone‐proguanil (AP) versus mefloquine, Outcome 3 Fever clearance time (mean; h).

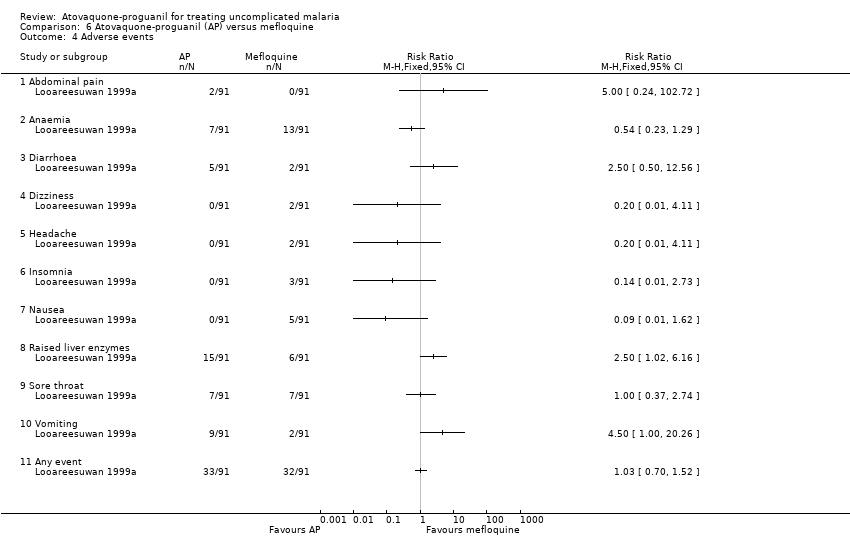
Comparison 6 Atovaquone‐proguanil (AP) versus mefloquine, Outcome 4 Adverse events.
Figuras y tablas -
Analysis 6.4

Comparison 6 Atovaquone‐proguanil (AP) versus mefloquine, Outcome 4 Adverse events.

Comparison 7 Atovaquone‐proguanil (AP) versus artesunate plus mefloquine (AS plus MQ), Outcome 1 Treatment failure on or by day 14.
Figuras y tablas -
Analysis 7.1

Comparison 7 Atovaquone‐proguanil (AP) versus artesunate plus mefloquine (AS plus MQ), Outcome 1 Treatment failure on or by day 14.

Comparison 7 Atovaquone‐proguanil (AP) versus artesunate plus mefloquine (AS plus MQ), Outcome 2 Treatment failure on or by day 28 adjusted by PCR.
Figuras y tablas -
Analysis 7.2

Comparison 7 Atovaquone‐proguanil (AP) versus artesunate plus mefloquine (AS plus MQ), Outcome 2 Treatment failure on or by day 28 adjusted by PCR.

Comparison 7 Atovaquone‐proguanil (AP) versus artesunate plus mefloquine (AS plus MQ), Outcome 3 Adverse events.
Figuras y tablas -
Analysis 7.3

Comparison 7 Atovaquone‐proguanil (AP) versus artesunate plus mefloquine (AS plus MQ), Outcome 3 Adverse events.

Comparison 8 Atovaquone‐proguanil (AP) versus dihydroartemisinin, piperaquine, trimethoprim, and primaquine (CV8), Outcome 1 Treatment failure on or by day 28.
Figuras y tablas -
Analysis 8.1

Comparison 8 Atovaquone‐proguanil (AP) versus dihydroartemisinin, piperaquine, trimethoprim, and primaquine (CV8), Outcome 1 Treatment failure on or by day 28.

Comparison 8 Atovaquone‐proguanil (AP) versus dihydroartemisinin, piperaquine, trimethoprim, and primaquine (CV8), Outcome 2 Parasite clearance time (mean; h).
Figuras y tablas -
Analysis 8.2

Comparison 8 Atovaquone‐proguanil (AP) versus dihydroartemisinin, piperaquine, trimethoprim, and primaquine (CV8), Outcome 2 Parasite clearance time (mean; h).

Comparison 8 Atovaquone‐proguanil (AP) versus dihydroartemisinin, piperaquine, trimethoprim, and primaquine (CV8), Outcome 3 Fever clearance time (mean; h).
Figuras y tablas -
Analysis 8.3

Comparison 8 Atovaquone‐proguanil (AP) versus dihydroartemisinin, piperaquine, trimethoprim, and primaquine (CV8), Outcome 3 Fever clearance time (mean; h).

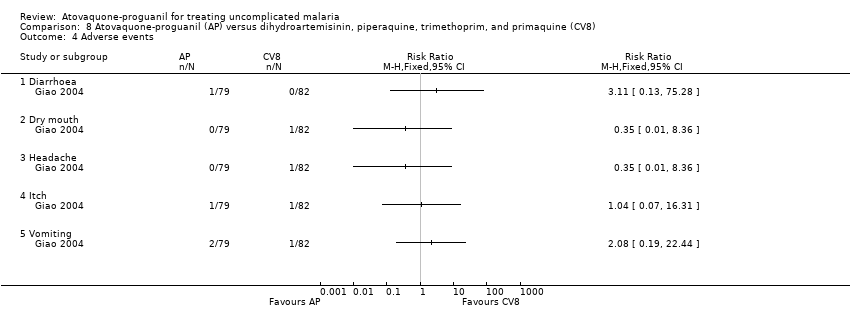
Comparison 8 Atovaquone‐proguanil (AP) versus dihydroartemisinin, piperaquine, trimethoprim, and primaquine (CV8), Outcome 4 Adverse events.
Figuras y tablas -
Analysis 8.4

Comparison 8 Atovaquone‐proguanil (AP) versus dihydroartemisinin, piperaquine, trimethoprim, and primaquine (CV8), Outcome 4 Adverse events.

Table 1. Risk of bias assessment

Trial

Allocation sequence generation

Allocation concealment

Blinding

Inclusiona

Anabwani 1999

Unclear

Unclear

None

Adequate

Borrmann 2003

Adequate

Adequate

None

Inadequate

Bouchaud 2000

Unclear

Unclear

None

Inadequate

De Alencar 1997

Unclear

Unclear

None

Inadequate

Giao 2004

Adequate

Adequate

None

Adequate

Llanos‐Cuentas 2001

Unclear

Unclear

None

Adequate

Looareesuwan 1999a

Unclear

Unclear

None

Inadequate

Mulenga 1999

Unclear

Unclear

None

Adequate

Radloff 1996

Adequate

Unclear

None

Inadequate

Van Vugt 2002

Adequate

Adequate

None

Adequate

aSee the 'Characteristics of included studies' for details.
bInclusion of all randomized participants in the final analysis.

Figuras y tablas -
Table 1. Risk of bias assessment
Comparison 1. Atovaquone‐proguanil (AP) versus chloroquine

Outcome or subgroup title

No. of studies

No. of participants

Statistical method

Effect size

1 Treatment failure on or by day 28 Show forest plot

1

Risk Ratio (M‐H, Fixed, 95% CI)

Totals not selected

2 Parasite clearance time (mean; h) Show forest plot

1

Mean Difference (IV, Fixed, 95% CI)

Totals not selected

3 Fever clearance time (mean; h) Show forest plot

1

Mean Difference (IV, Fixed, 95% CI)

Totals not selected

4 Adverse events Show forest plot

1

Risk Ratio (M‐H, Fixed, 95% CI)

Totals not selected

4.1 Abdominal pain

1

Risk Ratio (M‐H, Fixed, 95% CI)

0.0 [0.0, 0.0]

4.2 Chills/rigors

1

Risk Ratio (M‐H, Fixed, 95% CI)

0.0 [0.0, 0.0]

4.3 Dizziness

1

Risk Ratio (M‐H, Fixed, 95% CI)

0.0 [0.0, 0.0]

4.4 Headache

1

Risk Ratio (M‐H, Fixed, 95% CI)

0.0 [0.0, 0.0]

4.5 Insomnia

1

Risk Ratio (M‐H, Fixed, 95% CI)

0.0 [0.0, 0.0]

4.6 Nausea

1

Risk Ratio (M‐H, Fixed, 95% CI)

0.0 [0.0, 0.0]

4.7 Palpitations

1

Risk Ratio (M‐H, Fixed, 95% CI)

0.0 [0.0, 0.0]

4.8 Pruritus

1

Risk Ratio (M‐H, Fixed, 95% CI)

0.0 [0.0, 0.0]

4.9 Severe

1

Risk Ratio (M‐H, Fixed, 95% CI)

0.0 [0.0, 0.0]

4.10 Vomiting

1

Risk Ratio (M‐H, Fixed, 95% CI)

0.0 [0.0, 0.0]

4.11 Weakness

1

Risk Ratio (M‐H, Fixed, 95% CI)

0.0 [0.0, 0.0]

Figuras y tablas -
Comparison 1. Atovaquone‐proguanil (AP) versus chloroquine
Comparison 2. Atovaquone‐proguanil (AP) versus amodiaquine

Outcome or subgroup title

No. of studies

No. of participants

Statistical method

Effect size

1 Treatment failure on or by day 28 Show forest plot

2

342

Risk Ratio (M‐H, Fixed, 95% CI)

0.22 [0.13, 0.36]

2 Treatment failure on or by day 14 Show forest plot

1

Risk Ratio (M‐H, Fixed, 95% CI)

Totals not selected

3 Parasite clearance time (mean; h) Show forest plot

1

Mean Difference (IV, Fixed, 95% CI)

Totals not selected

4 Fever clearance time (mean; h) Show forest plot

1

Mean Difference (IV, Fixed, 95% CI)

Totals not selected

5 Adverse events Show forest plot

2

Risk Ratio (M‐H, Fixed, 95% CI)

Subtotals only

5.1 Abdominal pain

1

126

Risk Ratio (M‐H, Fixed, 95% CI)

2.8 [1.07, 7.31]

5.2 Diarrhoea

2

326

Risk Ratio (M‐H, Fixed, 95% CI)

0.96 [0.57, 1.61]

5.3 Dizziness

1

126

Risk Ratio (M‐H, Fixed, 95% CI)

0.27 [0.08, 0.93]

5.4 Insomnia

1

126

Risk Ratio (M‐H, Fixed, 95% CI)

0.29 [0.12, 0.75]

5.5 Nausea

1

126

Risk Ratio (M‐H, Fixed, 95% CI)

2.63 [1.26, 5.48]

5.6 Pruritus

1

126

Risk Ratio (M‐H, Fixed, 95% CI)

0.11 [0.04, 0.35]

5.7 Respiratory infections

1

200

Risk Ratio (M‐H, Fixed, 95% CI)

3.0 [0.62, 14.51]

5.8 Vomiting

2

326

Risk Ratio (M‐H, Fixed, 95% CI)

1.39 [0.80, 2.41]

5.9 Weakness

2

326

Risk Ratio (M‐H, Fixed, 95% CI)

0.12 [0.02, 0.64]

5.10 Any event

1

200

Risk Ratio (M‐H, Fixed, 95% CI)

1.12 [0.82, 1.51]

Figuras y tablas -
Comparison 2. Atovaquone‐proguanil (AP) versus amodiaquine
Comparison 3. Atovaquone‐proguanil (AP) versus sulfadoxine‐pyrimethamine (SP)

Outcome or subgroup title

No. of studies

No. of participants

Statistical method

Effect size

1 Treatment failure on or by day 28 Show forest plot

2

Risk Ratio (M‐H, Fixed, 95% CI)

Totals not selected

2 Parasite clearance time (mean; h) Show forest plot

2

174

Mean Difference (IV, Fixed, 95% CI)

11.23 [5.43, 17.03]

3 Fever clearance time (mean; h) Show forest plot

2

156

Mean Difference (IV, Fixed, 95% CI)

‐13.73 [‐21.31, ‐6.16]

4 Progression to severe disease Show forest plot

1

Risk Ratio (M‐H, Fixed, 95% CI)

Totals not selected

5 Adverse events Show forest plot

2

Risk Ratio (M‐H, Fixed, 95% CI)

Subtotals only

5.1 Abdominal pain

2

189

Risk Ratio (M‐H, Fixed, 95% CI)

0.85 [0.58, 1.24]

5.2 Chills/rigors

1

29

Risk Ratio (M‐H, Fixed, 95% CI)

1.43 [0.06, 32.05]

5.3 Diarrhoea

1

160

Risk Ratio (M‐H, Fixed, 95% CI)

43.0 [2.65, 697.91]

5.4 Dizziness

1

29

Risk Ratio (M‐H, Fixed, 95% CI)

1.43 [0.06, 32.05]

5.5 Headache

2

189

Risk Ratio (M‐H, Fixed, 95% CI)

1.17 [0.81, 1.67]

5.6 Insomnia

1

29

Risk Ratio (M‐H, Fixed, 95% CI)

0.34 [0.09, 1.21]

5.7 Nausea

1

29

Risk Ratio (M‐H, Fixed, 95% CI)

2.25 [0.31, 16.59]

5.8 Orthostatic hypotension

1

160

Risk Ratio (M‐H, Fixed, 95% CI)

0.03 [0.00, 0.57]

5.9 Pruritus

1

29

Risk Ratio (M‐H, Fixed, 95% CI)

0.16 [0.01, 3.56]

5.10 Raised liver enzymes

1

160

Risk Ratio (M‐H, Fixed, 95% CI)

0.67 [0.25, 1.79]

5.11 Severe

1

29

Risk Ratio (M‐H, Fixed, 95% CI)

1.43 [0.06, 32.05]

5.12 Vomiting

2

189

Risk Ratio (M‐H, Fixed, 95% CI)

0.97 [0.50, 1.90]

5.13 Weakness

2

189

Risk Ratio (M‐H, Fixed, 95% CI)

1.47 [0.82, 2.62]

Figuras y tablas -
Comparison 3. Atovaquone‐proguanil (AP) versus sulfadoxine‐pyrimethamine (SP)
Comparison 4. Atovaquone‐proguanil (AP) versus quinine plus tetracycline (Q plus T)

Outcome or subgroup title

No. of studies

No. of participants

Statistical method

Effect size

1 Treatment failure on or by day 28 Show forest plot

1

Risk Ratio (M‐H, Fixed, 95% CI)

Totals not selected

2 Parasite clearance time (mean; h) Show forest plot

1

Mean Difference (IV, Fixed, 95% CI)

Totals not selected

3 Fever clearance time (mean; h) Show forest plot

1

Mean Difference (IV, Fixed, 95% CI)

Totals not selected

4 Adverse events Show forest plot

1

Risk Ratio (M‐H, Fixed, 95% CI)

Totals not selected

4.1 Abdominal pain

1

Risk Ratio (M‐H, Fixed, 95% CI)

0.0 [0.0, 0.0]

4.2 Anorexia

1

Risk Ratio (M‐H, Fixed, 95% CI)

0.0 [0.0, 0.0]

4.3 Diarrhoea

1

Risk Ratio (M‐H, Fixed, 95% CI)

0.0 [0.0, 0.0]

4.4 Dizziness

1

Risk Ratio (M‐H, Fixed, 95% CI)

0.0 [0.0, 0.0]

4.5 Headache

1

Risk Ratio (M‐H, Fixed, 95% CI)

0.0 [0.0, 0.0]

4.6 Nausea

1

Risk Ratio (M‐H, Fixed, 95% CI)

0.0 [0.0, 0.0]

4.7 Pruritus

1

Risk Ratio (M‐H, Fixed, 95% CI)

0.0 [0.0, 0.0]

4.8 Tinnitus

1

Risk Ratio (M‐H, Fixed, 95% CI)

0.0 [0.0, 0.0]

4.9 Vomiting

1

Risk Ratio (M‐H, Fixed, 95% CI)

0.0 [0.0, 0.0]

4.10 Weakness

1

Risk Ratio (M‐H, Fixed, 95% CI)

0.0 [0.0, 0.0]

Figuras y tablas -
Comparison 4. Atovaquone‐proguanil (AP) versus quinine plus tetracycline (Q plus T)
Comparison 5. Atovaquone‐proguanil (AP) versus halofantrine

Outcome or subgroup title

No. of studies

No. of participants

Statistical method

Effect size

1 Treatment failure on or by day 28 Show forest plot

2

Risk Ratio (M‐H, Fixed, 95% CI)

Totals not selected

2 Parasite clearance time (mean; h) Show forest plot

2

205

Mean Difference (IV, Fixed, 95% CI)

14.76 [10.41, 19.10]

3 Fever clearance time (mean; h) Show forest plot

2

205

Mean Difference (IV, Fixed, 95% CI)

‐1.70 [‐9.41, 6.02]

4 Adverse events Show forest plot

2

Risk Ratio (M‐H, Random, 95% CI)

Subtotals only

4.1 Abdominal pain

2

216

Risk Ratio (M‐H, Random, 95% CI)

0.81 [0.14, 4.68]

4.2 Chills/Rigors

1

168

Risk Ratio (M‐H, Random, 95% CI)

0.67 [0.11, 3.89]

4.3 Cough

1

168

Risk Ratio (M‐H, Random, 95% CI)

0.71 [0.34, 1.52]

4.4 Diarrhoea

2

216

Risk Ratio (M‐H, Random, 95% CI)

0.57 [0.23, 1.39]

4.5 Headache

2

216

Risk Ratio (M‐H, Random, 95% CI)

1.09 [0.17, 6.84]

4.6 Insomnia

2

216

Risk Ratio (M‐H, Random, 95% CI)

0.62 [0.15, 2.60]

4.7 Moderate or severe

1

168

Risk Ratio (M‐H, Random, 95% CI)

0.38 [0.15, 0.91]

4.8 Myalgia

1

168

Risk Ratio (M‐H, Random, 95% CI)

0.14 [0.01, 2.72]

4.9 Nausea

1

48

Risk Ratio (M‐H, Random, 95% CI)

2.76 [0.62, 12.33]

4.10 Palpitations

1

168

Risk Ratio (M‐H, Random, 95% CI)

0.5 [0.05, 5.41]

4.11 Pruritus

2

216

Risk Ratio (M‐H, Random, 95% CI)

1.20 [0.51, 2.87]

4.12 Vomiting

2

216

Risk Ratio (M‐H, Random, 95% CI)

3.47 [0.66, 18.43]

4.13 Weakness

1

168

Risk Ratio (M‐H, Random, 95% CI)

0.25 [0.03, 2.19]

Figuras y tablas -
Comparison 5. Atovaquone‐proguanil (AP) versus halofantrine
Comparison 6. Atovaquone‐proguanil (AP) versus mefloquine

Outcome or subgroup title

No. of studies

No. of participants

Statistical method

Effect size

1 Treatment failure on or by day 28 Show forest plot

1

Risk Ratio (M‐H, Fixed, 95% CI)

Totals not selected

2 Parasite clearance time (mean; h) Show forest plot

1

Mean Difference (IV, Fixed, 95% CI)

Totals not selected

3 Fever clearance time (mean; h) Show forest plot

1

Mean Difference (IV, Fixed, 95% CI)

Totals not selected

4 Adverse events Show forest plot

1

Risk Ratio (M‐H, Fixed, 95% CI)

Totals not selected

4.1 Abdominal pain

1

Risk Ratio (M‐H, Fixed, 95% CI)

0.0 [0.0, 0.0]

4.2 Anaemia

1

Risk Ratio (M‐H, Fixed, 95% CI)

0.0 [0.0, 0.0]

4.3 Diarrhoea

1

Risk Ratio (M‐H, Fixed, 95% CI)

0.0 [0.0, 0.0]

4.4 Dizziness

1

Risk Ratio (M‐H, Fixed, 95% CI)

0.0 [0.0, 0.0]

4.5 Headache

1

Risk Ratio (M‐H, Fixed, 95% CI)

0.0 [0.0, 0.0]

4.6 Insomnia

1

Risk Ratio (M‐H, Fixed, 95% CI)

0.0 [0.0, 0.0]

4.7 Nausea

1

Risk Ratio (M‐H, Fixed, 95% CI)

0.0 [0.0, 0.0]

4.8 Raised liver enzymes

1

Risk Ratio (M‐H, Fixed, 95% CI)

0.0 [0.0, 0.0]

4.9 Sore throat

1

Risk Ratio (M‐H, Fixed, 95% CI)

0.0 [0.0, 0.0]

4.10 Vomiting

1

Risk Ratio (M‐H, Fixed, 95% CI)

0.0 [0.0, 0.0]

4.11 Any event

1

Risk Ratio (M‐H, Fixed, 95% CI)

0.0 [0.0, 0.0]

Figuras y tablas -
Comparison 6. Atovaquone‐proguanil (AP) versus mefloquine
Comparison 7. Atovaquone‐proguanil (AP) versus artesunate plus mefloquine (AS plus MQ)

Outcome or subgroup title

No. of studies

No. of participants

Statistical method

Effect size

1 Treatment failure on or by day 14 Show forest plot

1

Risk Ratio (M‐H, Fixed, 95% CI)

Totals not selected

2 Treatment failure on or by day 28 adjusted by PCR Show forest plot

1

Risk Ratio (M‐H, Fixed, 95% CI)

Totals not selected

3 Adverse events Show forest plot

1

Risk Ratio (M‐H, Fixed, 95% CI)

Totals not selected

3.1 Anorexia

1

Risk Ratio (M‐H, Fixed, 95% CI)

0.0 [0.0, 0.0]

3.2 Dizziness

1

Risk Ratio (M‐H, Fixed, 95% CI)

0.0 [0.0, 0.0]

3.3 Nausea

1

Risk Ratio (M‐H, Fixed, 95% CI)

0.0 [0.0, 0.0]

3.4 Palpitations

1

Risk Ratio (M‐H, Fixed, 95% CI)

0.0 [0.0, 0.0]

3.5 Skin rash

1

Risk Ratio (M‐H, Fixed, 95% CI)

0.0 [0.0, 0.0]

3.6 Sleeping disorders

1

Risk Ratio (M‐H, Fixed, 95% CI)

0.0 [0.0, 0.0]

3.7 Tremor

1

Risk Ratio (M‐H, Fixed, 95% CI)

0.0 [0.0, 0.0]

3.8 Vomiting

1

Risk Ratio (M‐H, Fixed, 95% CI)

0.0 [0.0, 0.0]

Figuras y tablas -
Comparison 7. Atovaquone‐proguanil (AP) versus artesunate plus mefloquine (AS plus MQ)
Comparison 8. Atovaquone‐proguanil (AP) versus dihydroartemisinin, piperaquine, trimethoprim, and primaquine (CV8)

Outcome or subgroup title

No. of studies

No. of participants

Statistical method

Effect size

1 Treatment failure on or by day 28 Show forest plot

1

Risk Ratio (M‐H, Fixed, 95% CI)

Totals not selected

2 Parasite clearance time (mean; h) Show forest plot

1

Mean Difference (IV, Fixed, 95% CI)

Totals not selected

3 Fever clearance time (mean; h) Show forest plot

1

Mean Difference (IV, Fixed, 95% CI)

Totals not selected

4 Adverse events Show forest plot

1

Risk Ratio (M‐H, Fixed, 95% CI)

Totals not selected

4.1 Diarrhoea

1

Risk Ratio (M‐H, Fixed, 95% CI)

0.0 [0.0, 0.0]

4.2 Dry mouth

1

Risk Ratio (M‐H, Fixed, 95% CI)

0.0 [0.0, 0.0]

4.3 Headache

1

Risk Ratio (M‐H, Fixed, 95% CI)

0.0 [0.0, 0.0]

4.4 Itch

1

Risk Ratio (M‐H, Fixed, 95% CI)

0.0 [0.0, 0.0]

4.5 Vomiting

1

Risk Ratio (M‐H, Fixed, 95% CI)

0.0 [0.0, 0.0]

Figuras y tablas -
Comparison 8. Atovaquone‐proguanil (AP) versus dihydroartemisinin, piperaquine, trimethoprim, and primaquine (CV8)