Atovacuona‐proguanil para el tratamiento del paludismo no complicado
Referencias
Referencias de los estudios incluidos en esta revisión
Referencias de los estudios excluidos de esta revisión
Referencias adicionales
Characteristics of studies
Characteristics of included studies [ordered by study ID]
Ir a:
| Methods | Randomized controlled trial Length of follow up: 28 d Generation of allocation sequence: random assignment of study number Allocation concealment: unclear Blinding: none Inclusion of all randomized participants in the analysis: 164 analysed/168 randomized (97.6%) | |
| Participants | Number: 168 enrolled; 164 analysed; 4 discontinued intervention and were excluded Age range: 3 to 12 years Gender: male and female Inclusion criteria: age 3 to 12 years; uncomplicated malaria; fever; parasitaemia between 1000 to 200,000 parasites/µL; ability to tolerate oral therapy; weight > 10 kg; written informed consent given by parent or guardian Exclusion criteria: severe or cerebral malaria; prolonged QTc interval (above 0.44 s); mixed infections with other Plasmodium species; | |
| Interventions | 1. Atovaquone‐proguanil (60 mg/kg atovaquone and 24 mg/kg proguanil over 3 d) | |
| Outcomes | 1. 28‐d cure rate | |
| Notes | Location: Kenya Drug resistance: not stated | |
| Methods | Randomized controlled trial Length of follow up: 28 d Generation of allocation sequence: blocks of 10 and sequentially assigned to groups Allocation concealment: sealed envelopes Blinding: none Inclusion of all randomized participants in the final analysis: 170 analysed/200 randomized (85%) | |
| Participants | Number: 200 enrolled; 170 analysed, 92 for the atovaquone‐proguanil group and 78 for amodiaquine group Gender: male and female Age range: 3 to 43 months Inclusion criteria: documented uncomplicated falciparum malaria with parasitaemia between 1000 and 200,000 parasites/µL; weight between 5 kg and 11 kg; written or verbal informed consent by parent or guardian Exclusion criteria: administration of antimalarials or medications with antimalarials or haemolytic effects with previous 7 d; underlying severe diseases or concomitant infections causing fever; hypersensitivity to atovaquone, proguanil, or amodiaquine; predefined abnormal laboratory values at screening; symptoms and signs of severe malaria | |
| Interventions | 1. Atovaquone‐proguanil (fixed dose combination containing 62.5 mg atovaquone and 25 mg proguanil for 3 d) | |
| Outcomes | 1. 28‐d cure rate | |
| Notes | Location: Gabon Drug resistance: not stated | |
| Methods | Randomized controlled trial Length of follow up: 35 d Generation of allocation sequence: unclear Allocation concealment: unclear Blinding: none Inclusion of all randomized participants in the final analysis: 41 analysed/48 randomized (85%) | |
| Participants | Number enrolled: 48 Age range: 15 to 65 years Gender: male and female Inclusion criteria: > 16 years old; had malaria from a short stay in an endemic country; non‐immune individual; parasitaemia between 1000 and 100,000 parasites/µL Exclusion criteria: severe malaria; prolonged QTc interval (above 0.44 s); presence of mixed infections with other Plasmodium species; presence of concomitant disease; inability to take oral treatment; history of syncope; pregnancy; breastfeeding mother; weighed < 40 kg; resided in an endemic area for the previous year | |
| Interventions | 1. Atovaquone‐proguanil (4 x 250 mg atovaquone and 4 x 100 mg proguanil as single daily dose for 3 d) | |
| Outcomes | 1. 28‐d cure rate | |
| Notes | Location: France Drug resistance: difficult to say as malaria was imported | |
| Methods | Randomized controlled trial Length of follow up: 28 d Generation of allocation sequence: unclear Allocation concealment: unclear Blinding: none Inclusion of all randomized participants in the final analysis: 154 analysed/175 randomized (88%) | |
| Participants | Number enrolled: 175 Age range: 18 to 65 years Gender: male Inclusion criteria: adult men; age 18 to 68 years; smear positive falciparum malaria; general good health; parasitaemia between 1000 and 100,000 parasites/µL Exclusion criteria: grossly abnormal laboratory results; refusal to be hospitalized for 28 d; inability to tolerate study medication; missing study medication | |
| Interventions | 1. Atovaquone plus proguanil (atovaquone 1 g and proguanil 400 mg daily for 3 d) | |
| Outcomes | 1. 28‐d cure rate | |
| Notes | Location: Brazil Drug resistance: high for chloroquine, sulfadoxine‐pyrimethamine, and quinine to some extent | |
| Methods | Randomized controlled trial Length of follow up: all followed up for 28 d; 92 participants followed up for 56 d Generation of allocation sequence: codes were allocated in randomized blocks of 10 Allocation concealment: sealed envelope Blinding: none Inclusion of all randomized participants in the final analysis: 161 analysed/165 randomized (98%) | |
| Participants | Number enrolled: 165; 161 analysed; 4 excluded for P. vivax infection Age range: 17 to 64 years for atovaquone‐proguanil group; 16 to 73 years for dihydroartemisinin‐piperaquine‐trimethoprim‐primaquine group Gender: male and female; though slight difference in ratio Inclusion criteria: uncomplicated falciparum malaria with parasitaemia > 1000 parasites/µL; age > 16 years Exclusion criteria: pregnancy; lactation; complicated malaria; inability to take oral medication; known allergy to study drugs; verbal confirmation of taking artemisinin within 24 h, mefloquine/tetracycline/doxycycline in 7 days and quinine in previous 12 h | |
| Interventions | 1. Atovaquone‐proguanil (4 x 250 mg atovaquone and 4 x 100 mg proguanil) as single dose daily for 3 d | |
| Outcomes | 1. Radical cure at d 28 | |
| Notes | Location: Binh Thuan, south Viet Nam Drug resistance: unclear | |
| Methods | Randomized controlled trial Length of follow up: 28 d Generation of allocation sequence: unclear Allocation concealment: unclear Blinding: none Inclusion of all randomized participants in the final analysis: 39 analysed/43 randomized (91%) | |
| Participants | Number enrolled: 43 Age range: 15 to 65 years Gender: male and female Inclusion criteria: age 12 to 65 years; presence of acute uncomplicated falciparum malaria; lifelong residents of the study area; parasitaemia between 1000 and 200,000 parasites/µL Exclusion criteria: severe malaria; presence of mixed infections with other Plasmodium species; presence of concomitant disease; inability to take oral treatment; pregnancy; breastfeeding mother | |
| Interventions | 1. Atovaquone plus proguanil (1000 mg atovaquone, 400 mg proguanil over 3 d) | |
| Outcomes | 1. 28‐d cure rate | |
| Notes | Location: Peru Drug resistance: high for chloroquine | |
| Methods | Randomized controlled trial Length of follow up: 28 d Generation of allocation sequence: unclear Allocation concealment: unclear Blinding: none Inclusion of all randomized participants in the final analysis: 158 analysed/182 randomized (87%) | |
| Participants | Number enrolled: 182 Age range: 15 to 63 years Gender: male and female Inclusion criteria: age 16 to 65 years; presence of acute uncomplicated falciparum malaria; parasitaemia between 1000 and 200,000/µL; weight 40 kg and above Exclusion criteria: presence of mixed infections with other Plasmodium species; presence of concomitant disease (intercurrent febrile infections); inability to take oral treatment (persistent vomiting); pregnancy; breastfeeding mother | |
| Interventions | 1. Atovaquone plus proguanil (1000 mg atovaquone and 400 mg proguanil daily over 3 d) | |
| Outcomes | 1. 28‐d cure rate | |
| Notes | Location: Thailand Drug resistance: high for chloroquine and sulfadoxine‐pyrimethamine | |
| Methods | Randomized controlled trial Length of follow up: 28 d Generation of allocation sequence: unclear Allocation concealment: unclear Blinding: none Inclusion of all randomized participants in the final analysis: 160 analysed/163 randomized (98%) | |
| Participants | Number randomized: 163 Age range: 14 to 54 years Gender: male and female (mainly male) Inclusion criteria: age 12 to 65 years; presence of acute uncomplicated falciparum malaria; parasitaemia between 1000 and 200,000/µL; weight 40 kg and above; no underlying disease Exclusion criteria: presence of mixed infections with other Plasmodium species; presence of concomitant disease (intercurrent febrile infections); inability to take oral treatment (persistent vomiting); pregnancy | |
| Interventions | 1. Atovaquone plus proguanil (1000 mg atovaquone and 400 mg proguanil daily over 3 d) | |
| Outcomes | 1. 28‐d cure rate | |
| Notes | Location: Zambia Drug resistance: high for chloroquine | |
| Methods | Randomized controlled trial Length of follow up: 28 d Generation of allocation sequence: participants given a sequential study number, which was randomly assigned to treatment option Allocation concealment: unclear Blinding: none Inclusion of all randomized participants in the final analysis: 126 analysed/142 randomized (89%) | |
| Participants | Number enrolled: 142 Age range: 15 to 65 years Gender: male and female (mainly male) Inclusion criteria: age 15 to 65 years; presence of acute uncomplicated falciparum malaria; parasitaemia between 200 and 100,000 parasites/µL; weight 40 kg and above; urine test negative for chloroquine or sulphonamides Exclusion criteria: severe malaria; presence of mixed infections with other Plasmodium species; presence of concomitant disease (intercurrent febrile infections); 2‐week history of antimalarial administration; pregnancy; breastfeeding mother | |
| Interventions | 1. Atovaquone plus proguanil (1000 mg atovaquone and 400 mg proguanil daily over 3 d) | |
| Outcomes | 1. 28‐d cure rate | |
| Notes | Location: Gabon Drug resistance: high for chloroquine | |
| Methods | Randomized controlled trial Length of follow up: 42 d Generation of allocation sequence: block randomization Allocation concealment: sealed envelopes Blinding: none Inclusion of all randomized participants in the final analysis: 1063 analysed/1063 randomized (100%) | |
| Participants | Number enrolled:1063 Age range: 2 to 70 years Gender: male and female Inclusion criteria: age 2 to 70 years; slide confirmed acute uncomplicated falciparum malaria; weight > 10 kg; written informed consent by patient or guardian; not pregnant; not received mefloquine in the previous 63 d; not obtunded; not vomiting; no other clinical or laboratory signs of severe illness Exclusion criteria: severe malaria; presence of mixed infections with other Plasmodium species; presence of concomitant disease (intercurrent febrile infections); 2‐week history of antimalarial administration; pregnancy; breastfeeding mother | |
| Interventions | 1. Atovaquone plus proguanil (atovaquone 15 mg/kg/d, proguanil 8 mg/kg/d for 3 d) Participants with axillary temperature > 38 °C given antipyretics and cooled by tepid sponging before drug administration | |
| Outcomes | 1. Incidence of microscopically and genetically confirmed recrudescent infections | |
| Notes | Location: Thailand Drug resistance: multiple‐drug resistance except artemisinin derivatives | |
Characteristics of excluded studies [ordered by study ID]
Ir a:
| Study | Reason for exclusion |
| Trial protocol initially randomized participants to receive chloroquine or atovaquone‐proguanil. However, after 40 participants had been recruited, the cure rate for chloroquine was found to be < 35%, thus subsequent participants in the chloroquine arm were given sulfadoxine‐pyrimethamine in addition. This ultimately resulted in a 3‐arm study. Participants in the atovaquone‐proguanil arm at the time of the protocol amendment should have been separated from those who were recruited after the amendment in order to make the comparisons |
Data and analyses
| Outcome or subgroup title | No. of studies | No. of participants | Statistical method | Effect size |
| 1 Treatment failure on or by day 28 Show forest plot | 1 | Risk Ratio (M‐H, Fixed, 95% CI) | Totals not selected | |
| Analysis 1.1  Comparison 1 Atovaquone‐proguanil (AP) versus chloroquine, Outcome 1 Treatment failure on or by day 28. | ||||
| 2 Parasite clearance time (mean; h) Show forest plot | 1 | Mean Difference (IV, Fixed, 95% CI) | Totals not selected | |
| Analysis 1.2  Comparison 1 Atovaquone‐proguanil (AP) versus chloroquine, Outcome 2 Parasite clearance time (mean; h). | ||||
| 3 Fever clearance time (mean; h) Show forest plot | 1 | Mean Difference (IV, Fixed, 95% CI) | Totals not selected | |
| Analysis 1.3  Comparison 1 Atovaquone‐proguanil (AP) versus chloroquine, Outcome 3 Fever clearance time (mean; h). | ||||
| 4 Adverse events Show forest plot | 1 | Risk Ratio (M‐H, Fixed, 95% CI) | Totals not selected | |
| Analysis 1.4  Comparison 1 Atovaquone‐proguanil (AP) versus chloroquine, Outcome 4 Adverse events. | ||||
| 4.1 Abdominal pain | 1 | Risk Ratio (M‐H, Fixed, 95% CI) | 0.0 [0.0, 0.0] | |
| 4.2 Chills/rigors | 1 | Risk Ratio (M‐H, Fixed, 95% CI) | 0.0 [0.0, 0.0] | |
| 4.3 Dizziness | 1 | Risk Ratio (M‐H, Fixed, 95% CI) | 0.0 [0.0, 0.0] | |
| 4.4 Headache | 1 | Risk Ratio (M‐H, Fixed, 95% CI) | 0.0 [0.0, 0.0] | |
| 4.5 Insomnia | 1 | Risk Ratio (M‐H, Fixed, 95% CI) | 0.0 [0.0, 0.0] | |
| 4.6 Nausea | 1 | Risk Ratio (M‐H, Fixed, 95% CI) | 0.0 [0.0, 0.0] | |
| 4.7 Palpitations | 1 | Risk Ratio (M‐H, Fixed, 95% CI) | 0.0 [0.0, 0.0] | |
| 4.8 Pruritus | 1 | Risk Ratio (M‐H, Fixed, 95% CI) | 0.0 [0.0, 0.0] | |
| 4.9 Severe | 1 | Risk Ratio (M‐H, Fixed, 95% CI) | 0.0 [0.0, 0.0] | |
| 4.10 Vomiting | 1 | Risk Ratio (M‐H, Fixed, 95% CI) | 0.0 [0.0, 0.0] | |
| 4.11 Weakness | 1 | Risk Ratio (M‐H, Fixed, 95% CI) | 0.0 [0.0, 0.0] | |
| Outcome or subgroup title | No. of studies | No. of participants | Statistical method | Effect size |
| 1 Treatment failure on or by day 28 Show forest plot | 2 | 342 | Risk Ratio (M‐H, Fixed, 95% CI) | 0.22 [0.13, 0.36] |
| Analysis 2.1  Comparison 2 Atovaquone‐proguanil (AP) versus amodiaquine, Outcome 1 Treatment failure on or by day 28. | ||||
| 2 Treatment failure on or by day 14 Show forest plot | 1 | Risk Ratio (M‐H, Fixed, 95% CI) | Totals not selected | |
| Analysis 2.2  Comparison 2 Atovaquone‐proguanil (AP) versus amodiaquine, Outcome 2 Treatment failure on or by day 14. | ||||
| 3 Parasite clearance time (mean; h) Show forest plot | 1 | Mean Difference (IV, Fixed, 95% CI) | Totals not selected | |
| Analysis 2.3  Comparison 2 Atovaquone‐proguanil (AP) versus amodiaquine, Outcome 3 Parasite clearance time (mean; h). | ||||
| 4 Fever clearance time (mean; h) Show forest plot | 1 | Mean Difference (IV, Fixed, 95% CI) | Totals not selected | |
| Analysis 2.4  Comparison 2 Atovaquone‐proguanil (AP) versus amodiaquine, Outcome 4 Fever clearance time (mean; h). | ||||
| 5 Adverse events Show forest plot | 2 | Risk Ratio (M‐H, Fixed, 95% CI) | Subtotals only | |
| Analysis 2.5  Comparison 2 Atovaquone‐proguanil (AP) versus amodiaquine, Outcome 5 Adverse events. | ||||
| 5.1 Abdominal pain | 1 | 126 | Risk Ratio (M‐H, Fixed, 95% CI) | 2.8 [1.07, 7.31] |
| 5.2 Diarrhoea | 2 | 326 | Risk Ratio (M‐H, Fixed, 95% CI) | 0.96 [0.57, 1.61] |
| 5.3 Dizziness | 1 | 126 | Risk Ratio (M‐H, Fixed, 95% CI) | 0.27 [0.08, 0.93] |
| 5.4 Insomnia | 1 | 126 | Risk Ratio (M‐H, Fixed, 95% CI) | 0.29 [0.12, 0.75] |
| 5.5 Nausea | 1 | 126 | Risk Ratio (M‐H, Fixed, 95% CI) | 2.63 [1.26, 5.48] |
| 5.6 Pruritus | 1 | 126 | Risk Ratio (M‐H, Fixed, 95% CI) | 0.11 [0.04, 0.35] |
| 5.7 Respiratory infections | 1 | 200 | Risk Ratio (M‐H, Fixed, 95% CI) | 3.0 [0.62, 14.51] |
| 5.8 Vomiting | 2 | 326 | Risk Ratio (M‐H, Fixed, 95% CI) | 1.39 [0.80, 2.41] |
| 5.9 Weakness | 2 | 326 | Risk Ratio (M‐H, Fixed, 95% CI) | 0.12 [0.02, 0.64] |
| 5.10 Any event | 1 | 200 | Risk Ratio (M‐H, Fixed, 95% CI) | 1.12 [0.82, 1.51] |
| Outcome or subgroup title | No. of studies | No. of participants | Statistical method | Effect size |
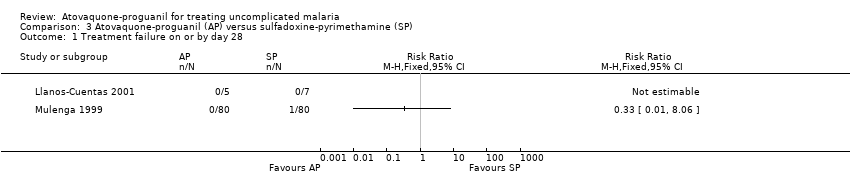
| 1 Treatment failure on or by day 28 Show forest plot | 2 | Risk Ratio (M‐H, Fixed, 95% CI) | Totals not selected | |
| Analysis 3.1  Comparison 3 Atovaquone‐proguanil (AP) versus sulfadoxine‐pyrimethamine (SP), Outcome 1 Treatment failure on or by day 28. | ||||
| 2 Parasite clearance time (mean; h) Show forest plot | 2 | 174 | Mean Difference (IV, Fixed, 95% CI) | 11.23 [5.43, 17.03] |
| Analysis 3.2  Comparison 3 Atovaquone‐proguanil (AP) versus sulfadoxine‐pyrimethamine (SP), Outcome 2 Parasite clearance time (mean; h). | ||||
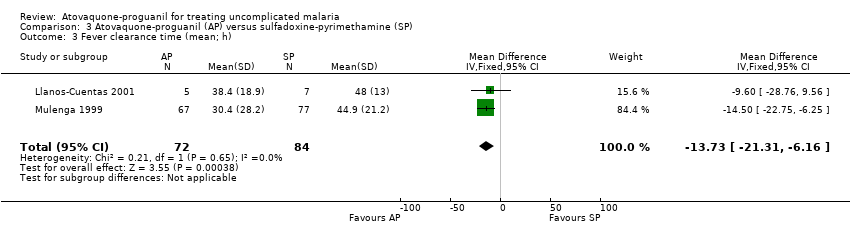
| 3 Fever clearance time (mean; h) Show forest plot | 2 | 156 | Mean Difference (IV, Fixed, 95% CI) | ‐13.73 [‐21.31, ‐6.16] |
| Analysis 3.3  Comparison 3 Atovaquone‐proguanil (AP) versus sulfadoxine‐pyrimethamine (SP), Outcome 3 Fever clearance time (mean; h). | ||||
| 4 Progression to severe disease Show forest plot | 1 | Risk Ratio (M‐H, Fixed, 95% CI) | Totals not selected | |
| Analysis 3.4  Comparison 3 Atovaquone‐proguanil (AP) versus sulfadoxine‐pyrimethamine (SP), Outcome 4 Progression to severe disease. | ||||
| 5 Adverse events Show forest plot | 2 | Risk Ratio (M‐H, Fixed, 95% CI) | Subtotals only | |
| Analysis 3.5  Comparison 3 Atovaquone‐proguanil (AP) versus sulfadoxine‐pyrimethamine (SP), Outcome 5 Adverse events. | ||||
| 5.1 Abdominal pain | 2 | 189 | Risk Ratio (M‐H, Fixed, 95% CI) | 0.85 [0.58, 1.24] |
| 5.2 Chills/rigors | 1 | 29 | Risk Ratio (M‐H, Fixed, 95% CI) | 1.43 [0.06, 32.05] |
| 5.3 Diarrhoea | 1 | 160 | Risk Ratio (M‐H, Fixed, 95% CI) | 43.0 [2.65, 697.91] |
| 5.4 Dizziness | 1 | 29 | Risk Ratio (M‐H, Fixed, 95% CI) | 1.43 [0.06, 32.05] |
| 5.5 Headache | 2 | 189 | Risk Ratio (M‐H, Fixed, 95% CI) | 1.17 [0.81, 1.67] |
| 5.6 Insomnia | 1 | 29 | Risk Ratio (M‐H, Fixed, 95% CI) | 0.34 [0.09, 1.21] |
| 5.7 Nausea | 1 | 29 | Risk Ratio (M‐H, Fixed, 95% CI) | 2.25 [0.31, 16.59] |
| 5.8 Orthostatic hypotension | 1 | 160 | Risk Ratio (M‐H, Fixed, 95% CI) | 0.03 [0.00, 0.57] |
| 5.9 Pruritus | 1 | 29 | Risk Ratio (M‐H, Fixed, 95% CI) | 0.16 [0.01, 3.56] |
| 5.10 Raised liver enzymes | 1 | 160 | Risk Ratio (M‐H, Fixed, 95% CI) | 0.67 [0.25, 1.79] |
| 5.11 Severe | 1 | 29 | Risk Ratio (M‐H, Fixed, 95% CI) | 1.43 [0.06, 32.05] |
| 5.12 Vomiting | 2 | 189 | Risk Ratio (M‐H, Fixed, 95% CI) | 0.97 [0.50, 1.90] |
| 5.13 Weakness | 2 | 189 | Risk Ratio (M‐H, Fixed, 95% CI) | 1.47 [0.82, 2.62] |
| Outcome or subgroup title | No. of studies | No. of participants | Statistical method | Effect size |
| 1 Treatment failure on or by day 28 Show forest plot | 1 | Risk Ratio (M‐H, Fixed, 95% CI) | Totals not selected | |
| Analysis 4.1  Comparison 4 Atovaquone‐proguanil (AP) versus quinine plus tetracycline (Q plus T), Outcome 1 Treatment failure on or by day 28. | ||||
| 2 Parasite clearance time (mean; h) Show forest plot | 1 | Mean Difference (IV, Fixed, 95% CI) | Totals not selected | |
| Analysis 4.2  Comparison 4 Atovaquone‐proguanil (AP) versus quinine plus tetracycline (Q plus T), Outcome 2 Parasite clearance time (mean; h). | ||||
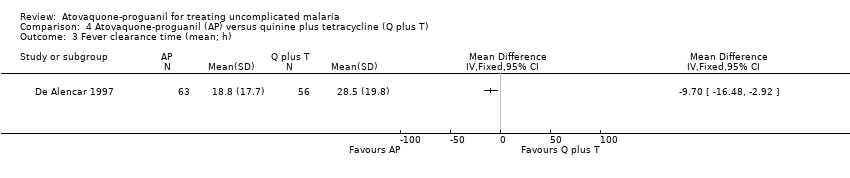
| 3 Fever clearance time (mean; h) Show forest plot | 1 | Mean Difference (IV, Fixed, 95% CI) | Totals not selected | |
| Analysis 4.3  Comparison 4 Atovaquone‐proguanil (AP) versus quinine plus tetracycline (Q plus T), Outcome 3 Fever clearance time (mean; h). | ||||
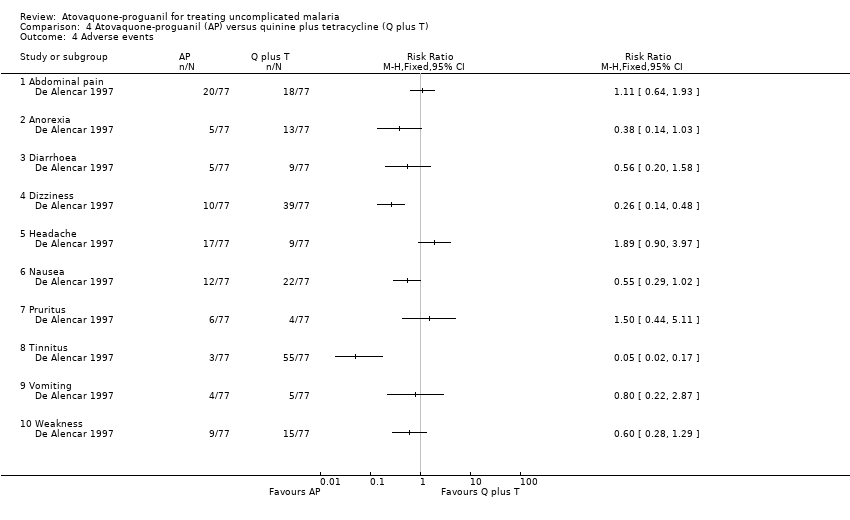
| 4 Adverse events Show forest plot | 1 | Risk Ratio (M‐H, Fixed, 95% CI) | Totals not selected | |
| Analysis 4.4  Comparison 4 Atovaquone‐proguanil (AP) versus quinine plus tetracycline (Q plus T), Outcome 4 Adverse events. | ||||
| 4.1 Abdominal pain | 1 | Risk Ratio (M‐H, Fixed, 95% CI) | 0.0 [0.0, 0.0] | |
| 4.2 Anorexia | 1 | Risk Ratio (M‐H, Fixed, 95% CI) | 0.0 [0.0, 0.0] | |
| 4.3 Diarrhoea | 1 | Risk Ratio (M‐H, Fixed, 95% CI) | 0.0 [0.0, 0.0] | |
| 4.4 Dizziness | 1 | Risk Ratio (M‐H, Fixed, 95% CI) | 0.0 [0.0, 0.0] | |
| 4.5 Headache | 1 | Risk Ratio (M‐H, Fixed, 95% CI) | 0.0 [0.0, 0.0] | |
| 4.6 Nausea | 1 | Risk Ratio (M‐H, Fixed, 95% CI) | 0.0 [0.0, 0.0] | |
| 4.7 Pruritus | 1 | Risk Ratio (M‐H, Fixed, 95% CI) | 0.0 [0.0, 0.0] | |
| 4.8 Tinnitus | 1 | Risk Ratio (M‐H, Fixed, 95% CI) | 0.0 [0.0, 0.0] | |
| 4.9 Vomiting | 1 | Risk Ratio (M‐H, Fixed, 95% CI) | 0.0 [0.0, 0.0] | |
| 4.10 Weakness | 1 | Risk Ratio (M‐H, Fixed, 95% CI) | 0.0 [0.0, 0.0] | |
| Outcome or subgroup title | No. of studies | No. of participants | Statistical method | Effect size |
| 1 Treatment failure on or by day 28 Show forest plot | 2 | Risk Ratio (M‐H, Fixed, 95% CI) | Totals not selected | |
| Analysis 5.1  Comparison 5 Atovaquone‐proguanil (AP) versus halofantrine, Outcome 1 Treatment failure on or by day 28. | ||||
| 2 Parasite clearance time (mean; h) Show forest plot | 2 | 205 | Mean Difference (IV, Fixed, 95% CI) | 14.76 [10.41, 19.10] |
| Analysis 5.2  Comparison 5 Atovaquone‐proguanil (AP) versus halofantrine, Outcome 2 Parasite clearance time (mean; h). | ||||
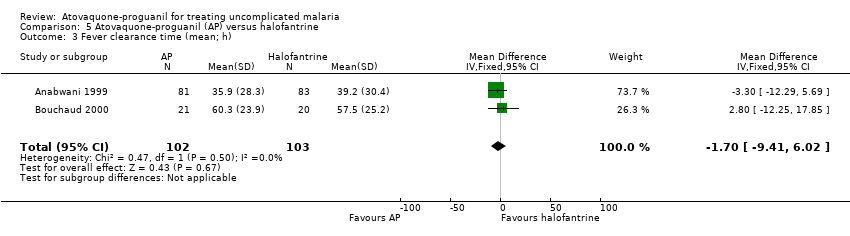
| 3 Fever clearance time (mean; h) Show forest plot | 2 | 205 | Mean Difference (IV, Fixed, 95% CI) | ‐1.70 [‐9.41, 6.02] |
| Analysis 5.3  Comparison 5 Atovaquone‐proguanil (AP) versus halofantrine, Outcome 3 Fever clearance time (mean; h). | ||||
| 4 Adverse events Show forest plot | 2 | Risk Ratio (M‐H, Random, 95% CI) | Subtotals only | |
| Analysis 5.4  Comparison 5 Atovaquone‐proguanil (AP) versus halofantrine, Outcome 4 Adverse events. | ||||
| 4.1 Abdominal pain | 2 | 216 | Risk Ratio (M‐H, Random, 95% CI) | 0.81 [0.14, 4.68] |
| 4.2 Chills/Rigors | 1 | 168 | Risk Ratio (M‐H, Random, 95% CI) | 0.67 [0.11, 3.89] |
| 4.3 Cough | 1 | 168 | Risk Ratio (M‐H, Random, 95% CI) | 0.71 [0.34, 1.52] |
| 4.4 Diarrhoea | 2 | 216 | Risk Ratio (M‐H, Random, 95% CI) | 0.57 [0.23, 1.39] |
| 4.5 Headache | 2 | 216 | Risk Ratio (M‐H, Random, 95% CI) | 1.09 [0.17, 6.84] |
| 4.6 Insomnia | 2 | 216 | Risk Ratio (M‐H, Random, 95% CI) | 0.62 [0.15, 2.60] |
| 4.7 Moderate or severe | 1 | 168 | Risk Ratio (M‐H, Random, 95% CI) | 0.38 [0.15, 0.91] |
| 4.8 Myalgia | 1 | 168 | Risk Ratio (M‐H, Random, 95% CI) | 0.14 [0.01, 2.72] |
| 4.9 Nausea | 1 | 48 | Risk Ratio (M‐H, Random, 95% CI) | 2.76 [0.62, 12.33] |
| 4.10 Palpitations | 1 | 168 | Risk Ratio (M‐H, Random, 95% CI) | 0.5 [0.05, 5.41] |
| 4.11 Pruritus | 2 | 216 | Risk Ratio (M‐H, Random, 95% CI) | 1.20 [0.51, 2.87] |
| 4.12 Vomiting | 2 | 216 | Risk Ratio (M‐H, Random, 95% CI) | 3.47 [0.66, 18.43] |
| 4.13 Weakness | 1 | 168 | Risk Ratio (M‐H, Random, 95% CI) | 0.25 [0.03, 2.19] |
| Outcome or subgroup title | No. of studies | No. of participants | Statistical method | Effect size |
| 1 Treatment failure on or by day 28 Show forest plot | 1 | Risk Ratio (M‐H, Fixed, 95% CI) | Totals not selected | |
| Analysis 6.1  Comparison 6 Atovaquone‐proguanil (AP) versus mefloquine, Outcome 1 Treatment failure on or by day 28. | ||||
| 2 Parasite clearance time (mean; h) Show forest plot | 1 | Mean Difference (IV, Fixed, 95% CI) | Totals not selected | |
| Analysis 6.2  Comparison 6 Atovaquone‐proguanil (AP) versus mefloquine, Outcome 2 Parasite clearance time (mean; h). | ||||
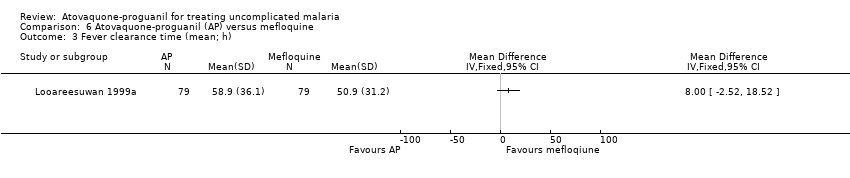
| 3 Fever clearance time (mean; h) Show forest plot | 1 | Mean Difference (IV, Fixed, 95% CI) | Totals not selected | |
| Analysis 6.3  Comparison 6 Atovaquone‐proguanil (AP) versus mefloquine, Outcome 3 Fever clearance time (mean; h). | ||||
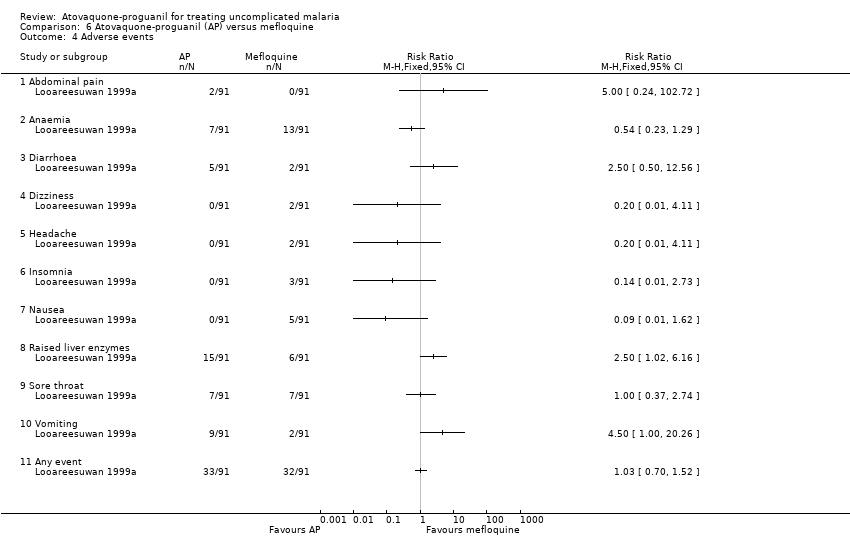
| 4 Adverse events Show forest plot | 1 | Risk Ratio (M‐H, Fixed, 95% CI) | Totals not selected | |
| Analysis 6.4  Comparison 6 Atovaquone‐proguanil (AP) versus mefloquine, Outcome 4 Adverse events. | ||||
| 4.1 Abdominal pain | 1 | Risk Ratio (M‐H, Fixed, 95% CI) | 0.0 [0.0, 0.0] | |
| 4.2 Anaemia | 1 | Risk Ratio (M‐H, Fixed, 95% CI) | 0.0 [0.0, 0.0] | |
| 4.3 Diarrhoea | 1 | Risk Ratio (M‐H, Fixed, 95% CI) | 0.0 [0.0, 0.0] | |
| 4.4 Dizziness | 1 | Risk Ratio (M‐H, Fixed, 95% CI) | 0.0 [0.0, 0.0] | |
| 4.5 Headache | 1 | Risk Ratio (M‐H, Fixed, 95% CI) | 0.0 [0.0, 0.0] | |
| 4.6 Insomnia | 1 | Risk Ratio (M‐H, Fixed, 95% CI) | 0.0 [0.0, 0.0] | |
| 4.7 Nausea | 1 | Risk Ratio (M‐H, Fixed, 95% CI) | 0.0 [0.0, 0.0] | |
| 4.8 Raised liver enzymes | 1 | Risk Ratio (M‐H, Fixed, 95% CI) | 0.0 [0.0, 0.0] | |
| 4.9 Sore throat | 1 | Risk Ratio (M‐H, Fixed, 95% CI) | 0.0 [0.0, 0.0] | |
| 4.10 Vomiting | 1 | Risk Ratio (M‐H, Fixed, 95% CI) | 0.0 [0.0, 0.0] | |
| 4.11 Any event | 1 | Risk Ratio (M‐H, Fixed, 95% CI) | 0.0 [0.0, 0.0] | |
| Outcome or subgroup title | No. of studies | No. of participants | Statistical method | Effect size |
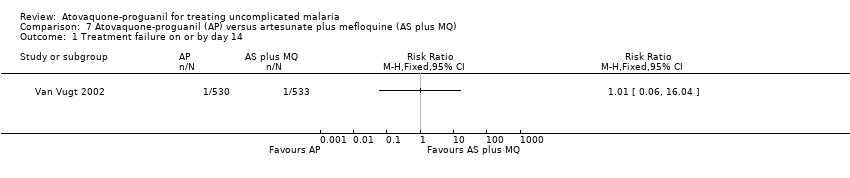
| 1 Treatment failure on or by day 14 Show forest plot | 1 | Risk Ratio (M‐H, Fixed, 95% CI) | Totals not selected | |
| Analysis 7.1  Comparison 7 Atovaquone‐proguanil (AP) versus artesunate plus mefloquine (AS plus MQ), Outcome 1 Treatment failure on or by day 14. | ||||
| 2 Treatment failure on or by day 28 adjusted by PCR Show forest plot | 1 | Risk Ratio (M‐H, Fixed, 95% CI) | Totals not selected | |
| Analysis 7.2  Comparison 7 Atovaquone‐proguanil (AP) versus artesunate plus mefloquine (AS plus MQ), Outcome 2 Treatment failure on or by day 28 adjusted by PCR. | ||||
| 3 Adverse events Show forest plot | 1 | Risk Ratio (M‐H, Fixed, 95% CI) | Totals not selected | |
| Analysis 7.3  Comparison 7 Atovaquone‐proguanil (AP) versus artesunate plus mefloquine (AS plus MQ), Outcome 3 Adverse events. | ||||
| 3.1 Anorexia | 1 | Risk Ratio (M‐H, Fixed, 95% CI) | 0.0 [0.0, 0.0] | |
| 3.2 Dizziness | 1 | Risk Ratio (M‐H, Fixed, 95% CI) | 0.0 [0.0, 0.0] | |
| 3.3 Nausea | 1 | Risk Ratio (M‐H, Fixed, 95% CI) | 0.0 [0.0, 0.0] | |
| 3.4 Palpitations | 1 | Risk Ratio (M‐H, Fixed, 95% CI) | 0.0 [0.0, 0.0] | |
| 3.5 Skin rash | 1 | Risk Ratio (M‐H, Fixed, 95% CI) | 0.0 [0.0, 0.0] | |
| 3.6 Sleeping disorders | 1 | Risk Ratio (M‐H, Fixed, 95% CI) | 0.0 [0.0, 0.0] | |
| 3.7 Tremor | 1 | Risk Ratio (M‐H, Fixed, 95% CI) | 0.0 [0.0, 0.0] | |
| 3.8 Vomiting | 1 | Risk Ratio (M‐H, Fixed, 95% CI) | 0.0 [0.0, 0.0] | |
| Outcome or subgroup title | No. of studies | No. of participants | Statistical method | Effect size |
| 1 Treatment failure on or by day 28 Show forest plot | 1 | Risk Ratio (M‐H, Fixed, 95% CI) | Totals not selected | |
| Analysis 8.1  Comparison 8 Atovaquone‐proguanil (AP) versus dihydroartemisinin, piperaquine, trimethoprim, and primaquine (CV8), Outcome 1 Treatment failure on or by day 28. | ||||
| 2 Parasite clearance time (mean; h) Show forest plot | 1 | Mean Difference (IV, Fixed, 95% CI) | Totals not selected | |
| Analysis 8.2  Comparison 8 Atovaquone‐proguanil (AP) versus dihydroartemisinin, piperaquine, trimethoprim, and primaquine (CV8), Outcome 2 Parasite clearance time (mean; h). | ||||
| 3 Fever clearance time (mean; h) Show forest plot | 1 | Mean Difference (IV, Fixed, 95% CI) | Totals not selected | |
| Analysis 8.3  Comparison 8 Atovaquone‐proguanil (AP) versus dihydroartemisinin, piperaquine, trimethoprim, and primaquine (CV8), Outcome 3 Fever clearance time (mean; h). | ||||
| 4 Adverse events Show forest plot | 1 | Risk Ratio (M‐H, Fixed, 95% CI) | Totals not selected | |
| Analysis 8.4  Comparison 8 Atovaquone‐proguanil (AP) versus dihydroartemisinin, piperaquine, trimethoprim, and primaquine (CV8), Outcome 4 Adverse events. | ||||
| 4.1 Diarrhoea | 1 | Risk Ratio (M‐H, Fixed, 95% CI) | 0.0 [0.0, 0.0] | |
| 4.2 Dry mouth | 1 | Risk Ratio (M‐H, Fixed, 95% CI) | 0.0 [0.0, 0.0] | |
| 4.3 Headache | 1 | Risk Ratio (M‐H, Fixed, 95% CI) | 0.0 [0.0, 0.0] | |
| 4.4 Itch | 1 | Risk Ratio (M‐H, Fixed, 95% CI) | 0.0 [0.0, 0.0] | |
| 4.5 Vomiting | 1 | Risk Ratio (M‐H, Fixed, 95% CI) | 0.0 [0.0, 0.0] | |
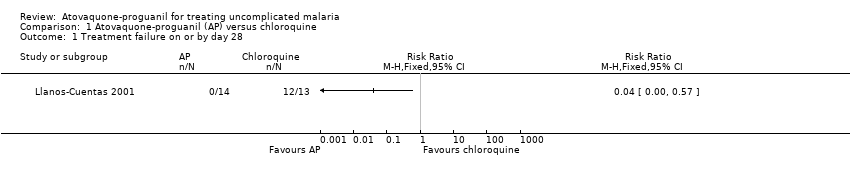
Comparison 1 Atovaquone‐proguanil (AP) versus chloroquine, Outcome 1 Treatment failure on or by day 28.

Comparison 1 Atovaquone‐proguanil (AP) versus chloroquine, Outcome 2 Parasite clearance time (mean; h).

Comparison 1 Atovaquone‐proguanil (AP) versus chloroquine, Outcome 3 Fever clearance time (mean; h).
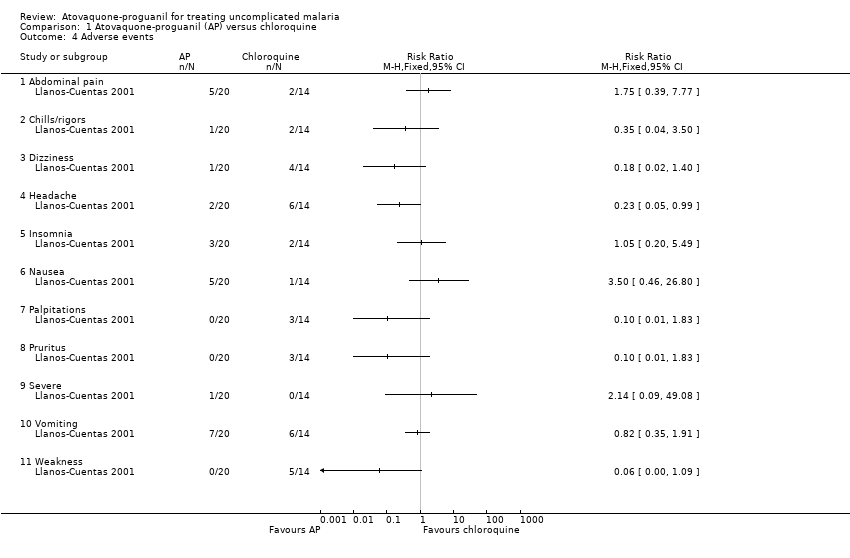
Comparison 1 Atovaquone‐proguanil (AP) versus chloroquine, Outcome 4 Adverse events.

Comparison 2 Atovaquone‐proguanil (AP) versus amodiaquine, Outcome 1 Treatment failure on or by day 28.
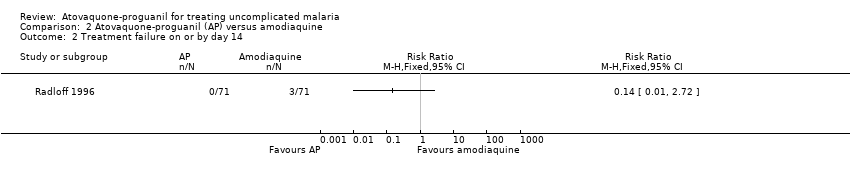
Comparison 2 Atovaquone‐proguanil (AP) versus amodiaquine, Outcome 2 Treatment failure on or by day 14.

Comparison 2 Atovaquone‐proguanil (AP) versus amodiaquine, Outcome 3 Parasite clearance time (mean; h).

Comparison 2 Atovaquone‐proguanil (AP) versus amodiaquine, Outcome 4 Fever clearance time (mean; h).
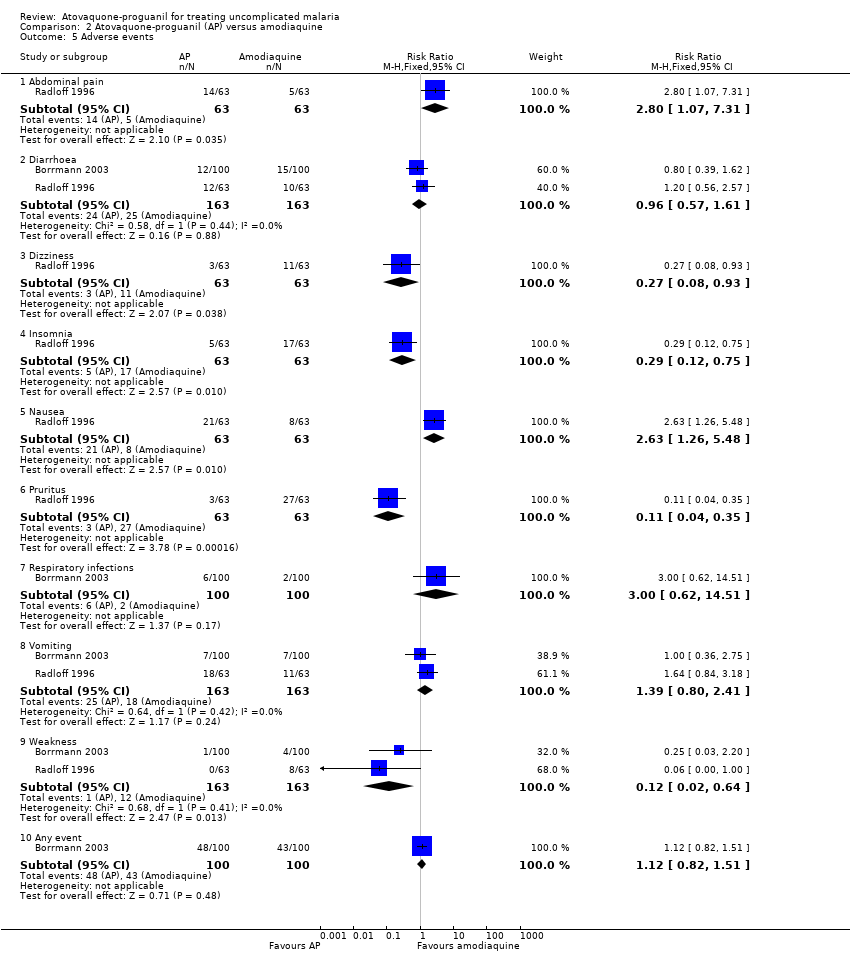
Comparison 2 Atovaquone‐proguanil (AP) versus amodiaquine, Outcome 5 Adverse events.
Comparison 3 Atovaquone‐proguanil (AP) versus sulfadoxine‐pyrimethamine (SP), Outcome 1 Treatment failure on or by day 28.

Comparison 3 Atovaquone‐proguanil (AP) versus sulfadoxine‐pyrimethamine (SP), Outcome 2 Parasite clearance time (mean; h).
Comparison 3 Atovaquone‐proguanil (AP) versus sulfadoxine‐pyrimethamine (SP), Outcome 3 Fever clearance time (mean; h).

Comparison 3 Atovaquone‐proguanil (AP) versus sulfadoxine‐pyrimethamine (SP), Outcome 4 Progression to severe disease.

Comparison 3 Atovaquone‐proguanil (AP) versus sulfadoxine‐pyrimethamine (SP), Outcome 5 Adverse events.

Comparison 4 Atovaquone‐proguanil (AP) versus quinine plus tetracycline (Q plus T), Outcome 1 Treatment failure on or by day 28.

Comparison 4 Atovaquone‐proguanil (AP) versus quinine plus tetracycline (Q plus T), Outcome 2 Parasite clearance time (mean; h).
Comparison 4 Atovaquone‐proguanil (AP) versus quinine plus tetracycline (Q plus T), Outcome 3 Fever clearance time (mean; h).
Comparison 4 Atovaquone‐proguanil (AP) versus quinine plus tetracycline (Q plus T), Outcome 4 Adverse events.

Comparison 5 Atovaquone‐proguanil (AP) versus halofantrine, Outcome 1 Treatment failure on or by day 28.

Comparison 5 Atovaquone‐proguanil (AP) versus halofantrine, Outcome 2 Parasite clearance time (mean; h).
Comparison 5 Atovaquone‐proguanil (AP) versus halofantrine, Outcome 3 Fever clearance time (mean; h).

Comparison 5 Atovaquone‐proguanil (AP) versus halofantrine, Outcome 4 Adverse events.

Comparison 6 Atovaquone‐proguanil (AP) versus mefloquine, Outcome 1 Treatment failure on or by day 28.

Comparison 6 Atovaquone‐proguanil (AP) versus mefloquine, Outcome 2 Parasite clearance time (mean; h).
Comparison 6 Atovaquone‐proguanil (AP) versus mefloquine, Outcome 3 Fever clearance time (mean; h).
Comparison 6 Atovaquone‐proguanil (AP) versus mefloquine, Outcome 4 Adverse events.
Comparison 7 Atovaquone‐proguanil (AP) versus artesunate plus mefloquine (AS plus MQ), Outcome 1 Treatment failure on or by day 14.

Comparison 7 Atovaquone‐proguanil (AP) versus artesunate plus mefloquine (AS plus MQ), Outcome 2 Treatment failure on or by day 28 adjusted by PCR.

Comparison 7 Atovaquone‐proguanil (AP) versus artesunate plus mefloquine (AS plus MQ), Outcome 3 Adverse events.

Comparison 8 Atovaquone‐proguanil (AP) versus dihydroartemisinin, piperaquine, trimethoprim, and primaquine (CV8), Outcome 1 Treatment failure on or by day 28.
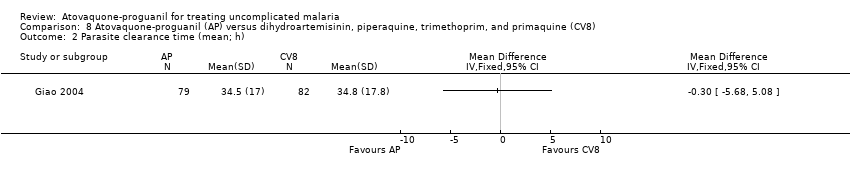
Comparison 8 Atovaquone‐proguanil (AP) versus dihydroartemisinin, piperaquine, trimethoprim, and primaquine (CV8), Outcome 2 Parasite clearance time (mean; h).

Comparison 8 Atovaquone‐proguanil (AP) versus dihydroartemisinin, piperaquine, trimethoprim, and primaquine (CV8), Outcome 3 Fever clearance time (mean; h).
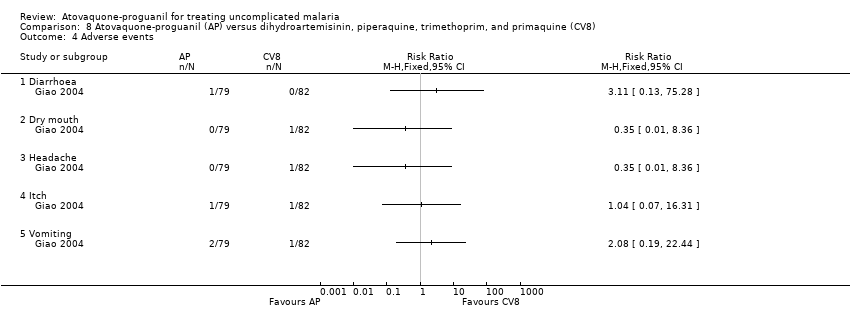
Comparison 8 Atovaquone‐proguanil (AP) versus dihydroartemisinin, piperaquine, trimethoprim, and primaquine (CV8), Outcome 4 Adverse events.
| Trial | Allocation sequence generation | Allocation concealment | Blinding | Inclusiona |
| Unclear | Unclear | None | Adequate | |
| Adequate | Adequate | None | Inadequate | |
| Unclear | Unclear | None | Inadequate | |
| Unclear | Unclear | None | Inadequate | |
| Adequate | Adequate | None | Adequate | |
| Unclear | Unclear | None | Adequate | |
| Unclear | Unclear | None | Inadequate | |
| Unclear | Unclear | None | Adequate | |
| Adequate | Unclear | None | Inadequate | |
| Adequate | Adequate | None | Adequate | |
| aSee the 'Characteristics of included studies' for details. | ||||
| Outcome or subgroup title | No. of studies | No. of participants | Statistical method | Effect size |
| 1 Treatment failure on or by day 28 Show forest plot | 1 | Risk Ratio (M‐H, Fixed, 95% CI) | Totals not selected | |
| 2 Parasite clearance time (mean; h) Show forest plot | 1 | Mean Difference (IV, Fixed, 95% CI) | Totals not selected | |
| 3 Fever clearance time (mean; h) Show forest plot | 1 | Mean Difference (IV, Fixed, 95% CI) | Totals not selected | |
| 4 Adverse events Show forest plot | 1 | Risk Ratio (M‐H, Fixed, 95% CI) | Totals not selected | |
| 4.1 Abdominal pain | 1 | Risk Ratio (M‐H, Fixed, 95% CI) | 0.0 [0.0, 0.0] | |
| 4.2 Chills/rigors | 1 | Risk Ratio (M‐H, Fixed, 95% CI) | 0.0 [0.0, 0.0] | |
| 4.3 Dizziness | 1 | Risk Ratio (M‐H, Fixed, 95% CI) | 0.0 [0.0, 0.0] | |
| 4.4 Headache | 1 | Risk Ratio (M‐H, Fixed, 95% CI) | 0.0 [0.0, 0.0] | |
| 4.5 Insomnia | 1 | Risk Ratio (M‐H, Fixed, 95% CI) | 0.0 [0.0, 0.0] | |
| 4.6 Nausea | 1 | Risk Ratio (M‐H, Fixed, 95% CI) | 0.0 [0.0, 0.0] | |
| 4.7 Palpitations | 1 | Risk Ratio (M‐H, Fixed, 95% CI) | 0.0 [0.0, 0.0] | |
| 4.8 Pruritus | 1 | Risk Ratio (M‐H, Fixed, 95% CI) | 0.0 [0.0, 0.0] | |
| 4.9 Severe | 1 | Risk Ratio (M‐H, Fixed, 95% CI) | 0.0 [0.0, 0.0] | |
| 4.10 Vomiting | 1 | Risk Ratio (M‐H, Fixed, 95% CI) | 0.0 [0.0, 0.0] | |
| 4.11 Weakness | 1 | Risk Ratio (M‐H, Fixed, 95% CI) | 0.0 [0.0, 0.0] | |
| Outcome or subgroup title | No. of studies | No. of participants | Statistical method | Effect size |
| 1 Treatment failure on or by day 28 Show forest plot | 2 | 342 | Risk Ratio (M‐H, Fixed, 95% CI) | 0.22 [0.13, 0.36] |
| 2 Treatment failure on or by day 14 Show forest plot | 1 | Risk Ratio (M‐H, Fixed, 95% CI) | Totals not selected | |
| 3 Parasite clearance time (mean; h) Show forest plot | 1 | Mean Difference (IV, Fixed, 95% CI) | Totals not selected | |
| 4 Fever clearance time (mean; h) Show forest plot | 1 | Mean Difference (IV, Fixed, 95% CI) | Totals not selected | |
| 5 Adverse events Show forest plot | 2 | Risk Ratio (M‐H, Fixed, 95% CI) | Subtotals only | |
| 5.1 Abdominal pain | 1 | 126 | Risk Ratio (M‐H, Fixed, 95% CI) | 2.8 [1.07, 7.31] |
| 5.2 Diarrhoea | 2 | 326 | Risk Ratio (M‐H, Fixed, 95% CI) | 0.96 [0.57, 1.61] |
| 5.3 Dizziness | 1 | 126 | Risk Ratio (M‐H, Fixed, 95% CI) | 0.27 [0.08, 0.93] |
| 5.4 Insomnia | 1 | 126 | Risk Ratio (M‐H, Fixed, 95% CI) | 0.29 [0.12, 0.75] |
| 5.5 Nausea | 1 | 126 | Risk Ratio (M‐H, Fixed, 95% CI) | 2.63 [1.26, 5.48] |
| 5.6 Pruritus | 1 | 126 | Risk Ratio (M‐H, Fixed, 95% CI) | 0.11 [0.04, 0.35] |
| 5.7 Respiratory infections | 1 | 200 | Risk Ratio (M‐H, Fixed, 95% CI) | 3.0 [0.62, 14.51] |
| 5.8 Vomiting | 2 | 326 | Risk Ratio (M‐H, Fixed, 95% CI) | 1.39 [0.80, 2.41] |
| 5.9 Weakness | 2 | 326 | Risk Ratio (M‐H, Fixed, 95% CI) | 0.12 [0.02, 0.64] |
| 5.10 Any event | 1 | 200 | Risk Ratio (M‐H, Fixed, 95% CI) | 1.12 [0.82, 1.51] |
| Outcome or subgroup title | No. of studies | No. of participants | Statistical method | Effect size |
| 1 Treatment failure on or by day 28 Show forest plot | 2 | Risk Ratio (M‐H, Fixed, 95% CI) | Totals not selected | |
| 2 Parasite clearance time (mean; h) Show forest plot | 2 | 174 | Mean Difference (IV, Fixed, 95% CI) | 11.23 [5.43, 17.03] |
| 3 Fever clearance time (mean; h) Show forest plot | 2 | 156 | Mean Difference (IV, Fixed, 95% CI) | ‐13.73 [‐21.31, ‐6.16] |
| 4 Progression to severe disease Show forest plot | 1 | Risk Ratio (M‐H, Fixed, 95% CI) | Totals not selected | |
| 5 Adverse events Show forest plot | 2 | Risk Ratio (M‐H, Fixed, 95% CI) | Subtotals only | |
| 5.1 Abdominal pain | 2 | 189 | Risk Ratio (M‐H, Fixed, 95% CI) | 0.85 [0.58, 1.24] |
| 5.2 Chills/rigors | 1 | 29 | Risk Ratio (M‐H, Fixed, 95% CI) | 1.43 [0.06, 32.05] |
| 5.3 Diarrhoea | 1 | 160 | Risk Ratio (M‐H, Fixed, 95% CI) | 43.0 [2.65, 697.91] |
| 5.4 Dizziness | 1 | 29 | Risk Ratio (M‐H, Fixed, 95% CI) | 1.43 [0.06, 32.05] |
| 5.5 Headache | 2 | 189 | Risk Ratio (M‐H, Fixed, 95% CI) | 1.17 [0.81, 1.67] |
| 5.6 Insomnia | 1 | 29 | Risk Ratio (M‐H, Fixed, 95% CI) | 0.34 [0.09, 1.21] |
| 5.7 Nausea | 1 | 29 | Risk Ratio (M‐H, Fixed, 95% CI) | 2.25 [0.31, 16.59] |
| 5.8 Orthostatic hypotension | 1 | 160 | Risk Ratio (M‐H, Fixed, 95% CI) | 0.03 [0.00, 0.57] |
| 5.9 Pruritus | 1 | 29 | Risk Ratio (M‐H, Fixed, 95% CI) | 0.16 [0.01, 3.56] |
| 5.10 Raised liver enzymes | 1 | 160 | Risk Ratio (M‐H, Fixed, 95% CI) | 0.67 [0.25, 1.79] |
| 5.11 Severe | 1 | 29 | Risk Ratio (M‐H, Fixed, 95% CI) | 1.43 [0.06, 32.05] |
| 5.12 Vomiting | 2 | 189 | Risk Ratio (M‐H, Fixed, 95% CI) | 0.97 [0.50, 1.90] |
| 5.13 Weakness | 2 | 189 | Risk Ratio (M‐H, Fixed, 95% CI) | 1.47 [0.82, 2.62] |
| Outcome or subgroup title | No. of studies | No. of participants | Statistical method | Effect size |
| 1 Treatment failure on or by day 28 Show forest plot | 1 | Risk Ratio (M‐H, Fixed, 95% CI) | Totals not selected | |
| 2 Parasite clearance time (mean; h) Show forest plot | 1 | Mean Difference (IV, Fixed, 95% CI) | Totals not selected | |
| 3 Fever clearance time (mean; h) Show forest plot | 1 | Mean Difference (IV, Fixed, 95% CI) | Totals not selected | |
| 4 Adverse events Show forest plot | 1 | Risk Ratio (M‐H, Fixed, 95% CI) | Totals not selected | |
| 4.1 Abdominal pain | 1 | Risk Ratio (M‐H, Fixed, 95% CI) | 0.0 [0.0, 0.0] | |
| 4.2 Anorexia | 1 | Risk Ratio (M‐H, Fixed, 95% CI) | 0.0 [0.0, 0.0] | |
| 4.3 Diarrhoea | 1 | Risk Ratio (M‐H, Fixed, 95% CI) | 0.0 [0.0, 0.0] | |
| 4.4 Dizziness | 1 | Risk Ratio (M‐H, Fixed, 95% CI) | 0.0 [0.0, 0.0] | |
| 4.5 Headache | 1 | Risk Ratio (M‐H, Fixed, 95% CI) | 0.0 [0.0, 0.0] | |
| 4.6 Nausea | 1 | Risk Ratio (M‐H, Fixed, 95% CI) | 0.0 [0.0, 0.0] | |
| 4.7 Pruritus | 1 | Risk Ratio (M‐H, Fixed, 95% CI) | 0.0 [0.0, 0.0] | |
| 4.8 Tinnitus | 1 | Risk Ratio (M‐H, Fixed, 95% CI) | 0.0 [0.0, 0.0] | |
| 4.9 Vomiting | 1 | Risk Ratio (M‐H, Fixed, 95% CI) | 0.0 [0.0, 0.0] | |
| 4.10 Weakness | 1 | Risk Ratio (M‐H, Fixed, 95% CI) | 0.0 [0.0, 0.0] | |
| Outcome or subgroup title | No. of studies | No. of participants | Statistical method | Effect size |
| 1 Treatment failure on or by day 28 Show forest plot | 2 | Risk Ratio (M‐H, Fixed, 95% CI) | Totals not selected | |
| 2 Parasite clearance time (mean; h) Show forest plot | 2 | 205 | Mean Difference (IV, Fixed, 95% CI) | 14.76 [10.41, 19.10] |
| 3 Fever clearance time (mean; h) Show forest plot | 2 | 205 | Mean Difference (IV, Fixed, 95% CI) | ‐1.70 [‐9.41, 6.02] |
| 4 Adverse events Show forest plot | 2 | Risk Ratio (M‐H, Random, 95% CI) | Subtotals only | |
| 4.1 Abdominal pain | 2 | 216 | Risk Ratio (M‐H, Random, 95% CI) | 0.81 [0.14, 4.68] |
| 4.2 Chills/Rigors | 1 | 168 | Risk Ratio (M‐H, Random, 95% CI) | 0.67 [0.11, 3.89] |
| 4.3 Cough | 1 | 168 | Risk Ratio (M‐H, Random, 95% CI) | 0.71 [0.34, 1.52] |
| 4.4 Diarrhoea | 2 | 216 | Risk Ratio (M‐H, Random, 95% CI) | 0.57 [0.23, 1.39] |
| 4.5 Headache | 2 | 216 | Risk Ratio (M‐H, Random, 95% CI) | 1.09 [0.17, 6.84] |
| 4.6 Insomnia | 2 | 216 | Risk Ratio (M‐H, Random, 95% CI) | 0.62 [0.15, 2.60] |
| 4.7 Moderate or severe | 1 | 168 | Risk Ratio (M‐H, Random, 95% CI) | 0.38 [0.15, 0.91] |
| 4.8 Myalgia | 1 | 168 | Risk Ratio (M‐H, Random, 95% CI) | 0.14 [0.01, 2.72] |
| 4.9 Nausea | 1 | 48 | Risk Ratio (M‐H, Random, 95% CI) | 2.76 [0.62, 12.33] |
| 4.10 Palpitations | 1 | 168 | Risk Ratio (M‐H, Random, 95% CI) | 0.5 [0.05, 5.41] |
| 4.11 Pruritus | 2 | 216 | Risk Ratio (M‐H, Random, 95% CI) | 1.20 [0.51, 2.87] |
| 4.12 Vomiting | 2 | 216 | Risk Ratio (M‐H, Random, 95% CI) | 3.47 [0.66, 18.43] |
| 4.13 Weakness | 1 | 168 | Risk Ratio (M‐H, Random, 95% CI) | 0.25 [0.03, 2.19] |
| Outcome or subgroup title | No. of studies | No. of participants | Statistical method | Effect size |
| 1 Treatment failure on or by day 28 Show forest plot | 1 | Risk Ratio (M‐H, Fixed, 95% CI) | Totals not selected | |
| 2 Parasite clearance time (mean; h) Show forest plot | 1 | Mean Difference (IV, Fixed, 95% CI) | Totals not selected | |
| 3 Fever clearance time (mean; h) Show forest plot | 1 | Mean Difference (IV, Fixed, 95% CI) | Totals not selected | |
| 4 Adverse events Show forest plot | 1 | Risk Ratio (M‐H, Fixed, 95% CI) | Totals not selected | |
| 4.1 Abdominal pain | 1 | Risk Ratio (M‐H, Fixed, 95% CI) | 0.0 [0.0, 0.0] | |
| 4.2 Anaemia | 1 | Risk Ratio (M‐H, Fixed, 95% CI) | 0.0 [0.0, 0.0] | |
| 4.3 Diarrhoea | 1 | Risk Ratio (M‐H, Fixed, 95% CI) | 0.0 [0.0, 0.0] | |
| 4.4 Dizziness | 1 | Risk Ratio (M‐H, Fixed, 95% CI) | 0.0 [0.0, 0.0] | |
| 4.5 Headache | 1 | Risk Ratio (M‐H, Fixed, 95% CI) | 0.0 [0.0, 0.0] | |
| 4.6 Insomnia | 1 | Risk Ratio (M‐H, Fixed, 95% CI) | 0.0 [0.0, 0.0] | |
| 4.7 Nausea | 1 | Risk Ratio (M‐H, Fixed, 95% CI) | 0.0 [0.0, 0.0] | |
| 4.8 Raised liver enzymes | 1 | Risk Ratio (M‐H, Fixed, 95% CI) | 0.0 [0.0, 0.0] | |
| 4.9 Sore throat | 1 | Risk Ratio (M‐H, Fixed, 95% CI) | 0.0 [0.0, 0.0] | |
| 4.10 Vomiting | 1 | Risk Ratio (M‐H, Fixed, 95% CI) | 0.0 [0.0, 0.0] | |
| 4.11 Any event | 1 | Risk Ratio (M‐H, Fixed, 95% CI) | 0.0 [0.0, 0.0] | |
| Outcome or subgroup title | No. of studies | No. of participants | Statistical method | Effect size |
| 1 Treatment failure on or by day 14 Show forest plot | 1 | Risk Ratio (M‐H, Fixed, 95% CI) | Totals not selected | |
| 2 Treatment failure on or by day 28 adjusted by PCR Show forest plot | 1 | Risk Ratio (M‐H, Fixed, 95% CI) | Totals not selected | |
| 3 Adverse events Show forest plot | 1 | Risk Ratio (M‐H, Fixed, 95% CI) | Totals not selected | |
| 3.1 Anorexia | 1 | Risk Ratio (M‐H, Fixed, 95% CI) | 0.0 [0.0, 0.0] | |
| 3.2 Dizziness | 1 | Risk Ratio (M‐H, Fixed, 95% CI) | 0.0 [0.0, 0.0] | |
| 3.3 Nausea | 1 | Risk Ratio (M‐H, Fixed, 95% CI) | 0.0 [0.0, 0.0] | |
| 3.4 Palpitations | 1 | Risk Ratio (M‐H, Fixed, 95% CI) | 0.0 [0.0, 0.0] | |
| 3.5 Skin rash | 1 | Risk Ratio (M‐H, Fixed, 95% CI) | 0.0 [0.0, 0.0] | |
| 3.6 Sleeping disorders | 1 | Risk Ratio (M‐H, Fixed, 95% CI) | 0.0 [0.0, 0.0] | |
| 3.7 Tremor | 1 | Risk Ratio (M‐H, Fixed, 95% CI) | 0.0 [0.0, 0.0] | |
| 3.8 Vomiting | 1 | Risk Ratio (M‐H, Fixed, 95% CI) | 0.0 [0.0, 0.0] | |
| Outcome or subgroup title | No. of studies | No. of participants | Statistical method | Effect size |
| 1 Treatment failure on or by day 28 Show forest plot | 1 | Risk Ratio (M‐H, Fixed, 95% CI) | Totals not selected | |
| 2 Parasite clearance time (mean; h) Show forest plot | 1 | Mean Difference (IV, Fixed, 95% CI) | Totals not selected | |
| 3 Fever clearance time (mean; h) Show forest plot | 1 | Mean Difference (IV, Fixed, 95% CI) | Totals not selected | |
| 4 Adverse events Show forest plot | 1 | Risk Ratio (M‐H, Fixed, 95% CI) | Totals not selected | |
| 4.1 Diarrhoea | 1 | Risk Ratio (M‐H, Fixed, 95% CI) | 0.0 [0.0, 0.0] | |
| 4.2 Dry mouth | 1 | Risk Ratio (M‐H, Fixed, 95% CI) | 0.0 [0.0, 0.0] | |
| 4.3 Headache | 1 | Risk Ratio (M‐H, Fixed, 95% CI) | 0.0 [0.0, 0.0] | |
| 4.4 Itch | 1 | Risk Ratio (M‐H, Fixed, 95% CI) | 0.0 [0.0, 0.0] | |
| 4.5 Vomiting | 1 | Risk Ratio (M‐H, Fixed, 95% CI) | 0.0 [0.0, 0.0] | |