Scolaris Content Display Scolaris Content Display

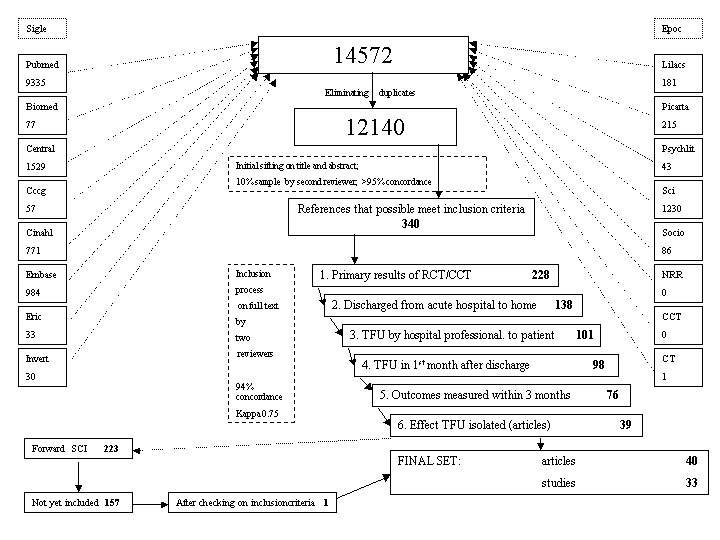
Figure 1: Inclusion Process
Figuras y tablas -
Figure 1

Figure 1: Inclusion Process

Comparison 1 Effect of TFU on anxiety in cardiac surgery patients at appr. 1 month after discharge compared to usual care, Outcome 1 Effect of TFU on anxiety in cardiac surgery patients at appr. 1 month after discharge compared to usual care.
Figuras y tablas -
Analysis 1.1

Comparison 1 Effect of TFU on anxiety in cardiac surgery patients at appr. 1 month after discharge compared to usual care, Outcome 1 Effect of TFU on anxiety in cardiac surgery patients at appr. 1 month after discharge compared to usual care.

Comparison 2 Effect of TFU on compliance, Outcome 1 Effect of TFU on compliance in cardiac surgery patients compared to usual care.
Figuras y tablas -
Analysis 2.1

Comparison 2 Effect of TFU on compliance, Outcome 1 Effect of TFU on compliance in cardiac surgery patients compared to usual care.

Comparison 2 Effect of TFU on compliance, Outcome 2 Effect of TFU on compliance (making an appointment) in ED patients compared to usual care.
Figuras y tablas -
Analysis 2.2

Comparison 2 Effect of TFU on compliance, Outcome 2 Effect of TFU on compliance (making an appointment) in ED patients compared to usual care.

Comparison 2 Effect of TFU on compliance, Outcome 3 Effect of TFU on compliance (keeping an appointment) in ED patients compared to usual care.
Figuras y tablas -
Analysis 2.3

Comparison 2 Effect of TFU on compliance, Outcome 3 Effect of TFU on compliance (keeping an appointment) in ED patients compared to usual care.

Comparison 3 Effect of TFU on knowledge in cardiac patients compared to control condition, Outcome 1 Effect of TFU on knowledge in cardiac patients at around 6 weeks post discharge compared to control condition.
Figuras y tablas -
Analysis 3.1

Comparison 3 Effect of TFU on knowledge in cardiac patients compared to control condition, Outcome 1 Effect of TFU on knowledge in cardiac patients at around 6 weeks post discharge compared to control condition.

Comparison 4 Effect of TFU on readmissions, Outcome 1 Effect of TFU on readmissions in cardiac patients compared to usual care.
Figuras y tablas -
Analysis 4.1

Comparison 4 Effect of TFU on readmissions, Outcome 1 Effect of TFU on readmissions in cardiac patients compared to usual care.

Comparison 4 Effect of TFU on readmissions, Outcome 2 Effect of TFU on readmissions in surgery patients compared to control condition.
Figuras y tablas -
Analysis 4.2

Comparison 4 Effect of TFU on readmissions, Outcome 2 Effect of TFU on readmissions in surgery patients compared to control condition.

Comparison 5 Effect of TFU on ED visits in surgery patients compared to control condition, Outcome 1 Effect of TFU on ED visits in surgery patients compared to control condition.
Figuras y tablas -
Analysis 5.1

Comparison 5 Effect of TFU on ED visits in surgery patients compared to control condition, Outcome 1 Effect of TFU on ED visits in surgery patients compared to control condition.

Table 1. Outcome/patient combinations for which pooling was considered

Outcome category

Cardiac patients

Surgery patients

ED patients

Paediatric patients

Neurology patients

PSYCHO‐SOCIAL HEALTH OUTCOMES

‐anxiety

3

3

‐satisfaction

5

6

‐depression

2

2

OTHER CONSUMER ORIENTED OUTCOMES

‐compliance

2

2

4

3

‐knowledge

3

2

HEALTH SERVICES ORIENTED OUTCOMES

‐readmissions

4

5

2

‐ED‐visits

2

3

Figuras y tablas -
Table 1. Outcome/patient combinations for which pooling was considered
Comparison 1. Effect of TFU on anxiety in cardiac surgery patients at appr. 1 month after discharge compared to usual care

Outcome or subgroup title

No. of studies

No. of participants

Statistical method

Effect size

1 Effect of TFU on anxiety in cardiac surgery patients at appr. 1 month after discharge compared to usual care Show forest plot

3

278

Std. Mean Difference (IV, Random, 95% CI)

‐0.47 [‐1.28, 0.34]

Figuras y tablas -
Comparison 1. Effect of TFU on anxiety in cardiac surgery patients at appr. 1 month after discharge compared to usual care
Comparison 2. Effect of TFU on compliance

Outcome or subgroup title

No. of studies

No. of participants

Statistical method

Effect size

1 Effect of TFU on compliance in cardiac surgery patients compared to usual care Show forest plot

2

102

Risk Ratio (M‐H, Random, 95% CI)

1.68 [0.59, 4.78]

2 Effect of TFU on compliance (making an appointment) in ED patients compared to usual care Show forest plot

3

1039

Risk Ratio (M‐H, Random, 95% CI)

1.70 [0.92, 3.14]

3 Effect of TFU on compliance (keeping an appointment) in ED patients compared to usual care Show forest plot

3

820

Risk Ratio (M‐H, Random, 95% CI)

1.58 [1.01, 2.48]

Figuras y tablas -
Comparison 2. Effect of TFU on compliance
Comparison 3. Effect of TFU on knowledge in cardiac patients compared to control condition

Outcome or subgroup title

No. of studies

No. of participants

Statistical method

Effect size

1 Effect of TFU on knowledge in cardiac patients at around 6 weeks post discharge compared to control condition Show forest plot

3

185

Std. Mean Difference (IV, Random, 95% CI)

1.44 [‐0.25, 3.13]

Figuras y tablas -
Comparison 3. Effect of TFU on knowledge in cardiac patients compared to control condition
Comparison 4. Effect of TFU on readmissions

Outcome or subgroup title

No. of studies

No. of participants

Statistical method

Effect size

1 Effect of TFU on readmissions in cardiac patients compared to usual care Show forest plot

3

616

Risk Ratio (M‐H, Random, 95% CI)

0.75 [0.41, 1.36]

2 Effect of TFU on readmissions in surgery patients compared to control condition Show forest plot

4

460

Risk Ratio (M‐H, Random, 95% CI)

0.65 [0.28, 1.55]

Figuras y tablas -
Comparison 4. Effect of TFU on readmissions
Comparison 5. Effect of TFU on ED visits in surgery patients compared to control condition

Outcome or subgroup title

No. of studies

No. of participants

Statistical method

Effect size

1 Effect of TFU on ED visits in surgery patients compared to control condition Show forest plot

2

333

Risk Ratio (M‐H, Random, 95% CI)

1.47 [0.85, 2.53]

Figuras y tablas -
Comparison 5. Effect of TFU on ED visits in surgery patients compared to control condition