| Outcome | Study ID | N | Reason | Conclusion |
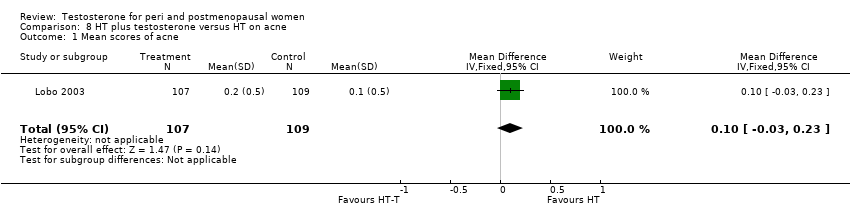
| Acne | Barrett‐Connor 1999 | 291 | The data was not available | Acne of mild or moderate severity was reported by 5 (3%) estrogen‐testosterone treated participants, whereas no participants receiving oestrogen reported acne |
| Biochemical Markers of bone metabolism | Floter 2002b (Floter 2005) | 50 | A crossover study with no washout period | Both treatments had similar effects, with a significant decrease in bone resorption (ICTP) and bone turnover (osteocalcin) after 24 weeks.
A 12% reduction in PICP during HT treatment was reversed by the addition of testosterone, and no significant decline was recorded during T‐HT treatment |
| Biochemical markers of bone metabolism | Miller 2000 | 57 | The data was likely to be skewed because the means were smaller than twice the SDs | There were no between group differences noted in baseline Dpd levels(p=0.111), Dpd% change (P=0.338), baseline NTx levels (P=0.112), or NTx % change (P=0.271) |
| Biochemical markers of bone metabolism | Raisz 1996 | 28 | The data was not available | The effects of oestrogen‐testosterone and oestrogen alone on markers of bone resorption were generally similar. The increase in bone formation markers after oestrogen‐testosterone treatment was significantly different from the effect of oestrogen for all bone formation parameters. |
| Bone mineral density of lumbar spine and femur | Barrett‐Connor 1999 | 199 | The data was not available | BMD increased in the estrogen‐testosterone(low dose) were comparable to those in the oestrogen(low dose) group, while the BMD changes at 24 months in the estrogen‐testosterone(high dose) group significantly exceeded those in oestrogen(high dose) group(P=0.014 for lumbar spine, BMD and P=0.009 for total hip BMD) |
| Bone mineral density | Floter 2002b (Floter 2005) | 50 | A crossover study with no washout period. | No changes in BMD were noted in the total body, hip, or lumbar spine with either regimen |
| Bone mineral density | Garnett 1992 | 50 | The data was not available. | There was no significant differences in bone density at any of the sites measured between women receiving oestrogen alone and those receiving estrogen‐testosterone. No treated subjects had a significant bone loss(more than twice the measurement precision) at either spine or femoral neck at 1 year, but three in each treated group showed a small but non significant decrease at both sites |
| Bone mineral density of L1‐L4, femur and forearm | Watts 1995 | 48 | The data was not available | The estrogen‐testosterone showed significant increases in spinal BMD at 12 and 24 months(P<0.01). The estrogen group demonstrated a non significant increase in spinal BMD. The difference between groups was not significant at 12 or 24 months. There were no significant changes in BMD from baseline in either group at the radius, femoral neck, Ward triangle, or greater trochanter |
| Body composition | Dobs 2002 | 40 | It was unclear with regard to the standard deviation (SD) of the data | ‐ When compared with oestrogen alone, estrogen‐testosterone treatment significantly increased lean body mass in the arms, legs, and trunk. Body fat percentage decreased significantly from baseline in the same arms, legs, and trunk in the oestrogen‐testosterone group but not the oestrogen alone group. When changes in arms, legs, and trunk in each participant were analysed simultaneously, the difference between treatments was significant for lean body mass(P=0.007) and percentage of fat tissue(P=0.077) |
| Body composition | Floter 2002b (Floter 2005) | 50 | A crossover study with no washout period | There was no significant differences in total body fat, total lean body mass, trunk fat, and trunk lean mass between the two treatments |
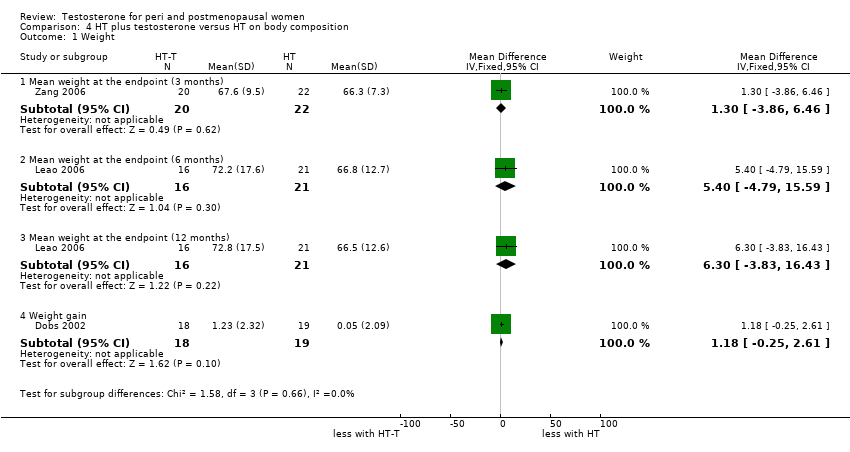
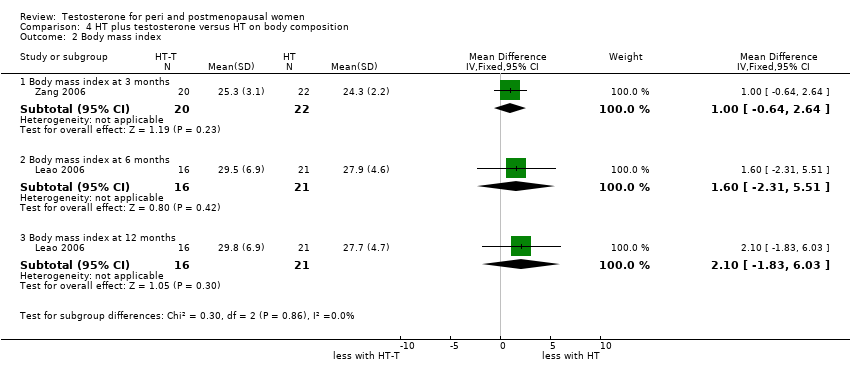
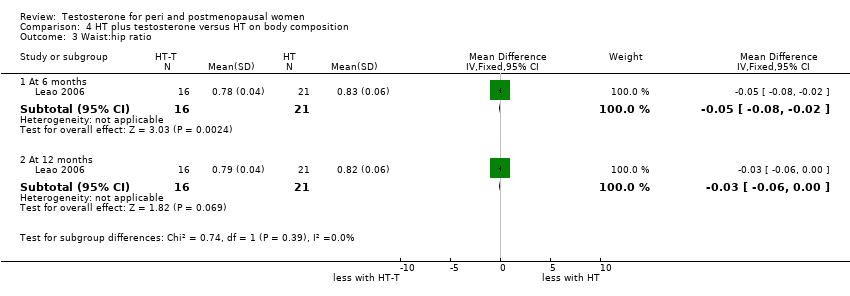
| Body composition | Leao 2006 | 37 | The data was likely to be skewed | When compared to HT alone, T‐HT treatment significantly increased visceral fat area (P = 0.009). However there was no significant difference in subcutaneous fat area between the two groups |
| Cognition and psychological well being | Regestein 2001 | 42 | A crossover study with no washout period | Switching Attention Test that mean reaction time in the switching condition was faster in the estrogen‐testosterone group than in the estrogen group(t=3.25, df=37, P<0.002, effect size = 0.53 SD). For other conditions of the same test, such as side condition and direction condition, they did not differ between two groups.
There were no other effects of added methyltestosterone found on psychological, sleep, and exercise measures |
| Cognition | Sherwin 1988 | 49 | The data was not available | There was no comparative effects between oestrogen‐testosterone and oestrogen alone group.
The women treated with all hormone preparations were higher during both treatment phases compared to scores of women who received placebo (P<0.01) |
| Cognition | Shepanek 1999 | 30 | The data was likely to be skewed | No significant interactions were found showing an advantage for oestrogen‐testosterone treated group as contrasted to oestrogen‐treated group |
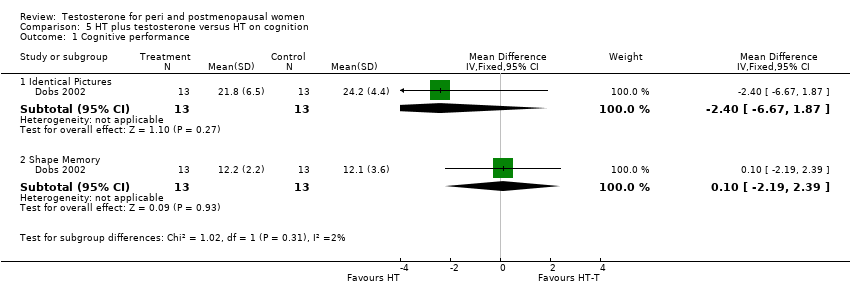
| Cognition (Cube Comparisons and Building Memory) | Dobs 2002(Wisniewski 2002) | 26 | The data was likely to be skewed | Differences in task performance between women receiving E or E‐T treatment were assessed with a 2‐factor(treatment group x test session), mixed analysis of variance for each cognitive task. Post hoc comparisons were conducted using Tukey's method of multiple comparisons. With regard to Cube Comparisons, performance improved for both groups across test sessions, however this improvement only approached statistical significance (P=0.09). No other effects were significant. Regarding Building Memory, a main effect of test session was observed, with performance declining across sessions for both groups(P<0.01). A treatment x test session interaction was observed(P<0.05). Post hoc comparison revealed that this effect was due to a decrease in the E group(P<0.05) but not The E‐T group(P>0.1) across sessions. |
| Hematocrit | Barrett‐Connor 1999 | 199 | The data was not available. | There was no clinically significant difference in haematology |
| Hematocrit | Floter 2002b | 50 | A cross‐over study with no washout period | They reported that there was no change in blood counts during the study |
| Hematocrit | Hickok 1993 | 26 | The data was not available. | ‐ At 6 months, statistically significant between‐group differences were seen for hematocrit. The difference was small in magnitude, remained within the normal ranges, and was not considered clinically significant. |
| Hematocrit | Shifren 2000 | 67 | A cross‐over study with no washout period | Transdermal testosterone treatment had no significant effects on blood counts |
| Hematocrit | Watts 1995 | 48 | The data were not available | No clinically significant changes in hematologic indices |
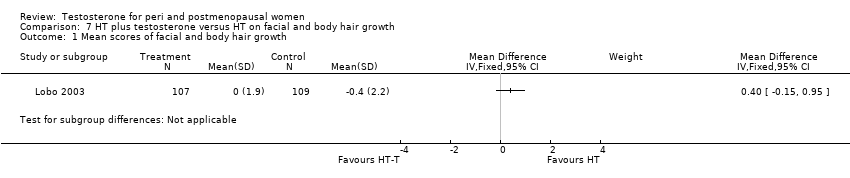
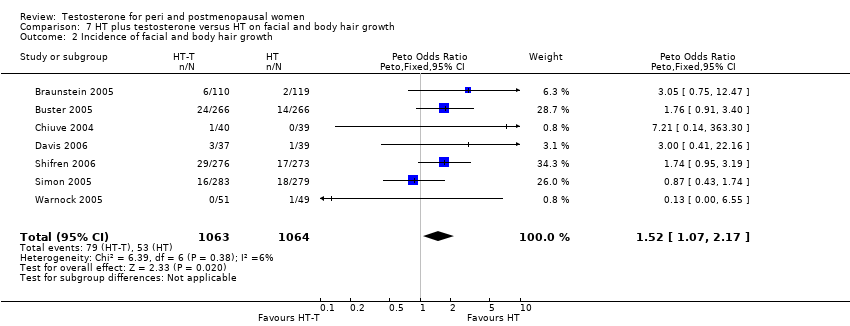
| Hirsutism | Barrett‐Connor 1999 | 199 | The data was not available | Changes in hair growth in the oestrogen‐testosterone(low dose) group were similar to those in the oestrogen(low dose) group, and there were no statistically significant differences in the hirsutism scores between the treatment groups. In the high‐dose groups only four participants treated with oestrogen‐testosterone and two treated with oestrogen reported hirsutism as an adverse event at month 12. At 24 months, 10 oestrogen‐testosterone‐treated and 3 oestrogen‐treated participants reported hirsutism as an adverse event |
| Hirsutism and acne | Floter 2002b | 50 | A crossover study with no washout period | Incidences of hirsutism and acne were similar in two treatment groups |
| Hirsutism and acne | Shifren 2000 | 67 | A crossover study with no washout period | The hirsutism and acne scores did not change significantly during treatment. The mean facial depilation rate increased slightly during treatment with estrogen‐testosterone 300 microgram |
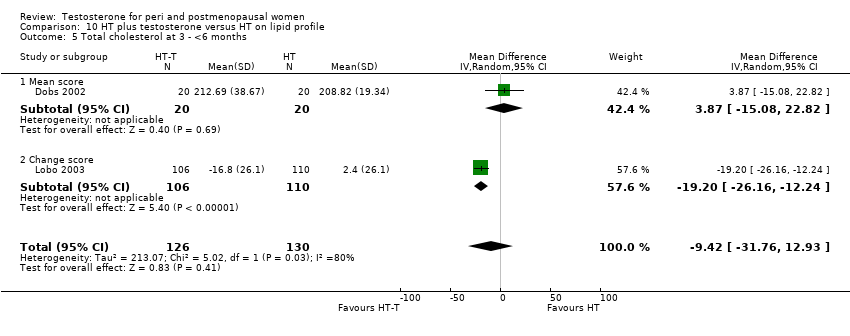
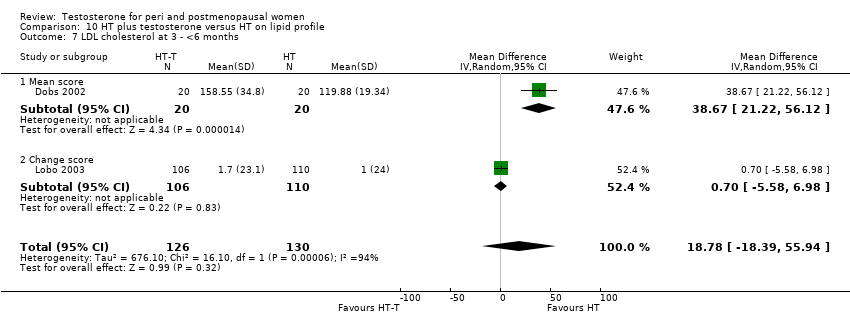
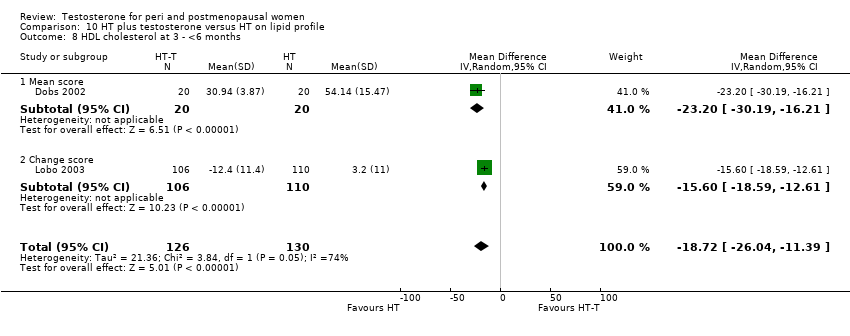
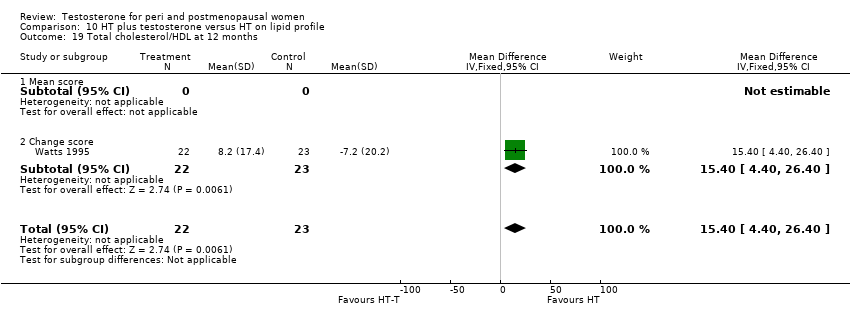
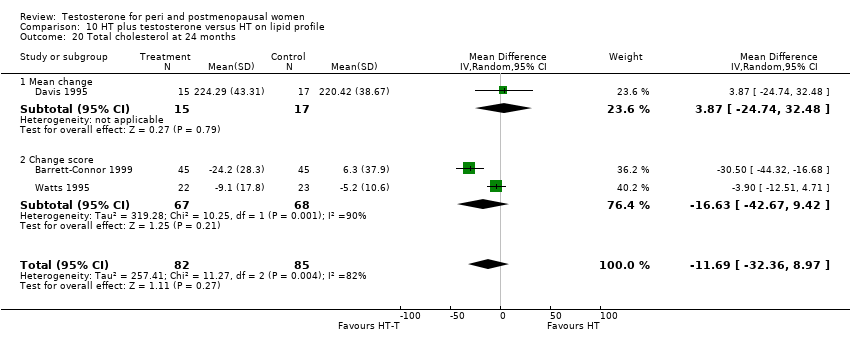
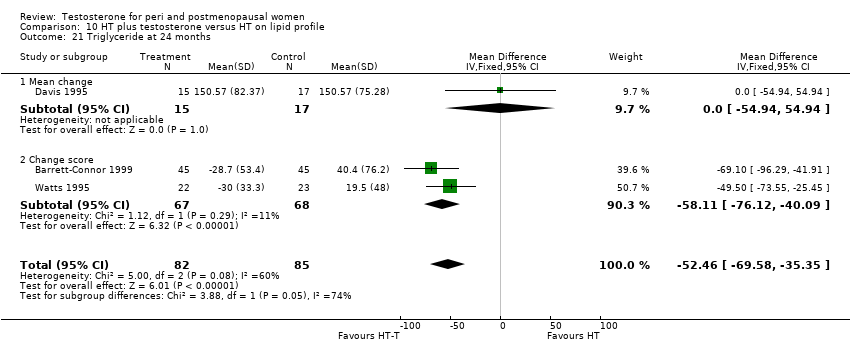
| Lipid profile | Dobs 2002 | 40 | The data was not available. | After 16 weeks of treatment, significant decreases in total cholesterol, HDL, and triglycerides occurred in the estrogen‐testosterone group. LDL values were virtually unchanged. The oestrogen group demonstrated the opposite effect on lipids, with a significant decrease in LDL and no meaningful change in the other lipid parameters |
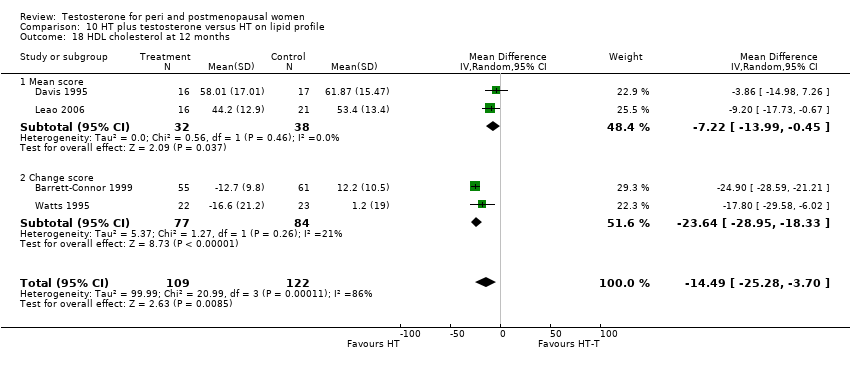
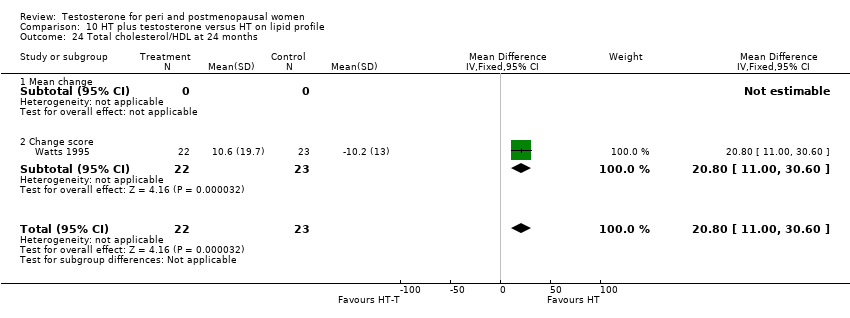
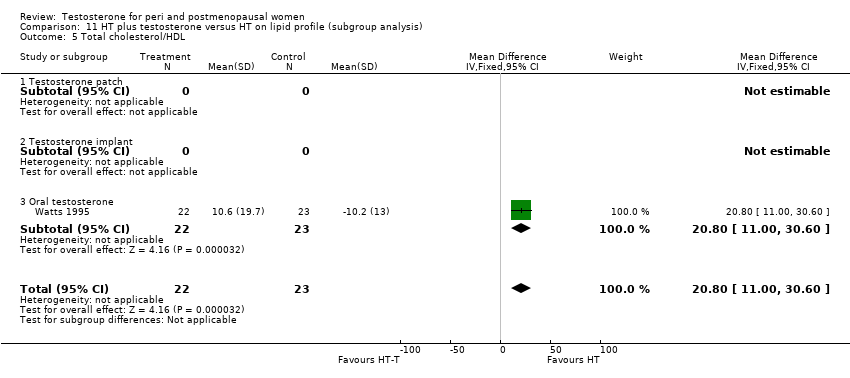
| Lipid profile | Dobs 2002 (Floter 2005) | 50 | A crossover study with no washout period | Serum levels of total testosterone increased markedly from a baseline mean of 0.8–4.9 mmol/l during testosterone addition. Total and LDL‐cholesterol levels were significantly reduced by both treatments as also were those of Lp‐(a) although the difference was not significant. A 13% reduction in HDL‐cholesterol levels was found when testosterone was added, but no change with oestrogen alone. Triglyceride levels were increased by oestrogen treatment, but not affected by the combination of oestrogen plus testosterone |
| Lipid profile | Miller 2000 (Luciano 1998a) | 56 | The data was not available | There were significant reductions in total cholesterol and LDL cholesterol in all groups. In estrogen‐testosterone‐treated group triglyceride levels increased 26.0% and HDL cholesterol levels decreased 9.0%. In contrast, with oestrogen therapy triglyceride levels decreased 9.0% and HDL cholesterol levels increased 9.0% |
| Lipid profile | Miller 2000 | 57 | The data was likely to be skewed because the means were smaller than twice the SDs | The study found significant reductions in total cholesterol and LDL cholesterol in all groups. Triglyceride levels increased 26.0% and HDL cholesterol levels decreased 9.0% in estrogen‐testosterone‐treated group. In contrast, with oestrogens therapy triglyceride levels decreased 9.0% and HDL cholesterol levels increased 9.0% |
| Lipid profile | Nathrost‐Boos 2006 | 60 | A crossover study with no washout period | Total cholesterol, triglycerides, HDL and LDL revealed no significant differences between any of the periods or groups |
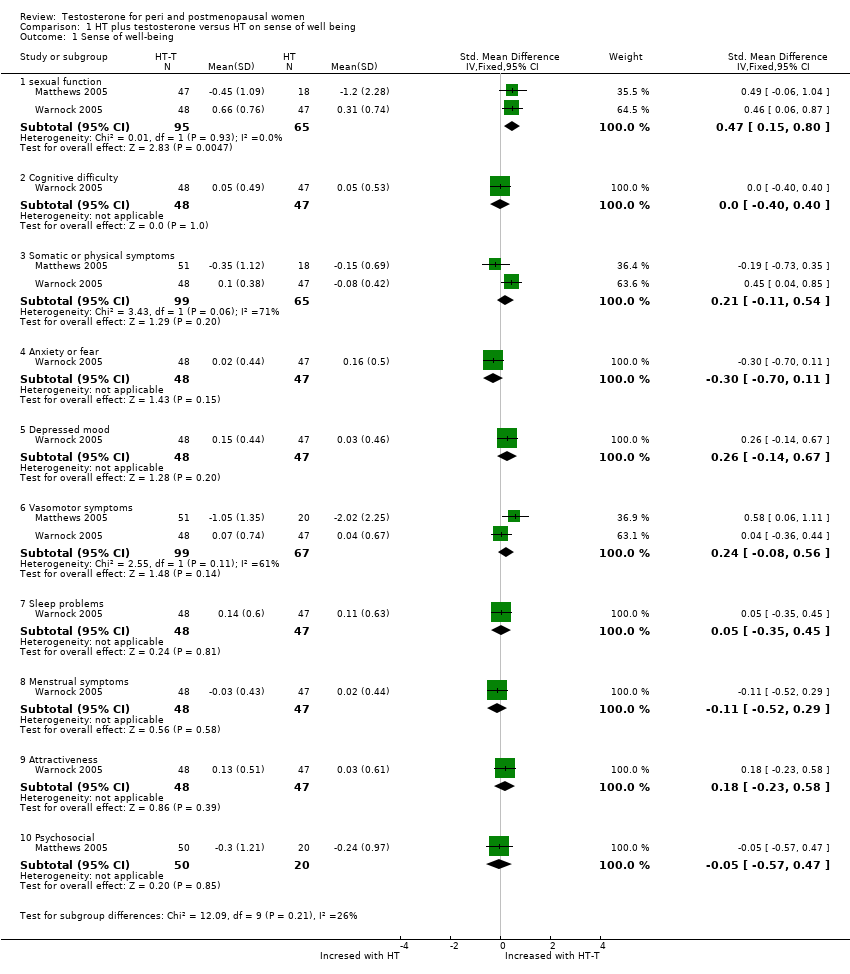
| Menopausal symptoms, sense of well being and sexual function | Barrett‐Connor 1999 | 199 | The data were not available | Women in all treatment groups reported an improvement in menopausal symptoms and quality of life measures at 24 months. There was a non significant trend toward greater improvement in well being and sexual interest and higher scores on the modified menopausal rating scale in the oestrogen‐testosterone groups |
| Menopausal symptoms and sexual function | Dow 1983 | 40 | The data were non‐normal distribution | There were no significant differences between treatments on any variable at either 2 months or 6 months after treatment |
| Menopausal symptoms | Hickok 1993 | 26 | The data were non‐normal distribution | There was no statistically significant difference between two treatments in menopausal symptoms |
| Menopausal symptoms | Miller 2000 (Luciano 1999) | 51 | The data were not available | Vasomotor symptoms were reduced by at least 75% after treatment in all groups |
| Menopausal symptoms | Raisz 1996 | 28 | The data was likely to be skewed | Both treatments significantly decreased somatic symptom scores, but only estrogen‐testosterone treatment provided significant relief of psychosomatic and psychological symptoms |
| Menopausal symptoms | Sarrel 1998 | 20 | The data was not available | There was no statistical difference between the estrogen‐testosterone groups versus the oestrogen group |
| Menopausal symptoms | Sherwin 1988 (Sherwin 1984) | 49 | The data was not available | There was no result for the comparative effect on hot flushes between estrogen‐testosterone and oestrogen alone |
| Menopausal symptoms | Sherwin 1988 (Sherwin 1985a) | 43 | The data were not available | Menopausal index:
1. Somatic symptoms: The scores of the oestrogen‐testosterone, androgen alone groups were lower than those of the oestrogen alone and placebo groups (P<0.01).
2. Psychosomatic symptoms: There were no significant changes in any of the groups across time.
3. Psychological symptoms: The scores of the estrogen‐alone and placebo groups were significantly higher than those of the oestrogen‐testosterone, androgen‐alone groups during both treatment phases (p<0.01).
4. Total scores: The E‐T, androgen‐alone groups attained lower total scores during treatment phases than the E‐alone and P groups |
| Menopausal symptoms | Simon 1999 | 92 | The data was not available | In general, estrogen‐testosterone therapy provided greater relief from these symptoms than oestrogen therapy. This was most apparent in the finding that the degree of vasomotor symptom relief with low dose estrogen‐testosterone preparation was similar to relief experienced with higher dose estrogen therapy alone. |
| Menopausal symptoms | Watts 1995 | 66 | The data were not available | There were no significant differences in somatic symptoms between the oestrogen and estrogen‐testosterone groups at baseline or after treatment. Psychosomatic and psychologic symptom values are not presented because of the small number of evaluable symptomatic participants |
| Mood (hostility) | Sherwin 1988 (Sherwin 1985c) | 36 | The data were not available | Hostility scores did not differ significantly in the two groups (testosterone‐oestrogen or oestrogen alone) |
| Sense of well being | Dobs 2002 | 40 | The data were not available. | With regard to QUALMS questionnaire, the oestrogen‐testosterone group showed significant improvement from baseline in somatic symptoms(week 10, P=0.003; week 16, P=0.073). The oestrogen group showed significant improvement from baseline in well being (week 16, P= 0.049) and cognition (week 10, P=0.054) |
| Sense of well being | Floter 2002b | 50 | A crossover study with no washout period | There were no significant differences between the treatments in any of the sub scores or total PGWB index |
| Sense of well being | Montgomery 1987 | 84 | The data were likely to be skewed | There was no difference in SRD 30 scores between the two active treatment groups at either 2 or 4 months |
| Sense of well being | Penotti 2001 | 40 | The data were not available. | No conclusion on psycho‐physical well being. |
| Sense of well being | Regestein 2001 | 35 | A cross‐over study with no washout period | No significant effects of adding testosterone into hormone therapy |
| Sense of well being | Sherwin 1988 (Sherwin 1985c) | 43 | The data was not available. | Anxiety: There was no differences among any of the groups across time.
Depression: Mean group scores fell within the normal range. Depression scores in the placebo group were significantly higher than those in oestrogen‐testosterone(P<0.05), A(P<0.01), E(P<0.05) groups during both treatment phases.
Hostility: hostility scores did not differ significantly in the two groups (testosterone‐oestrogen versus oestrogen alone) |
| Sense of well being | Shifren 2000 | 65 | A crossover study with no washout period | Adding 300 microgram patch into oral oestrogen has a significant improvement in general well being by means of PGWB (P=0.04). There also were significant increases with oestrogen‐testosterone 300 microgram treatment for sub scales of positive well being and depressed mood. |
| Sexual function | Burger 1987 | 20 | The data was not available. | After six weeks the loss of libido in the single implant group remained, while the combined group showed significant symptomatic relief(P<0.01). Eight in the single implant group chose to have a testosterone implant at the first follow up visit at 6 weeks; the other two stopped coming because of dissatisfaction with the treatment |
| Sexual function | Dobs 2002 | 40 | The data was not available. | The sample size was not powered, nor was entry criteria designed to assess sexual dysfunction parameters; however, there were significant results. In the oestrogen‐testosterone group, BISF‐W mean increases at each visit were statistically significant for frequency/psychosexual(P=0.05) and pleasure/orgasm(P=0.041) domains. The mean composite BISF‐W score increased in the oestrogen‐testosterone group, whereas the mean score in the estrogen group decreased. Although it appeared that the two treatment groups were not well balanced at baseline(the estrogen group seemed to have healthier sexual function at baseline than the estrogen‐testosterone group), the estrogen‐testosterone group showed significant improvement in sexual function compared with the estrogen group.
The SRS total score in the estrogen‐testosterone group improved significantly at each visit, whereas scores in the estrogen group did not change significantly. The SIQ score for the estrogen‐testosterone group also increased significantly for interest in sex at weeks 10(P=0.031) and 16(P=0.014) when compared with before menopause. The oestrogen group showed no significant change from baseline |
| Sexual function (total McCoy score) | Floter 2002b | 44 | A crossover study with no washout period | After 24 weeks of treatment, the addition of testosterone had a significantly better effect on the variables 'enjoyment of sex', 'satisfaction with frequency of sexual activity' and 'interest in sex'. The total McCoy score was significantly increased by both treatments, but the addition of testosterone exerted a stronger effect (P<0.05) |
| Sexual function | Miller 2000 (Luciano 1999) | 51 | The data was not available | Improvement (P<0.05) in sexual interest, sexual satisfaction, frequency of sexual intercourse and intensity and frequency of orgasm during sexual intercourse were reported in all groups except the estrogen alone group |
| Sexual function | Nathrost‐Boos 2006 | 60 | A cross‐over study with no washout period | The scores concerning frequency of sexual activity, orgasm and intercourse, sexual arousal, fantasies and enjoyment, satisfaction with orgasms, and interest in sex were all significantly improved for testosterone addition as compared to placebo both before and after crossover |
| Sexual function(desire and satisfaction) | Penotti 2001 | 33 | The data was not available | No difference between two groups was observed at any of the considered time points. |
| Sexual function | Shepanek 1999 | 30 | The data was likely to be skewed | Oestrogen‐testosterone‐treated participants reported significantly less lack of sexual desire or interest to engage in sexual activity, compared to participants receiving oestrogen alone |
| Sexual function | Sherwin 1988 (Sherwin 1985b) | 43 | The data was not available | Women who received either of the androgen‐containing preparations had significantly higher scores than women in the estrogen and placebo groups(P<0.01) in association with their higher levels of plasma testosterone. Women in the estrogen‐testosterone and testosterone‐only group experienced a greater number of fantasies during every treatment than did women in the oestrogen and placebo group (P<0.01). During treatment phases, both androgen groups attained higher levels of sexual arousal than did the estrogen and placebo groups(P<0.01) |
| Sexual function (scores) | Shifren 2000 | 65 | A cross‐over study with no washout period | The mean composite score expressed as a percentage of the mean value for normal women, increased from 52(27) percent at baseline to 72(38) percent during estrogen treatment, 74(37) percent during treatment with estrogen plus 150 microgram of testosterone per day, and 81(37) percent during treatment with estrogen plus 300 microgram of testosterone per day(P=0.05 for the comparison with estrogen‐alone). The scores for thoughts‐desire, frequency of sexual activity, and pleasure‐orgasm were lowest at baseline and increased in a dose‐dependent fashion. With the estrogen plus testosterone 300 microgram, the increases in scores for frequency of sexual activity and pleasure‐orgasm were significantly greater than those with estrogen‐alone (P=0.03 for both comparisons). The score for problems affecting sexual function was 116%(48) of the normative mean at baseline and decreased to 98%(49) during treatment with estrogen plus 300 microgram of testosterone(P=0.07 for the comparison with oestrogen‐alone) |
| Sexual function (the prevalence of particular types of sexual behavior) | Shifren 2000 | 65 | A crossover study with no washout period | The percentage of women who reported having sexual fantasies at least once a week was 12% at baseline, 10% during oestrogen treatment, 18 percent during estrogen plus testosterone 150 microgram, and 24% during treatment with estrogen plus 300 microgram of testosterone. The percentage of women who reported masturbating at least once a week was 3%, 5% and 10% at baseline, estrogen treatment and estrogen plus testosterone treatment, respectively. Finally, the percentage of women who engaged in sexual intercourse at least once a week was 23% at baseline, 35% during treatment with either oestrogen‐alone or oestrogen plus 150 microgram of testosterone, and 41% during treatment with oestrogen plus 300 microgram of testosterone |
| Unexplained fatigue (vitality) | Floter 2002b | 50 | A crossover study with no washout period | There was no significant difference between the treatments in vitality |
| Unexplained fatigue (vitality) | Shifren 2000 | 67 | A crossover study with no washout period | Vitality improved in women treated with testosterone patch combined with oral conjugated equine oestrogen |
| Unexplained fatigue and sense of well being | Sherwin 1988 (Sherwin 1985a) | 43 | The data was not available | Women in estrogen alone and placebo groups reported significantly lower ratings of energy level and well being than did those who received either of the androgen‐containing preparations (P<0.01) |