Corticosteroides prenatales para acelerar la maduración del pulmón fetal en mujeres con riesgo de parto prematuro
Información
- DOI:
- https://doi.org/10.1002/14651858.CD004454.pub4Copiar DOI

- Base de datos:
-
- Cochrane Database of Systematic Reviews
- Versión publicada:
-
- 25 diciembre 2020see what's new
- Tipo:
-
- Intervention
- Etapa:
-
- Review
- Grupo Editorial Cochrane:
-
Grupo Cochrane de Embarazo y parto
- Copyright:
-
- Copyright © 2020 The Cochrane Collaboration. Published by John Wiley & Sons, Ltd.
Cifras del artículo
Altmetric:
Citado por:
Autores
Contributions of authors
For this update the contributions of each author are listed below.
Fiona Stewart assessed all trials for trustworthiness, extracted and entered data, assessed risk of bias, assessed certainty of evidence, drafted 'Summary of findings' tables, drafted text of the review. Emma McGoldrick assessed all trials for trustworthiness, extracted data, assessed risk of bias, re‐analysed intraventricular haemorrhage (IVH) data. Roses Parker, for a proportion of trials, extracted data, assessed risk of bias and assessed for trustworthiness. She also assessed certainty of evidence and drafted 'Summary of findings' tables. Stuart Dalziel reviewed all aspects of review and contributed to text.
Sources of support
Internal sources
-
University of Auckland, New Zealand
-
The University of Liverpool, UK
-
Liverpool Women's NHS Foundation Trust, UK
External sources
-
Harris‐Wellbeing of Women Preterm Birth Centre, UK
-
Cure Kids, New Zealand
Declarations of interest
Fiona Stewart: none known
Emma McGoldrick: none known
Roses Parker: none known
Stuart Dalziel reports receiving research funding, not associated with the review topic, from Cure Kids, Health Research Council, and Starship Foundation, New Zealand. Stuart Dalziel is employed by The University of Auckland and Auckland District Health Board. He is also on the board of the Advanced Paediatric Life Support New Zealand.
Acknowledgements
P Crowley's first, unstructured review of antenatal corticosteroids was conducted at the suggestion of Professor Dennis Hawkins in 1980. Dr Anne Anderson encouraged her to use it as a basis for an early meta‐analysis in 1981. Her work at the National Perinatal Epidemiology Unit in 1980 to 1981 was funded by the National Maternity Hospital, Dublin at the suggestion of the then Master, Dr Dermot MacDonald. This review was first published in structured form on the Oxford Database of Perinatal Trials in 1989. The preparation and continued updating of the original review would have been impossible without the help of Iain and Jan Chalmers, Marc Keirse, Jini Hetherington, Sonja Henderson and Professor Zarko Alfirevic.
Acknowledgements to Professor James Neilson and Professor Jane Harding for their help with the previous update. Many thanks to Sonja Henderson for sound advice at all times. Acknowledgements also to all the study authors who provided us with additional data.
Thanks to Almira Opardija for translating Grgic 2003. Thanks also to Bita Mesgarpour for translating Mansouri 2010.
For the 2017 update: we acknowledge and thank Tineke Crawford for her contribution to editing the review and updating some of the evidence. We would also like to thank Leanne Jones and Therese Dowswell for their contribution to editing the review.
We acknowledge the contribution of Devener Roberts, Nancy Medley, and Julie Brown for their author contributions to previous versions of this review.
As part of the pre‐publication editorial process, this review has been commented on by three peers (an editor and two referees who are external to the editorial team), a member of Cochrane Pregnancy and Childbirth's international panel of consumers and the Group's Statistical Adviser. The authors are grateful to the following peer reviewers for their time and comments: Doris Chou, Maternal and Perinatal Health, Department of Sexual and Reproductive Health and Research, WHO, Geneva; Jim G Thornton, Professor of Obstetrics and Gynaecology, University of Nottingham, UK.
This project was supported by the National Institute for Health Research (NIHR), via Evidence Synthesis Programme funding to Cochrane Pregnancy and Childbirth. The views and opinions expressed therein are those of the authors and do not necessarily reflect those of the Evidence Synthesis Programme, the NIHR, National Health Service (NHS) or the Department of Health and Social Care.
S Dalziel's time was supported by Cure Kids New Zealand.
Version history
| Published | Title | Stage | Authors | Version |
| 2020 Dec 25 | Antenatal corticosteroids for accelerating fetal lung maturation for women at risk of preterm birth | Review | Emma McGoldrick, Fiona Stewart, Roses Parker, Stuart R Dalziel | |
| 2017 Mar 21 | Antenatal corticosteroids for accelerating fetal lung maturation for women at risk of preterm birth | Review | Devender Roberts, Julie Brown, Nancy Medley, Stuart R Dalziel | |
| 2006 Jul 19 | Antenatal corticosteroids for accelerating fetal lung maturation for women at risk of preterm birth | Review | Devender Roberts, Stuart R Dalziel | |
| 2003 Oct 20 | Antenatal corticosteroids to accelerate fetal lung maturation for women at risk of preterm birth | Protocol | Patricia Crowley, Devender Roberts, Stuart R Dalziel, Ben NJ Shaw | |
Differences between protocol and review
The methods have been updated to current standard methods text for the Cochrane Pregnancy and Childbirth Group.
The following subgroups were not pre‐specified in the protocol:
-
decade of trial;
-
gestational age at trial entry;
-
protocol with weekly repeats.
In the 2016 update, comparison one was re‐structured to include only the main analysis, with all clinical groups moved to subsequent comparisons. We have also deleted subgroups from previous versions of the review related to post‐randomisation variables (gestational age to delivery and ruptured membranes at specific time points). A 'Summary of findings' table has been incorporated in this update (2016).
We clarified the primary outcome of deaths (fetal/neonatal) to perinatal deaths. Neonatal deaths and fetal deaths are still presented separately as primary outcomes.
We renamed outcomes of mean length for children and adults as mean height.
In response to referee feedback we changed the name of the primary outcome 'puerperal sepsis' to 'endometritis (including infections)'. Most trials (7/10) in this analysis specifically reported endometritis.
2020 update
We used pre‐defined criteria to assess the trustworthiness of studies that otherwise meet the review's inclusion criteria. We put any studies that were assessed as untrustworthy into 'awaiting classification' and did not include them in the review.
To ensure a consistent approach in our analysis we applied the intention‐to‐treat principle for all outcomes related to the neonate/fetus, and we expanded our methods in this regard in the 'Dealing with missing data' section.
We amended our methods for assessing heterogeneity using up‐to‐date Cochrane methods.
We checked and re‐analysed the data relating to the intraventricular haemorrhage(IVH) to take into different methods of diagnosing IVH.
For the child and the child as adult, we removed the secondary outcomes relating to visual impairment, hearing impairment, developmental delay and intellectual impairment since these are all included in the primary outcome of neurodevelopmental disability.
We added two outcomes to the 'Summary of findings' table ‐ neonatal death and neurodevelopmental disability ‐ because we believe these outcomes are important in presenting a more complete summary of the evidence.
Keywords
MeSH
Medical Subject Headings (MeSH) Keywords
- Adrenal Cortex Hormones [*administration & dosage];
- Betamethasone [administration & dosage];
- Bias;
- Cerebral Intraventricular Hemorrhage [prevention & control];
- Developmental Disabilities [epidemiology];
- Dexamethasone [administration & dosage];
- Fetal Organ Maturity [*drug effects];
- Hydrocortisone [administration & dosage];
- Lung [drug effects, *embryology];
- Maternal Death;
- Perinatal Death;
- *Premature Birth;
- Prenatal Care [*methods];
- Randomized Controlled Trials as Topic;
- Respiratory Distress Syndrome, Newborn [*prevention & control];
Medical Subject Headings Check Words
Female; Humans; Infant, Newborn; Pregnancy;
PICO
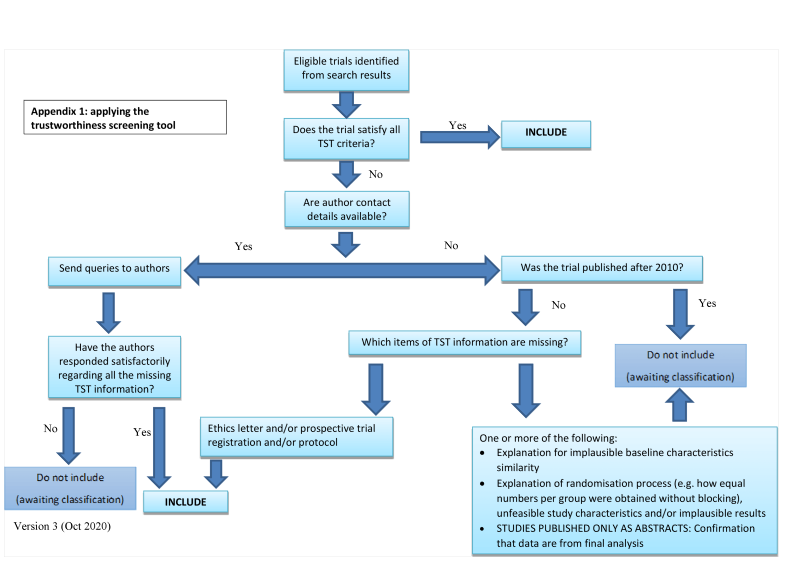
Applying the trustworthiness screening tool criteria

Study flow diagram.

'Risk of bias' graph: review authors' judgements about each risk of bias item presented as percentages across all included studies

'Risk of bias' summary: review authors' judgements about each risk of bias item for each included study

Funnel plot of comparison: 1 Corticosteroids versus placebo or no treatment, outcome: 1.4 Perinatal deaths

Funnel plot of comparison: 1 Corticosteroids versus placebo or no treatment, outcome: 1.5 Neonatal deaths

Funnel plot of comparison: 1 Corticosteroids versus placebo or no treatment, outcome: 1.6 Fetal deaths

Funnel plot of comparison: 1 Corticosteroids versus placebo or no treatment, outcome: 1.7 Respiratory distress syndrome

Funnel plot of comparison: 1 Corticosteroids versus placebo or no treatment, outcome: 1.7 Intraventricular haemorrhage.

Funnel plot of comparison: 1 Corticosteroids versus placebo or no treatment, outcome: 1.11 Mean birthweight (g)

Funnel plot of comparison: 1 Corticosteroids versus placebo or no treatment, outcome: 1.2 Chorioamnionitis

Funnel plot of comparison: 1 Corticosteroids versus placebo or no treatment, outcome: 1.11 Endometritis.

Funnel plot of comparison: 1 Corticosteroids versus placebo or no treatment, outcome: 1.30 Apgar < 7 at 5 minutes

Funnel plot of comparison: 1 Corticosteroids versus placebo or no treatment, outcome: 1.25 Need for mechanical ventilation/CPAP

Funnel plot of comparison: 1 Corticosteroids versus placebo or no treatment, outcome: 1.38 Proven infection while in the neonatal intensive care unit.

Funnel plot of comparison: 1 Corticosteroids versus placebo or no treatment, outcome: 1.39 Necrotising enterocolitis.

Comparison 1: Corticosteroids versus placebo or no treatment, Outcome 1: Perinatal death

Comparison 1: Corticosteroids versus placebo or no treatment, Outcome 2: Neonatal death

Comparison 1: Corticosteroids versus placebo or no treatment, Outcome 3: Fetal death

Comparison 1: Corticosteroids versus placebo or no treatment, Outcome 4: Respiratory distress syndrome

Comparison 1: Corticosteroids versus placebo or no treatment, Outcome 5: Moderate/severe respiratory distress syndrome

Comparison 1: Corticosteroids versus placebo or no treatment, Outcome 6: Chronic lung disease

Comparison 1: Corticosteroids versus placebo or no treatment, Outcome 7: Intraventricular haemorrhage

Comparison 1: Corticosteroids versus placebo or no treatment, Outcome 8: Mean birthweight (g)

Comparison 1: Corticosteroids versus placebo or no treatment, Outcome 9: Maternal death

Comparison 1: Corticosteroids versus placebo or no treatment, Outcome 10: Chorioamnionitis

Comparison 1: Corticosteroids versus placebo or no treatment, Outcome 11: Endometritis

Comparison 1: Corticosteroids versus placebo or no treatment, Outcome 12: Death in childhood

Comparison 1: Corticosteroids versus placebo or no treatment, Outcome 13: Neurodevelopmental disability in childhood

Comparison 1: Corticosteroids versus placebo or no treatment, Outcome 14: Death into adulthood

Comparison 1: Corticosteroids versus placebo or no treatment, Outcome 15: Neurodevelopmental disability in adulthood

Comparison 1: Corticosteroids versus placebo or no treatment, Outcome 16: Fever in women after trial entry requiring the use of antibiotics

Comparison 1: Corticosteroids versus placebo or no treatment, Outcome 17: Intrapartum fever in woman requiring the use of antibiotics

Comparison 1: Corticosteroids versus placebo or no treatment, Outcome 18: Postnatal fever in woman

Comparison 1: Corticosteroids versus placebo or no treatment, Outcome 19: Admission into adult intensive care unit

Comparison 1: Corticosteroids versus placebo or no treatment, Outcome 20: Side effects of therapy in women

Comparison 1: Corticosteroids versus placebo or no treatment, Outcome 21: Glucose intolerance

Comparison 1: Corticosteroids versus placebo or no treatment, Outcome 22: Hypertension

Comparison 1: Corticosteroids versus placebo or no treatment, Outcome 23: Apgar < 7 at 5 minutes

Comparison 1: Corticosteroids versus placebo or no treatment, Outcome 24: Mean interval between trial entry and birth (days)

Comparison 1: Corticosteroids versus placebo or no treatment, Outcome 25: Mean length at birth (cm)

Comparison 1: Corticosteroids versus placebo or no treatment, Outcome 26: Mean head circumference at birth (cm)

Comparison 1: Corticosteroids versus placebo or no treatment, Outcome 27: Small‐for‐gestational age

Comparison 1: Corticosteroids versus placebo or no treatment, Outcome 28: Admission to neonatal intensive care unit

Comparison 1: Corticosteroids versus placebo or no treatment, Outcome 29: Need for mechanical ventilation/CPAP

Comparison 1: Corticosteroids versus placebo or no treatment, Outcome 30: Mean duration of mechanical ventilation/CPAP (days)
| Median (IQR) duration of mechanical ventilation (hours) | ||
| Study | Corticosteroids | Placebo |
|---|---|---|
| WHO 2020 | 18 hours (12‐48) 83 infants | 18 hours (12‐60) 103 infants |
Comparison 1: Corticosteroids versus placebo or no treatment, Outcome 31: Median (IQR) duration of mechanical ventilation (hours)
| Median (IQR) duration of CPAP (hours) | ||
| Study | Corticosteroids | Placebo |
|---|---|---|
| WHO 2020 | 48 hours (24‐96) 265 infants | 48 hours (24‐84) 337 infants |
Comparison 1: Corticosteroids versus placebo or no treatment, Outcome 32: Median (IQR) duration of CPAP (hours)

Comparison 1: Corticosteroids versus placebo or no treatment, Outcome 33: Air leak syndrome

Comparison 1: Corticosteroids versus placebo or no treatment, Outcome 34: Mean duration of oxygen supplementation (hours)
| Median (IQR) duration of oxygen supplementation (hours) | ||
| Study | Corticosteroids | Placebo |
|---|---|---|
| WHO 2020 | 36 (18‐96) 726 infants | 48 (12‐93) 756 infants |
Comparison 1: Corticosteroids versus placebo or no treatment, Outcome 35: Median (IQR) duration of oxygen supplementation (hours)

Comparison 1: Corticosteroids versus placebo or no treatment, Outcome 36: Surfactant use

Comparison 1: Corticosteroids versus placebo or no treatment, Outcome 37: Systemic infection in the first 48 hours of life

Comparison 1: Corticosteroids versus placebo or no treatment, Outcome 38: Proven infection while in the neonatal intensive care unit

Comparison 1: Corticosteroids versus placebo or no treatment, Outcome 39: Necrotising enterocolitis

Comparison 1: Corticosteroids versus placebo or no treatment, Outcome 40: Mean infant HPA axis function (cortisol)

Comparison 1: Corticosteroids versus placebo or no treatment, Outcome 41: Mean childhood weight (kg)

Comparison 1: Corticosteroids versus placebo or no treatment, Outcome 42: Mean childhood head circumference (cm)

Comparison 1: Corticosteroids versus placebo or no treatment, Outcome 43: Mean childhood height (cm)

Comparison 1: Corticosteroids versus placebo or no treatment, Outcome 44: Mean childhood systolic blood pressure (mmHg)

Comparison 1: Corticosteroids versus placebo or no treatment, Outcome 45: Cerebral palsy in childhood

Comparison 1: Corticosteroids versus placebo or no treatment, Outcome 46: Behavioural/learning difficulties in childhood

Comparison 1: Corticosteroids versus placebo or no treatment, Outcome 47: Mean adult weight (kg)

Comparison 1: Corticosteroids versus placebo or no treatment, Outcome 48: Mean adult head circumference (cm)

Comparison 1: Corticosteroids versus placebo or no treatment, Outcome 49: Mean adult height (cm)

Comparison 1: Corticosteroids versus placebo or no treatment, Outcome 50: Mean adult skinfold thickness (log values)

Comparison 1: Corticosteroids versus placebo or no treatment, Outcome 51: Abnormal lung function measured as forced vital capacity (adult)

Comparison 1: Corticosteroids versus placebo or no treatment, Outcome 52: Mean adult systolic blood pressure (mmHg)

Comparison 1: Corticosteroids versus placebo or no treatment, Outcome 53: Mean adult insulin (log values)

Comparison 1: Corticosteroids versus placebo or no treatment, Outcome 54: Mean adult glucose

Comparison 1: Corticosteroids versus placebo or no treatment, Outcome 55: Mean adult HPA axis function (mean log fasting cortisol)

Comparison 1: Corticosteroids versus placebo or no treatment, Outcome 56: Mean age at puberty (years)

Comparison 1: Corticosteroids versus placebo or no treatment, Outcome 57: Educational achievement by adulthood (university or polytechnic education)

Comparison 1: Corticosteroids versus placebo or no treatment, Outcome 58: Mean length of antenatal hospitalisation (days)
| Length of maternal hospital stay | |||
| Study | Measure | Corticosteroids | Control |
|---|---|---|---|
| Attawattanakul 2015 | Overall length of maternal hospital stay (days) (mean (SD)) | 3.57 (0.87) 96 women | 3.58 (0.75) 98 women |
| Gyamfi‐Bannerman 2016 | Overall length of maternal hospital stay (days) (median (IQR)) | 3 (3 to 5) 1427 women | 3 (3 to 5) 1400 women |
| Mansouri 2010 | Number of women requiring a hospital stay of more than three days | 12/100 | 12/100 |
| WHO 2020 | Overall length of maternal hospital stay (days) (median (IQR)) | 8 (4 to 20) 1323 women | 8 (4 to19) 1322 women |
Comparison 1: Corticosteroids versus placebo or no treatment, Outcome 59: Length of maternal hospital stay

Comparison 1: Corticosteroids versus placebo or no treatment, Outcome 60: Mean length of postnatal hospitalisation (days)

Comparison 1: Corticosteroids versus placebo or no treatment, Outcome 61: Mean length of neonatal hospitalisation (days)
| Length of neonatal hospitalisation | |||
| Study | Measure | Corticosteroids | Control |
|---|---|---|---|
| Gyamfi‐Bannerman 2016 | Overall length of neonatal hospital stay (days) (median (IQR)) | 7 (4 to 12) 1427 infants | 8 (4 to 13) 1400 infants |
| WHO 2020 | Overall length of neonatal hospital stay (days) (median (IQR)) | 8 (3 to17) 1320 infants | 8 (3 to 17) 1301 infants |
Comparison 1: Corticosteroids versus placebo or no treatment, Outcome 62: Length of neonatal hospitalisation

Comparison 2: Corticosteroids versus placebo or no treatment ‐ single or multiple pregnancy, Outcome 1: Perinatal death ‐ single or multiple pregnancy

Comparison 2: Corticosteroids versus placebo or no treatment ‐ single or multiple pregnancy, Outcome 2: Neonatal death ‐ single or multiple pregnancy

Comparison 2: Corticosteroids versus placebo or no treatment ‐ single or multiple pregnancy, Outcome 3: Fetal death ‐ single or multiple pregnancy

Comparison 2: Corticosteroids versus placebo or no treatment ‐ single or multiple pregnancy, Outcome 4: Respiratory distress syndrome ‐ single or multiple pregnancy

Comparison 2: Corticosteroids versus placebo or no treatment ‐ single or multiple pregnancy, Outcome 5: Intraventricular haemorrhage ‐ single or multiple pregnancy

Comparison 3: Corticosteroids versus placebo or no treatment ‐ intact membranes versus ruptured membranes at first dose, Outcome 1: Perinatal death ‐ intact or ruptured membranes

Comparison 3: Corticosteroids versus placebo or no treatment ‐ intact membranes versus ruptured membranes at first dose, Outcome 2: Neonatal deaths ‐ intact or ruptured membranes

Comparison 3: Corticosteroids versus placebo or no treatment ‐ intact membranes versus ruptured membranes at first dose, Outcome 3: Fetal death ‐ intact or ruptured membranes

Comparison 3: Corticosteroids versus placebo or no treatment ‐ intact membranes versus ruptured membranes at first dose, Outcome 4: RDS ‐ intact or ruptured membranes

Comparison 3: Corticosteroids versus placebo or no treatment ‐ intact membranes versus ruptured membranes at first dose, Outcome 5: IVH ‐ intact or ruptured membranes

Comparison 3: Corticosteroids versus placebo or no treatment ‐ intact membranes versus ruptured membranes at first dose, Outcome 6: Birthweight ‐ intact or ruptured membranes

Comparison 3: Corticosteroids versus placebo or no treatment ‐ intact membranes versus ruptured membranes at first dose, Outcome 7: Chorioamnionitis ‐ intact or ruptured membranes

Comparison 3: Corticosteroids versus placebo or no treatment ‐ intact membranes versus ruptured membranes at first dose, Outcome 8: Endometritis ‐ intact or ruptured membranes

Comparison 4: Corticosteroids versus placebo or no treatment ‐ hypertension syndrome versus all other trials, Outcome 1: Perinatal deaths ‐ hypertension syndrome vs other trials

Comparison 4: Corticosteroids versus placebo or no treatment ‐ hypertension syndrome versus all other trials, Outcome 2: Neonatal deaths ‐ hypertension syndrome vs other trials

Comparison 4: Corticosteroids versus placebo or no treatment ‐ hypertension syndrome versus all other trials, Outcome 3: Fetal deaths ‐ hypertension syndrome vs other trials

Comparison 4: Corticosteroids versus placebo or no treatment ‐ hypertension syndrome versus all other trials, Outcome 4: Respiratory distress syndrome ‐ hypertension syndrome vs other trials

Comparison 5: Corticosteroids versus placebo or no treatment ‐ type of steroid, Outcome 1: Perinatal death ‐ type of steroid

Comparison 5: Corticosteroids versus placebo or no treatment ‐ type of steroid, Outcome 2: Neonatal death ‐ type of steroid

Comparison 5: Corticosteroids versus placebo or no treatment ‐ type of steroid, Outcome 3: Fetal death ‐ type of steroid

Comparison 5: Corticosteroids versus placebo or no treatment ‐ type of steroid, Outcome 4: Respiratory distress syndrome ‐ type of steroid

Comparison 5: Corticosteroids versus placebo or no treatment ‐ type of steroid, Outcome 5: Moderate/severe respiratory distress syndrome ‐ type of steroid

Comparison 5: Corticosteroids versus placebo or no treatment ‐ type of steroid, Outcome 6: Chronic lung disease ‐ type of steroid

Comparison 5: Corticosteroids versus placebo or no treatment ‐ type of steroid, Outcome 7: IVH ‐ type of steroid

Comparison 5: Corticosteroids versus placebo or no treatment ‐ type of steroid, Outcome 8: Birthweight ‐ type of steroid

Comparison 5: Corticosteroids versus placebo or no treatment ‐ type of steroid, Outcome 9: Chorioamnionitis ‐ type of steroid

Comparison 5: Corticosteroids versus placebo or no treatment ‐ type of steroid, Outcome 10: Endometritis ‐ type of steroid

Comparison 6: Corticosteroids versus placebo or no treatment ‐ decade of trial, Outcome 1: Perinatal death ‐ decade of trial

Comparison 6: Corticosteroids versus placebo or no treatment ‐ decade of trial, Outcome 2: Neonatal death ‐ decade of trial

Comparison 6: Corticosteroids versus placebo or no treatment ‐ decade of trial, Outcome 3: Fetal death ‐ decade of trial

Comparison 6: Corticosteroids versus placebo or no treatment ‐ decade of trial, Outcome 4: Respiratory distress syndrome ‐ decade of trial

Comparison 6: Corticosteroids versus placebo or no treatment ‐ decade of trial, Outcome 5: IVH ‐ decade of trial

Comparison 6: Corticosteroids versus placebo or no treatment ‐ decade of trial, Outcome 6: Birthweight ‐ decade of trial

Comparison 6: Corticosteroids versus placebo or no treatment ‐ decade of trial, Outcome 7: Chorioamnionitis ‐ decade of trial

Comparison 6: Corticosteroids versus placebo or no treatment ‐ decade of trial, Outcome 8: Endometritis ‐ decade of trial

Comparison 7: Corticosteroids versus placebo or no treatment ‐ weekly repeats, Outcome 1: Perinatal death ‐ protocol with weekly repeats

Comparison 7: Corticosteroids versus placebo or no treatment ‐ weekly repeats, Outcome 2: Neonatal death ‐ protocol with weekly repeats

Comparison 7: Corticosteroids versus placebo or no treatment ‐ weekly repeats, Outcome 3: Fetal death ‐ protocol with weekly repeats

Comparison 7: Corticosteroids versus placebo or no treatment ‐ weekly repeats, Outcome 4: Respiratory distress syndrome ‐ protocol with weekly repeats

Comparison 7: Corticosteroids versus placebo or no treatment ‐ weekly repeats, Outcome 5: Moderate/severe respiratory distress syndrome

Comparison 7: Corticosteroids versus placebo or no treatment ‐ weekly repeats, Outcome 6: IVH ‐ protocol with weekly repeats

Comparison 7: Corticosteroids versus placebo or no treatment ‐ weekly repeats, Outcome 7: Birthweight ‐ protocol with weekly repeats

Comparison 7: Corticosteroids versus placebo or no treatment ‐ weekly repeats, Outcome 8: Chorioamnionitis ‐ protocol with weekly repeats

Comparison 7: Corticosteroids versus placebo or no treatment ‐ weekly repeats, Outcome 9: Endometritis ‐ protocol with weekly repeats

Comparison 8: Corticosteroids versus placebo or no treatment ‐ gestational age at trial entry, Outcome 1: Perinatal death ‐ gestational age at trial entry

Comparison 8: Corticosteroids versus placebo or no treatment ‐ gestational age at trial entry, Outcome 2: Neonatal death ‐ gestational age at trial entry

Comparison 8: Corticosteroids versus placebo or no treatment ‐ gestational age at trial entry, Outcome 3: Fetal death ‐ gestational age at trial entry

Comparison 8: Corticosteroids versus placebo or no treatment ‐ gestational age at trial entry, Outcome 4: Respiratory distress syndrome ‐ gestational age at trial entry

Comparison 8: Corticosteroids versus placebo or no treatment ‐ gestational age at trial entry, Outcome 5: IVH ‐ gestational age at trial entry

Comparison 8: Corticosteroids versus placebo or no treatment ‐ gestational age at trial entry, Outcome 6: Birthweight ‐ gestational age at trial entry

Comparison 8: Corticosteroids versus placebo or no treatment ‐ gestational age at trial entry, Outcome 7: Chorioamnionitis ‐ gestational age at trial entry
| Neonatal and child outcomes: corticosteroids compared to placebo or no treatment for accelerating fetal lung maturation for women at risk of preterm birth | ||||||
| Patient or population: infants born of women at risk of preterm birth | ||||||
| Outcomes | Relative effect | Anticipated absolute effects* (95% CI) | Certainty of the evidence | What happens | ||
|---|---|---|---|---|---|---|
| Without Corticosteroids | With Corticosteroids | Difference | ||||
| Perinatal death (composite of fetal death (in utero death) and neonatal death) | RR 0.85 | Study population | ⊕⊕⊕⊕ | Corticosteroids reduce perinatal death compared with placebo or no treatment. | ||
| 15.6% | 13.3% | 2.3% fewer | ||||
| Neonatal death (infants born with signs of life who die within the first 28 days) | RR 0.78 | Study population | ⊕⊕⊕⊕ | Corticosteroids reduce neonatal death compared with placebo or no treatment. | ||
| 11.9% | 9.3% | 2.6% fewer | ||||
| Respiratory distress syndrome | RR 0.71 | Study population | ⊕⊕⊕⊕ | Corticosteroids reduce respiratory distress syndrome compared with placebo or no treatment. We did not downgrade for risk of bias (two trials) at high risk of bias due to lack of placebo in control) because sensitivity analysis removing those trials made very little difference to the effect estimate. | ||
| 14.8% | 10.5% | 4.3% fewer | ||||
| Intraventricular haemorrhage (IVH) | RR 0.58 | Study population | ⊕⊕⊕⊝ | Corticosteroids probably reduce intraventricular haemorrhage compared with placebo or no treatment. We did not downgrade for risk of bias (four trials infants) at high risk of bias due to lack of placebo in control groups) because sensitivity analysis removing those trials made very little difference to the effect estimate. | ||
| 3.3% | 1.9% | 1.4% fewer | ||||
| Mean birthweight (g) | ‐ | The mean birthweight in the control group ranged from 941 g to 2654 g | ‐ | MD 14.02 lower | ⊕⊕⊕⊕ | Corticosteroids result in little to no difference in mean birthweight compared with placebo or no treatment. We did not downgrade for risk of bias (two trials at high risk of bias due to incomplete outcome data) because sensitivity analysis removing those trials made very little difference to the effect estimate. We did not downgrade for imprecision because the confidence interval showed a difference at most on average of 33 g in weight, which is less than 10% of the lightest mean weight in any trial. |
| Developmental delay in childhood Age at follow‐up: 2 to 12 years. | RR 0.51 (0.27 to 0.97) | 7.7% | 4.0% (2.1 to 7.5) | 3.8% fewer (5.7 fewer to 0.2 fewer) | ⊕⊕⊕⊝ | Corticosteroids probably lead to a slight reduction in developmental delay in childhood compared with placebo or no treatment. Additionally, in three studies (778 children) it was uncertain if corticosteroids had any effect on intellectual impairment (RR 0.86, 95% CI 0.44 to 1.69). In two studies (166 children) it was uncertain if corticosteroids had any effect on the risk of visual impairment (RR 0.55, 95% CI 0.24 to 1.23) and in one study (82 children) it was uncertain if corticosteroids have any effect on hearing impairment (RR 0.64, 95% CI 0.04 to 9.87). Another study reported no children with hearing impairment in either group (84 children). |
| *The risk in the intervention group (and its 95% confidence interval) is based on the assumed risk in the comparison group and the relative effect of the intervention (and its 95% CI). | ||||||
| GRADE Working Group grades of evidence | ||||||
| 1 Downgraded one level for indirectness: in some trials only a subset of infants were screened for IVH; some trials diagnosed IVH at postmortem only. 2 Downgraded one level for risk of bias: unclear randomisation, allocation concealment, incomplete outcome data and selective reporting | ||||||
| Maternal outcomes: corticosteroids compared to placebo or no treatment for accelerating fetal lung maturation for women at risk of preterm birth | ||||||
| Patient or population: women at risk of preterm birth | ||||||
| Outcomes | Relative effect | Anticipated absolute effects* (95% CI) | Certainty of the evidence | What happens | ||
|---|---|---|---|---|---|---|
| Without Corticosteroids | With Corticosteroids | Difference | ||||
| Maternal death | RR 1.19 | Study population | ⊕⊕⊕⊝ | Corticosteroids probably result in little to no difference in maternal death, but the wide 95% CI includes possible benefit and possible harm, compared to placebo or no treatment. Four studies (3174 women) reported zero deaths in either arm. | ||
| 0.2% | 0.2% | 0.0% fewer (0.1 fewer to 0.5 more) | ||||
| Chorioamnionitis | RR 0.86 | Study population | ⊕⊕⊕⊝ | Corticosteroids probably make little to no difference to the risk of chorioamnionitis but the wide 95% CI includes possible benefit and possible harm, compared to placebo/no treatment. | ||
| 3.5% | 3.0% | 0.5% fewer | ||||
| Endometritis | RR 1.14 | Study population | ⊕⊕⊕⊝ | Corticosteroids probably make little to no difference to the risk of endometritis but the wide 95% CI includes possible benefit and possible harm, compared to placebo/no treatment. | ||
| 1.8% | 2.1% | 0.3% more | ||||
| *The risk in the intervention group (and its 95% confidence interval) is based on the assumed risk in the comparison group and the relative effect of the intervention (and its 95% CI). | ||||||
| GRADE Working Group grades of evidence | ||||||
| 1 Downgraded one level for imprecision: few events and wide 95% CI that includes possible benefit and possible harm 2 Downgraded one level for imprecision: wide 95% CI that includes possible benefit and possible harm | ||||||
| Trial | Minimum (weeks+days) | Maximum (weeks+days) |
| 28+0 | 34+6 | |
| 34+0 | 36+6 | |
| 34+0 | 36+6 | |
| Not reported | 36+6 | |
| 26+0 | 37+0 | |
| 28+0 | 34+6 | |
| 26+0 | 34+6 | |
| Not reported | 34+6 | |
| 24+0 | 27+6 | |
| 34+0 | 36+6 | |
| 24+0 | 31+6 | |
| 24+0 | 34+6 | |
| 24+0 | 36+6 | |
| 27+0 | 35+0 | |
| 35+0 | 36+6 | |
| 26+0 | 34+6 | |
| Not reported | 34+0 | |
| 28+0 | 34+6 | |
| 34+0 | 36+6 | |
| 34+0 | 36+6 | |
| 27+0 | 34+6 | |
| 26+0 | 32+6 | |
| 26+0 | 32+0 | |
| 34+0 | 36+6 | |
| 24+0 | 29+6 | |
| 28+0 | 35+6 | |
| 26+0 | 33+6 |
| Outcome or subgroup title | No. of studies | No. of participants | Statistical method | Effect size |
| 1.1 Perinatal death Show forest plot | 14 | 9833 | Risk Ratio (M‐H, Fixed, 95% CI) | 0.85 [0.77, 0.93] |
| 1.2 Neonatal death Show forest plot | 22 | 10609 | Risk Ratio (M‐H, Fixed, 95% CI) | 0.78 [0.70, 0.87] |
| 1.3 Fetal death Show forest plot | 14 | 9833 | Risk Ratio (M‐H, Fixed, 95% CI) | 1.01 [0.83, 1.22] |
| 1.4 Respiratory distress syndrome Show forest plot | 26 | 11183 | Risk Ratio (M‐H, Fixed, 95% CI) | 0.71 [0.65, 0.78] |
| 1.5 Moderate/severe respiratory distress syndrome Show forest plot | 7 | 4874 | Risk Ratio (M‐H, Fixed, 95% CI) | 0.70 [0.59, 0.83] |
| 1.6 Chronic lung disease Show forest plot | 5 | 745 | Risk Ratio (M‐H, Random, 95% CI) | 0.86 [0.41, 1.79] |
| 1.7 Intraventricular haemorrhage Show forest plot | 12 | 8475 | Risk Ratio (M‐H, Fixed, 95% CI) | 0.58 [0.45, 0.75] |
| 1.7.1 Any IVH grade | 5 | 720 | Risk Ratio (M‐H, Fixed, 95% CI) | 0.62 [0.45, 0.84] |
| 1.7.2 IVH Grade 3‐4 | 5 | 6269 | Risk Ratio (M‐H, Fixed, 95% CI) | 0.49 [0.27, 0.88] |
| 1.7.3 IVH diagnosed at postmortem | 2 | 1486 | Risk Ratio (M‐H, Fixed, 95% CI) | 0.60 [0.34, 1.06] |
| 1.8 Mean birthweight (g) Show forest plot | 19 | 9551 | Mean Difference (IV, Fixed, 95% CI) | ‐14.02 [‐33.79, 5.76] |
| 1.9 Maternal death Show forest plot | 6 | 6244 | Risk Ratio (M‐H, Fixed, 95% CI) | 1.19 [0.36, 3.89] |
| 1.10 Chorioamnionitis Show forest plot | 15 | 8374 | Risk Ratio (M‐H, Fixed, 95% CI) | 0.86 [0.69, 1.08] |
| 1.11 Endometritis Show forest plot | 10 | 6764 | Risk Ratio (M‐H, Fixed, 95% CI) | 1.14 [0.82, 1.58] |
| 1.12 Death in childhood Show forest plot | 4 | 1010 | Risk Ratio (M‐H, Fixed, 95% CI) | 0.68 [0.36, 1.27] |
| 1.13 Neurodevelopmental disability in childhood Show forest plot | 5 | Risk Ratio (M‐H, Fixed, 95% CI) | Subtotals only | |
| 1.13.1 Developmental delay | 3 | 600 | Risk Ratio (M‐H, Fixed, 95% CI) | 0.51 [0.27, 0.97] |
| 1.13.2 Intellectual impairment | 3 | 778 | Risk Ratio (M‐H, Fixed, 95% CI) | 0.86 [0.44, 1.69] |
| 1.13.3 Hearing impairment | 2 | 166 | Risk Ratio (M‐H, Fixed, 95% CI) | 0.64 [0.04, 9.87] |
| 1.13.4 Visual impairment | 2 | 166 | Risk Ratio (M‐H, Fixed, 95% CI) | 0.55 [0.24, 1.23] |
| 1.14 Death into adulthood Show forest plot | 1 | 988 | Risk Ratio (M‐H, Fixed, 95% CI) | 1.00 [0.56, 1.81] |
| 1.15 Neurodevelopmental disability in adulthood Show forest plot | 2 | Risk Ratio (M‐H, Fixed, 95% CI) | Subtotals only | |
| 1.15.1 Visual impairment | 1 | 192 | Risk Ratio (M‐H, Fixed, 95% CI) | 0.91 [0.53, 1.55] |
| 1.15.2 Hearing impairment | 1 | 192 | Risk Ratio (M‐H, Fixed, 95% CI) | 0.24 [0.03, 2.03] |
| 1.15.3 Intellectual impairment | 2 | 273 | Risk Ratio (M‐H, Fixed, 95% CI) | 0.24 [0.01, 4.95] |
| 1.16 Fever in women after trial entry requiring the use of antibiotics Show forest plot | 3 | 363 | Risk Ratio (M‐H, Fixed, 95% CI) | 0.66 [0.36, 1.21] |
| 1.17 Intrapartum fever in woman requiring the use of antibiotics Show forest plot | 2 | 319 | Risk Ratio (M‐H, Fixed, 95% CI) | 0.60 [0.15, 2.49] |
| 1.18 Postnatal fever in woman Show forest plot | 5 | 1323 | Risk Ratio (M‐H, Fixed, 95% CI) | 0.92 [0.64, 1.33] |
| 1.19 Admission into adult intensive care unit Show forest plot | 2 | 319 | Risk Ratio (M‐H, Fixed, 95% CI) | 0.74 [0.26, 2.05] |
| 1.20 Side effects of therapy in women Show forest plot | 2 | Risk Ratio (M‐H, Fixed, 95% CI) | Subtotals only | |
| 1.20.1 Any side effects at first dose | 1 | 2825 | Risk Ratio (M‐H, Fixed, 95% CI) | 0.69 [0.59, 0.82] |
| 1.20.2 Dyspnoea | 1 | 2828 | Risk Ratio (M‐H, Fixed, 95% CI) | 0.33 [0.01, 8.15] |
| 1.20.3 Gastrointestinal upset | 1 | 2828 | Risk Ratio (M‐H, Fixed, 95% CI) | 2.99 [0.12, 73.37] |
| 1.20.4 Hyperglycaemia | 1 | 2828 | Risk Ratio (M‐H, Fixed, 95% CI) | 0.33 [0.01, 8.15] |
| 1.20.5 Leucocytosis | 1 | 2828 | Risk Ratio (M‐H, Fixed, 95% CI) | 0.33 [0.01, 8.15] |
| 1.20.6 Migraine | 1 | 2828 | Risk Ratio (M‐H, Fixed, 95% CI) | 1.00 [0.06, 15.93] |
| 1.21 Glucose intolerance Show forest plot | 1 | 123 | Risk Ratio (M‐H, Fixed, 95% CI) | 2.71 [1.14, 6.46] |
| 1.22 Hypertension Show forest plot | 2 | 288 | Risk Ratio (M‐H, Fixed, 95% CI) | 1.03 [0.59, 1.79] |
| 1.23 Apgar < 7 at 5 minutes Show forest plot | 12 | 5727 | Risk Ratio (M‐H, Fixed, 95% CI) | 0.88 [0.78, 0.98] |
| 1.24 Mean interval between trial entry and birth (days) Show forest plot | 3 | 1513 | Mean Difference (IV, Fixed, 95% CI) | 0.23 [‐1.86, 2.32] |
| 1.25 Mean length at birth (cm) Show forest plot | 1 | 2766 | Mean Difference (IV, Fixed, 95% CI) | 0.00 [‐0.37, 0.37] |
| 1.26 Mean head circumference at birth (cm) Show forest plot | 1 | 2766 | Mean Difference (IV, Fixed, 95% CI) | 0.00 [‐0.22, 0.22] |
| 1.27 Small‐for‐gestational age Show forest plot | 5 | 3478 | Risk Ratio (M‐H, Fixed, 95% CI) | 1.11 [0.96, 1.28] |
| 1.28 Admission to neonatal intensive care unit Show forest plot | 9 | 6667 | Risk Ratio (M‐H, Fixed, 95% CI) | 0.96 [0.91, 1.00] |
| 1.29 Need for mechanical ventilation/CPAP Show forest plot | 11 | 4519 | Risk Ratio (M‐H, Fixed, 95% CI) | 0.75 [0.66, 0.84] |
| 1.30 Mean duration of mechanical ventilation/CPAP (days) Show forest plot | 3 | 471 | Mean Difference (IV, Random, 95% CI) | ‐1.91 [‐4.59, 0.76] |
| 1.31 Median (IQR) duration of mechanical ventilation (hours) Show forest plot | 1 | Other data | No numeric data | |
| 1.32 Median (IQR) duration of CPAP (hours) Show forest plot | 1 | Other data | No numeric data | |
| 1.33 Air leak syndrome Show forest plot | 2 | 2965 | Risk Ratio (M‐H, Fixed, 95% CI) | 0.76 [0.32, 1.80] |
| 1.34 Mean duration of oxygen supplementation (hours) Show forest plot | 1 | 73 | Mean Difference (IV, Fixed, 95% CI) | ‐2.86 [‐5.51, ‐0.21] |
| 1.35 Median (IQR) duration of oxygen supplementation (hours) Show forest plot | 1 | Other data | No numeric data | |
| 1.36 Surfactant use Show forest plot | 6 | 6104 | Risk Ratio (M‐H, Fixed, 95% CI) | 0.65 [0.50, 0.85] |
| 1.37 Systemic infection in the first 48 hours of life Show forest plot | 7 | 1708 | Risk Ratio (M‐H, Fixed, 95% CI) | 0.60 [0.41, 0.88] |
| 1.38 Proven infection while in the neonatal intensive care unit Show forest plot | 10 | 5521 | Risk Ratio (M‐H, Fixed, 95% CI) | 0.79 [0.64, 0.98] |
| 1.39 Necrotising enterocolitis Show forest plot | 10 | 4702 | Risk Ratio (M‐H, Fixed, 95% CI) | 0.50 [0.32, 0.78] |
| 1.40 Mean infant HPA axis function (cortisol) Show forest plot | 1 | 27 | Mean Difference (IV, Fixed, 95% CI) | 3.94 [‐3.12, 11.00] |
| 1.40.1 In babies born < 24 hours after 1st dose | 1 | 6 | Mean Difference (IV, Fixed, 95% CI) | 9.00 [‐11.93, 29.93] |
| 1.40.2 In babies born 24‐48 hours after 1st dose | 1 | 10 | Mean Difference (IV, Fixed, 95% CI) | 0.00 [‐8.68, 8.68] |
| 1.40.3 In babies born > 48 hours after 1st dose | 1 | 11 | Mean Difference (IV, Fixed, 95% CI) | 13.00 [‐1.90, 27.90] |
| 1.41 Mean childhood weight (kg) Show forest plot | 2 | 333 | Mean Difference (IV, Fixed, 95% CI) | 0.30 [‐0.39, 1.00] |
| 1.41.1 Liggins | 1 | 250 | Mean Difference (IV, Fixed, 95% CI) | 0.40 [‐0.32, 1.12] |
| 1.41.2 Schutte (females) | 1 | 39 | Mean Difference (IV, Fixed, 95% CI) | ‐2.40 [‐6.55, 1.75] |
| 1.41.3 Schutte (males) | 1 | 44 | Mean Difference (IV, Fixed, 95% CI) | ‐0.10 [‐3.88, 3.68] |
| 1.42 Mean childhood head circumference (cm) Show forest plot | 2 | 328 | Mean Difference (IV, Fixed, 95% CI) | 0.27 [‐0.08, 0.63] |
| 1.42.1 Liggins | 1 | 250 | Mean Difference (IV, Fixed, 95% CI) | 0.30 [‐0.11, 0.71] |
| 1.42.2 Schutte (females) | 1 | 36 | Mean Difference (IV, Fixed, 95% CI) | ‐0.10 [‐1.05, 0.85] |
| 1.42.3 Schutte (males) | 1 | 42 | Mean Difference (IV, Fixed, 95% CI) | 0.60 [‐0.51, 1.71] |
| 1.43 Mean childhood height (cm) Show forest plot | 2 | 334 | Mean Difference (IV, Fixed, 95% CI) | 1.02 [‐0.26, 2.29] |
| 1.43.1 Liggins | 1 | 250 | Mean Difference (IV, Fixed, 95% CI) | 1.00 [‐0.39, 2.39] |
| 1.43.2 Schutte (females) | 1 | 39 | Mean Difference (IV, Fixed, 95% CI) | 1.70 [‐3.08, 6.48] |
| 1.43.3 Schutte (males) | 1 | 45 | Mean Difference (IV, Fixed, 95% CI) | 0.60 [‐3.79, 4.99] |
| 1.44 Mean childhood systolic blood pressure (mmHg) Show forest plot | 1 | 223 | Mean Difference (IV, Fixed, 95% CI) | ‐1.60 [‐4.06, 0.86] |
| 1.45 Cerebral palsy in childhood Show forest plot | 5 | 904 | Risk Ratio (M‐H, Fixed, 95% CI) | 0.60 [0.34, 1.03] |
| 1.46 Behavioural/learning difficulties in childhood Show forest plot | 1 | 90 | Risk Ratio (M‐H, Fixed, 95% CI) | 0.86 [0.35, 2.09] |
| 1.47 Mean adult weight (kg) Show forest plot | 2 | 538 | Mean Difference (IV, Random, 95% CI) | ‐0.83 [‐6.41, 4.76] |
| 1.47.1 Schutte (females) | 1 | 37 | Mean Difference (IV, Random, 95% CI) | ‐6.00 [‐12.93, 0.93] |
| 1.47.2 Schutte (males) | 1 | 43 | Mean Difference (IV, Random, 95% CI) | ‐1.00 [‐9.91, 7.91] |
| 1.47.3 Liggins | 1 | 458 | Mean Difference (IV, Random, 95% CI) | 2.57 [‐0.72, 5.86] |
| 1.48 Mean adult head circumference (cm) Show forest plot | 2 | 537 | Mean Difference (IV, Fixed, 95% CI) | 0.03 [‐0.33, 0.38] |
| 1.48.1 Schutte (females) | 1 | 37 | Mean Difference (IV, Fixed, 95% CI) | 0.00 [‐1.03, 1.03] |
| 1.48.2 Schutte (males) | 1 | 42 | Mean Difference (IV, Fixed, 95% CI) | ‐0.20 [‐1.37, 0.97] |
| 1.48.3 Liggins | 1 | 458 | Mean Difference (IV, Fixed, 95% CI) | 0.06 [‐0.34, 0.46] |
| 1.49 Mean adult height (cm) Show forest plot | 2 | 537 | Mean Difference (IV, Fixed, 95% CI) | 0.91 [‐0.28, 2.10] |
| 1.49.1 Schutte (females) | 1 | 36 | Mean Difference (IV, Fixed, 95% CI) | ‐1.00 [‐5.37, 3.37] |
| 1.49.2 Schutte (males) | 1 | 43 | Mean Difference (IV, Fixed, 95% CI) | 3.00 [‐2.30, 8.30] |
| 1.49.3 Liggins (females) | 1 | 234 | Mean Difference (IV, Fixed, 95% CI) | 1.17 [‐0.65, 2.99] |
| 1.49.4 Liggins (males) | 1 | 224 | Mean Difference (IV, Fixed, 95% CI) | 0.75 [‐1.03, 2.53] |
| 1.50 Mean adult skinfold thickness (log values) Show forest plot | 1 | Mean Difference (IV, Fixed, 95% CI) | Subtotals only | |
| 1.50.1 Triceps | 1 | 456 | Mean Difference (IV, Fixed, 95% CI) | ‐0.02 [‐0.11, 0.07] |
| 1.50.2 Biceps | 1 | 456 | Mean Difference (IV, Fixed, 95% CI) | ‐0.01 [‐0.11, 0.09] |
| 1.50.3 Subscapular | 1 | 441 | Mean Difference (IV, Fixed, 95% CI) | 0.01 [‐0.08, 0.10] |
| 1.50.4 Suprailiac | 1 | 452 | Mean Difference (IV, Fixed, 95% CI) | ‐0.01 [‐0.12, 0.10] |
| 1.51 Abnormal lung function measured as forced vital capacity (adult) Show forest plot | 1 | 383 | Mean Difference (IV, Fixed, 95% CI) | ‐0.70 [‐3.16, 1.76] |
| 1.52 Mean adult systolic blood pressure (mmHg) Show forest plot | 2 | 545 | Mean Difference (IV, Fixed, 95% CI) | ‐0.87 [‐2.81, 1.07] |
| 1.52.1 Schutte (females) | 1 | 38 | Mean Difference (IV, Fixed, 95% CI) | ‐4.00 [‐9.12, 1.12] |
| 1.52.2 Schutte (males) | 1 | 52 | Mean Difference (IV, Fixed, 95% CI) | ‐3.00 [‐7.17, 1.17] |
| 1.52.3 Liggins | 1 | 455 | Mean Difference (IV, Fixed, 95% CI) | 0.55 [‐1.88, 2.98] |
| 1.53 Mean adult insulin (log values) Show forest plot | 1 | Mean Difference (IV, Fixed, 95% CI) | Subtotals only | |
| 1.53.1 Fasting | 1 | 435 | Mean Difference (IV, Fixed, 95% CI) | 0.08 [‐0.03, 0.19] |
| 1.53.2 30 minutes fasting following a 75 g oral glucose tolerance test | 1 | 412 | Mean Difference (IV, Fixed, 95% CI) | 0.16 [0.04, 0.28] |
| 1.53.3 120 minutes following a 75 g oral glucose tolerance test | 1 | 428 | Mean Difference (IV, Fixed, 95% CI) | ‐0.10 [‐0.27, 0.07] |
| 1.54 Mean adult glucose Show forest plot | 1 | Mean Difference (IV, Fixed, 95% CI) | Subtotals only | |
| 1.54.1 Fasting | 1 | 432 | Mean Difference (IV, Fixed, 95% CI) | 0.01 [‐0.09, 0.11] |
| 1.54.2 30 minutes fasting following a 75 g oral glucose tolerance test | 1 | 413 | Mean Difference (IV, Fixed, 95% CI) | 0.21 [‐0.12, 0.54] |
| 1.54.3 120 minutes following a 75 g oral glucose tolerance test | 1 | 410 | Mean Difference (IV, Fixed, 95% CI) | ‐0.27 [‐0.52, ‐0.02] |
| 1.55 Mean adult HPA axis function (mean log fasting cortisol) Show forest plot | 1 | 444 | Mean Difference (IV, Fixed, 95% CI) | 0.06 [‐0.02, 0.14] |
| 1.56 Mean age at puberty (years) Show forest plot | 1 | Mean Difference (IV, Fixed, 95% CI) | Subtotals only | |
| 1.56.1 Schutte (females) | 1 | 38 | Mean Difference (IV, Fixed, 95% CI) | 0.00 [‐0.94, 0.94] |
| 1.57 Educational achievement by adulthood (university or polytechnic education) Show forest plot | 1 | 534 | Risk Ratio (M‐H, Fixed, 95% CI) | 0.94 [0.80, 1.10] |
| 1.58 Mean length of antenatal hospitalisation (days) Show forest plot | 2 | 412 | Mean Difference (IV, Fixed, 95% CI) | ‐0.00 [‐0.23, 0.22] |
| 1.59 Length of maternal hospital stay Show forest plot | 4 | Other data | No numeric data | |
| 1.60 Mean length of postnatal hospitalisation (days) Show forest plot | 1 | 218 | Mean Difference (IV, Fixed, 95% CI) | 0.00 [‐1.72, 1.72] |
| 1.61 Mean length of neonatal hospitalisation (days) Show forest plot | 5 | 788 | Mean Difference (IV, Fixed, 95% CI) | 0.18 [‐0.51, 0.87] |
| 1.62 Length of neonatal hospitalisation Show forest plot | 2 | Other data | No numeric data | |
| Outcome or subgroup title | No. of studies | No. of participants | Statistical method | Effect size |
| 2.1 Perinatal death ‐ single or multiple pregnancy Show forest plot | 14 | 9833 | Risk Ratio (M‐H, Fixed, 95% CI) | 0.85 [0.77, 0.93] |
| 2.1.1 In babies born from singleton pregnancies | 7 | 5492 | Risk Ratio (M‐H, Fixed, 95% CI) | 0.83 [0.70, 0.99] |
| 2.1.2 In babies born from multiple pregnancies | 2 | 252 | Risk Ratio (M‐H, Fixed, 95% CI) | 0.71 [0.41, 1.22] |
| 2.1.3 Mixed population | 7 | 4089 | Risk Ratio (M‐H, Fixed, 95% CI) | 0.86 [0.77, 0.96] |
| 2.2 Neonatal death ‐ single or multiple pregnancy Show forest plot | 22 | 10609 | Risk Ratio (M‐H, Fixed, 95% CI) | 0.78 [0.70, 0.87] |
| 2.2.1 In babies born from singleton pregnancies | 13 | 8453 | Risk Ratio (M‐H, Fixed, 95% CI) | 0.80 [0.71, 0.91] |
| 2.2.2 In babies born from multiple pregnancies | 3 | 813 | Risk Ratio (M‐H, Fixed, 95% CI) | 0.76 [0.57, 1.02] |
| 2.2.3 Mixed population | 9 | 1343 | Risk Ratio (M‐H, Fixed, 95% CI) | 0.67 [0.50, 0.90] |
| 2.3 Fetal death ‐ single or multiple pregnancy Show forest plot | 14 | 9833 | Risk Ratio (M‐H, Fixed, 95% CI) | 1.01 [0.83, 1.21] |
| 2.3.1 In babies born from singleton pregnancies | 7 | 5492 | Risk Ratio (M‐H, Fixed, 95% CI) | 1.06 [0.76, 1.46] |
| 2.3.2 In babies born from multiple pregnancies | 2 | 252 | Risk Ratio (M‐H, Fixed, 95% CI) | 0.53 [0.20, 1.40] |
| 2.3.3 Mixed population | 7 | 4089 | Risk Ratio (M‐H, Fixed, 95% CI) | 1.02 [0.80, 1.29] |
| 2.4 Respiratory distress syndrome ‐ single or multiple pregnancy Show forest plot | 26 | 11183 | Risk Ratio (M‐H, Fixed, 95% CI) | 0.71 [0.65, 0.78] |
| 2.4.1 In babies born from singleton pregnancies | 17 | 6731 | Risk Ratio (M‐H, Fixed, 95% CI) | 0.65 [0.57, 0.74] |
| 2.4.2 In babies born from multiple pregnancies | 4 | 323 | Risk Ratio (M‐H, Fixed, 95% CI) | 0.85 [0.61, 1.20] |
| 2.4.3 Mixed population | 9 | 4129 | Risk Ratio (M‐H, Fixed, 95% CI) | 0.79 [0.68, 0.92] |
| 2.5 Intraventricular haemorrhage ‐ single or multiple pregnancy Show forest plot | 12 | 8475 | Risk Ratio (M‐H, Fixed, 95% CI) | 0.58 [0.45, 0.75] |
| 2.5.1 In babies born from singleton pregnancies | 6 | 4494 | Risk Ratio (M‐H, Fixed, 95% CI) | 0.51 [0.35, 0.75] |
| 2.5.2 In babies born from multiple pregnancies | 1 | 150 | Risk Ratio (M‐H, Fixed, 95% CI) | 0.43 [0.08, 2.26] |
| 2.5.3 Mixed population | 6 | 3831 | Risk Ratio (M‐H, Fixed, 95% CI) | 0.67 [0.48, 0.94] |
| Outcome or subgroup title | No. of studies | No. of participants | Statistical method | Effect size |
| 3.1 Perinatal death ‐ intact or ruptured membranes Show forest plot | 14 | 9804 | Risk Ratio (M‐H, Fixed, 95% CI) | 0.85 [0.77, 0.93] |
| 3.1.1 In babies born from pregnancies with intact membranes at 1st dose | 4 | 1332 | Risk Ratio (M‐H, Fixed, 95% CI) | 0.88 [0.71, 1.10] |
| 3.1.2 In babies born from pregnancies with ruptured membranes at 1st dose | 3 | 688 | Risk Ratio (M‐H, Fixed, 95% CI) | 0.62 [0.47, 0.83] |
| 3.1.3 Not reported or mixed population | 8 | 7784 | Risk Ratio (M‐H, Fixed, 95% CI) | 0.87 [0.78, 0.97] |
| 3.2 Neonatal deaths ‐ intact or ruptured membranes Show forest plot | 22 | 10580 | Risk Ratio (M‐H, Fixed, 95% CI) | 0.78 [0.70, 0.87] |
| 3.2.1 In babies born from pregnancies with intact membranes at 1st dose | 4 | 1332 | Risk Ratio (M‐H, Fixed, 95% CI) | 0.79 [0.60, 1.05] |
| 3.2.2 In babies born from pregnancies with ruptured membranes at 1st dose | 7 | 1014 | Risk Ratio (M‐H, Fixed, 95% CI) | 0.62 [0.46, 0.84] |
| 3.2.3 Not reported or mixed population | 12 | 8234 | Risk Ratio (M‐H, Fixed, 95% CI) | 0.81 [0.71, 0.91] |
| 3.3 Fetal death ‐ intact or ruptured membranes Show forest plot | 14 | 9804 | Risk Ratio (M‐H, Fixed, 95% CI) | 1.01 [0.83, 1.22] |
| 3.3.1 In babies born from pregnancies with intact membranes at 1st dose | 4 | 1332 | Risk Ratio (M‐H, Fixed, 95% CI) | 1.09 [0.73, 1.64] |
| 3.3.2 In babies born from pregnancies with ruptured membranes at 1st dose | 3 | 688 | Risk Ratio (M‐H, Fixed, 95% CI) | 0.86 [0.46, 1.61] |
| 3.3.3 Not reported or mixed population | 8 | 7784 | Risk Ratio (M‐H, Fixed, 95% CI) | 1.00 [0.80, 1.26] |
| 3.4 RDS ‐ intact or ruptured membranes Show forest plot | 26 | 11079 | Risk Ratio (M‐H, Fixed, 95% CI) | 0.71 [0.64, 0.78] |
| 3.4.1 In babies born from pregnancies with intact membranes at 1st dose | 8 | 1924 | Risk Ratio (M‐H, Fixed, 95% CI) | 0.60 [0.50, 0.71] |
| 3.4.2 In babies born from pregnancies with ruptured membranes at 1st dose | 10 | 1202 | Risk Ratio (M‐H, Fixed, 95% CI) | 0.72 [0.60, 0.87] |
| 3.4.3 Not reported or mixed population | 13 | 7953 | Risk Ratio (M‐H, Fixed, 95% CI) | 0.76 [0.67, 0.88] |
| 3.5 IVH ‐ intact or ruptured membranes Show forest plot | 12 | 8446 | Risk Ratio (M‐H, Fixed, 95% CI) | 0.58 [0.45, 0.75] |
| 3.5.1 In babies born from pregnancies with intact membranes at 1st dose | 4 | 1332 | Risk Ratio (M‐H, Fixed, 95% CI) | 0.43 [0.28, 0.66] |
| 3.5.2 In babies born from pregnancies with ruptured membranes at 1st dose | 4 | 722 | Risk Ratio (M‐H, Fixed, 95% CI) | 0.47 [0.28, 0.79] |
| 3.5.3 Not reported or mixed population | 5 | 6392 | Risk Ratio (M‐H, Fixed, 95% CI) | 0.94 [0.64, 1.38] |
| 3.6 Birthweight ‐ intact or ruptured membranes Show forest plot | 19 | 9522 | Mean Difference (IV, Fixed, 95% CI) | ‐14.86 [‐34.59, 4.87] |
| 3.6.1 In babies born from pregnancies with intact membranes at 1st dose | 4 | 1301 | Mean Difference (IV, Fixed, 95% CI) | ‐30.27 [‐100.43, 39.89] |
| 3.6.2 In babies born from pregnancies with ruptured membranes at 1st dose | 5 | 835 | Mean Difference (IV, Fixed, 95% CI) | ‐49.72 [‐113.91, 14.46] |
| 3.6.3 Not reported or mixed population | 11 | 7386 | Mean Difference (IV, Fixed, 95% CI) | ‐9.40 [‐31.10, 12.30] |
| 3.7 Chorioamnionitis ‐ intact or ruptured membranes Show forest plot | 15 | 8345 | Risk Ratio (M‐H, Fixed, 95% CI) | 0.87 [0.70, 1.09] |
| 3.7.1 In women with intact membranes at 1st dose | 4 | 1243 | Risk Ratio (M‐H, Fixed, 95% CI) | 0.83 [0.50, 1.40] |
| 3.7.2 In women with ruptured membranes at 1st dose | 7 | 1129 | Risk Ratio (M‐H, Fixed, 95% CI) | 1.03 [0.72, 1.48] |
| 3.7.3 Not reported or mixed population | 5 | 5973 | Risk Ratio (M‐H, Fixed, 95% CI) | 0.77 [0.54, 1.09] |
| 3.8 Endometritis ‐ intact or ruptured membranes Show forest plot | 10 | 6764 | Risk Ratio (M‐H, Fixed, 95% CI) | 1.14 [0.82, 1.58] |
| 3.8.1 In women with intact membranes at 1st dose | 2 | 289 | Risk Ratio (M‐H, Fixed, 95% CI) | 1.10 [0.61, 2.00] |
| 3.8.2 In women with ruptured membranes at 1st dose | 4 | 477 | Risk Ratio (M‐H, Fixed, 95% CI) | 1.11 [0.55, 2.25] |
| 3.8.3 Not reported or mixed population | 5 | 5998 | Risk Ratio (M‐H, Fixed, 95% CI) | 1.17 [0.73, 1.87] |
| Outcome or subgroup title | No. of studies | No. of participants | Statistical method | Effect size |
| 4.1 Perinatal deaths ‐ hypertension syndrome vs other trials Show forest plot | 14 | 9833 | Risk Ratio (M‐H, Fixed, 95% CI) | 0.85 [0.77, 0.93] |
| 4.1.1 Hypertension syndrome | 2 | 313 | Risk Ratio (M‐H, Fixed, 95% CI) | 0.83 [0.57, 1.20] |
| 4.1.2 No hypertension syndrome or hypertension syndromes excluded | 1 | 1123 | Risk Ratio (M‐H, Fixed, 95% CI) | 0.86 [0.67, 1.10] |
| 4.1.3 Hypertension not reported separately | 12 | 8397 | Risk Ratio (M‐H, Fixed, 95% CI) | 0.85 [0.76, 0.94] |
| 4.2 Neonatal deaths ‐ hypertension syndrome vs other trials Show forest plot | 22 | 10609 | Risk Ratio (M‐H, Fixed, 95% CI) | 0.78 [0.70, 0.87] |
| 4.2.1 Hypertension syndrome | 2 | 313 | Risk Ratio (M‐H, Fixed, 95% CI) | 0.48 [0.28, 0.83] |
| 4.2.2 No hypertension syndrome or hypertension syndromes excluded | 1 | 1123 | Risk Ratio (M‐H, Fixed, 95% CI) | 0.90 [0.65, 1.25] |
| 4.2.3 Hypertension not reported separately | 20 | 9173 | Risk Ratio (M‐H, Fixed, 95% CI) | 0.78 [0.70, 0.88] |
| 4.3 Fetal deaths ‐ hypertension syndrome vs other trials Show forest plot | 14 | 9833 | Risk Ratio (M‐H, Fixed, 95% CI) | 1.01 [0.83, 1.22] |
| 4.3.1 Women with hypertension syndrome | 3 | 331 | Risk Ratio (M‐H, Fixed, 95% CI) | 1.73 [0.91, 3.28] |
| 4.3.2 No hypertension syndrome or hypertension syndromes excluded | 2 | 1373 | Risk Ratio (M‐H, Fixed, 95% CI) | 0.74 [0.49, 1.12] |
| 4.3.3 Hypertension not reported separately | 11 | 8129 | Risk Ratio (M‐H, Fixed, 95% CI) | 1.04 [0.83, 1.30] |
| 4.4 Respiratory distress syndrome ‐ hypertension syndrome vs other trials Show forest plot | 26 | 11183 | Risk Ratio (M‐H, Fixed, 95% CI) | 0.71 [0.65, 0.78] |
| 4.4.1 Hypertension syndrome | 5 | 418 | Risk Ratio (M‐H, Fixed, 95% CI) | 0.48 [0.34, 0.69] |
| 4.4.2 No hypertension syndrome or hypertension syndromes excluded | 7 | 2511 | Risk Ratio (M‐H, Fixed, 95% CI) | 0.60 [0.48, 0.74] |
| 4.4.3 Hypertension not reported separately | 19 | 8254 | Risk Ratio (M‐H, Fixed, 95% CI) | 0.78 [0.70, 0.87] |
| Outcome or subgroup title | No. of studies | No. of participants | Statistical method | Effect size |
| 5.1 Perinatal death ‐ type of steroid Show forest plot | 14 | 9833 | Risk Ratio (M‐H, Fixed, 95% CI) | 0.85 [0.77, 0.93] |
| 5.1.1 Dexamethasone | 6 | 4673 | Risk Ratio (M‐H, Fixed, 95% CI) | 0.85 [0.77, 0.95] |
| 5.1.2 Betamethasone | 8 | 5092 | Risk Ratio (M‐H, Fixed, 95% CI) | 0.82 [0.69, 0.99] |
| 5.1.3 Methylprednisolone | 1 | 68 | Risk Ratio (M‐H, Fixed, 95% CI) | 1.54 [0.43, 5.43] |
| 5.2 Neonatal death ‐ type of steroid Show forest plot | 22 | 10609 | Risk Ratio (M‐H, Fixed, 95% CI) | 0.78 [0.70, 0.87] |
| 5.2.1 Dexamethasone | 7 | 4769 | Risk Ratio (M‐H, Fixed, 95% CI) | 0.81 [0.71, 0.91] |
| 5.2.2 Betamethasone | 14 | 5593 | Risk Ratio (M‐H, Fixed, 95% CI) | 0.72 [0.59, 0.89] |
| 5.2.3 Hydrocortisone | 2 | 152 | Risk Ratio (M‐H, Fixed, 95% CI) | 0.55 [0.20, 1.47] |
| 5.2.4 Methylprednisolone | 2 | 95 | Risk Ratio (M‐H, Fixed, 95% CI) | 1.14 [0.42, 3.12] |
| 5.3 Fetal death ‐ type of steroid Show forest plot | 14 | 9833 | Risk Ratio (M‐H, Fixed, 95% CI) | 1.00 [0.83, 1.21] |
| 5.3.1 Dexamethasone | 6 | 4673 | Risk Ratio (M‐H, Fixed, 95% CI) | 0.99 [0.78, 1.25] |
| 5.3.2 Betamethasone | 8 | 5092 | Risk Ratio (M‐H, Fixed, 95% CI) | 1.03 [0.74, 1.42] |
| 5.3.3 Methylprednisolone | 1 | 68 | Risk Ratio (M‐H, Fixed, 95% CI) | 2.00 [0.08, 47.36] |
| 5.4 Respiratory distress syndrome ‐ type of steroid Show forest plot | 26 | 11183 | Risk Ratio (M‐H, Fixed, 95% CI) | 0.72 [0.65, 0.78] |
| 5.4.1 Dexamethasone | 8 | 4963 | Risk Ratio (M‐H, Fixed, 95% CI) | 0.80 [0.70, 0.92] |
| 5.4.2 Betamethasone | 17 | 5973 | Risk Ratio (M‐H, Fixed, 95% CI) | 0.63 [0.55, 0.72] |
| 5.4.3 Hydrocortisone | 2 | 152 | Risk Ratio (M‐H, Fixed, 95% CI) | 0.68 [0.36, 1.28] |
| 5.4.4 Methylprednisolone | 2 | 95 | Risk Ratio (M‐H, Fixed, 95% CI) | 1.12 [0.56, 2.27] |
| 5.5 Moderate/severe respiratory distress syndrome ‐ type of steroid Show forest plot | 7 | 4874 | Risk Ratio (M‐H, Fixed, 95% CI) | 0.70 [0.59, 0.83] |
| 5.5.1 Dexamethasone | 2 | 3166 | Risk Ratio (M‐H, Fixed, 95% CI) | 0.83 [0.67, 1.03] |
| 5.5.2 Betamethasone | 5 | 1655 | Risk Ratio (M‐H, Fixed, 95% CI) | 0.50 [0.37, 0.67] |
| 5.5.3 Hydrocortisone | 1 | 26 | Risk Ratio (M‐H, Fixed, 95% CI) | 1.47 [0.32, 6.63] |
| 5.5.4 Methylprednisolone | 1 | 27 | Risk Ratio (M‐H, Fixed, 95% CI) | 1.18 [0.26, 5.31] |
| 5.6 Chronic lung disease ‐ type of steroid Show forest plot | 5 | 745 | Risk Ratio (M‐H, Random, 95% CI) | 0.86 [0.41, 1.79] |
| 5.6.1 Dexamethasone | 2 | 285 | Risk Ratio (M‐H, Random, 95% CI) | 1.94 [0.41, 9.16] |
| 5.6.2 Betamethasone | 3 | 460 | Risk Ratio (M‐H, Random, 95% CI) | 0.54 [0.21, 1.42] |
| 5.7 IVH ‐ type of steroid Show forest plot | 12 | 8475 | Risk Ratio (M‐H, Fixed, 95% CI) | 0.58 [0.45, 0.75] |
| 5.7.1 Dexamethasone | 4 | 3494 | Risk Ratio (M‐H, Fixed, 95% CI) | 0.78 [0.54, 1.13] |
| 5.7.2 Betamethasone | 8 | 4981 | Risk Ratio (M‐H, Fixed, 95% CI) | 0.48 [0.34, 0.68] |
| 5.8 Birthweight ‐ type of steroid Show forest plot | 19 | 9551 | Mean Difference (IV, Fixed, 95% CI) | ‐14.02 [‐33.79, 5.76] |
| 5.8.1 Dexamethasone | 6 | 3972 | Mean Difference (IV, Fixed, 95% CI) | 3.84 [‐31.09, 38.76] |
| 5.8.2 Betamethasone | 12 | 5401 | Mean Difference (IV, Fixed, 95% CI) | ‐20.40 [‐44.61, 3.81] |
| 5.8.3 Hydrocortisone | 2 | 151 | Mean Difference (IV, Fixed, 95% CI) | ‐146.68 [‐371.30, 77.93] |
| 5.8.4 Methylprednisolone | 1 | 27 | Mean Difference (IV, Fixed, 95% CI) | ‐121.00 [‐430.59, 188.59] |
| 5.9 Chorioamnionitis ‐ type of steroid Show forest plot | 15 | 8374 | Risk Ratio (M‐H, Fixed, 95% CI) | 0.86 [0.69, 1.08] |
| 5.9.1 Dexamethasone | 6 | 3621 | Risk Ratio (M‐H, Fixed, 95% CI) | 1.20 [0.84, 1.71] |
| 5.9.2 Betamethasone | 9 | 4753 | Risk Ratio (M‐H, Fixed, 95% CI) | 0.69 [0.51, 0.93] |
| 5.10 Endometritis ‐ type of steroid Show forest plot | 10 | 6764 | Risk Ratio (M‐H, Fixed, 95% CI) | 1.14 [0.82, 1.58] |
| 5.10.1 Dexamethasone | 4 | 3270 | Risk Ratio (M‐H, Fixed, 95% CI) | 1.63 [0.92, 2.90] |
| 5.10.2 Betamethasone | 6 | 3494 | Risk Ratio (M‐H, Fixed, 95% CI) | 0.95 [0.63, 1.42] |
| Outcome or subgroup title | No. of studies | No. of participants | Statistical method | Effect size |
| 6.1 Perinatal death ‐ decade of trial Show forest plot | 14 | 9833 | Risk Ratio (M‐H, Fixed, 95% CI) | 0.85 [0.77, 0.93] |
| 6.1.1 Trials conducted in 1970s | 5 | 2520 | Risk Ratio (M‐H, Fixed, 95% CI) | 0.88 [0.74, 1.06] |
| 6.1.2 Trials conducted in 1980s | 1 | 77 | Risk Ratio (M‐H, Fixed, 95% CI) | 1.14 [0.59, 2.21] |
| 6.1.3 Trials conducted in 1990s | 3 | 615 | Risk Ratio (M‐H, Fixed, 95% CI) | 0.67 [0.46, 0.97] |
| 6.1.4 Trials conducted in 2000s | 2 | 414 | Risk Ratio (M‐H, Fixed, 95% CI) | 0.46 [0.31, 0.70] |
| 6.1.5 Trials conducted in 2010s | 3 | 6207 | Risk Ratio (M‐H, Fixed, 95% CI) | 0.88 [0.79, 0.99] |
| 6.2 Neonatal death ‐ decade of trial Show forest plot | 22 | 10609 | Risk Ratio (M‐H, Fixed, 95% CI) | 0.78 [0.70, 0.87] |
| 6.2.1 Trials conducted in 1970s | 7 | 2743 | Risk Ratio (M‐H, Fixed, 95% CI) | 0.83 [0.67, 1.04] |
| 6.2.2 Trials conducted in 1980s | 4 | 326 | Risk Ratio (M‐H, Fixed, 95% CI) | 0.90 [0.55, 1.49] |
| 6.2.3 Trials conducted in 1990s | 5 | 788 | Risk Ratio (M‐H, Fixed, 95% CI) | 0.60 [0.40, 0.90] |
| 6.2.4 Trials conducted in 2000s | 2 | 270 | Risk Ratio (M‐H, Fixed, 95% CI) | 0.46 [0.31, 0.66] |
| 6.2.5 Trials conducted in 2010s | 4 | 6482 | Risk Ratio (M‐H, Fixed, 95% CI) | 0.83 [0.72, 0.96] |
| 6.3 Fetal death ‐ decade of trial Show forest plot | 14 | 9833 | Risk Ratio (M‐H, Fixed, 95% CI) | 1.01 [0.83, 1.22] |
| 6.3.1 Trials conducted in 1970s | 5 | 2520 | Risk Ratio (M‐H, Fixed, 95% CI) | 0.95 [0.69, 1.32] |
| 6.3.2 Trials conducted in 1980s | 1 | 77 | Risk Ratio (M‐H, Fixed, 95% CI) | 3.42 [0.37, 31.41] |
| 6.3.3 Trials conducted in 1990s | 3 | 615 | Risk Ratio (M‐H, Fixed, 95% CI) | 1.07 [0.49, 2.36] |
| 6.3.4 Trials conducted in 2000s | 2 | 414 | Risk Ratio (M‐H, Fixed, 95% CI) | 0.92 [0.19, 4.50] |
| 6.3.5 Trials conducted in 2010s | 3 | 6207 | Risk Ratio (M‐H, Fixed, 95% CI) | 1.01 [0.79, 1.30] |
| 6.4 Respiratory distress syndrome ‐ decade of trial Show forest plot | 26 | 11183 | Risk Ratio (M‐H, Fixed, 95% CI) | 0.71 [0.65, 0.78] |
| 6.4.1 Trials conducted in 1970s | 8 | 2823 | Risk Ratio (M‐H, Fixed, 95% CI) | 0.65 [0.54, 0.78] |
| 6.4.2 Trials conducted in 1980s | 4 | 326 | Risk Ratio (M‐H, Fixed, 95% CI) | 0.70 [0.55, 0.88] |
| 6.4.3 Trials conducted in 1990s | 5 | 788 | Risk Ratio (M‐H, Fixed, 95% CI) | 0.77 [0.65, 0.92] |
| 6.4.4 Trials conducted in 2000s | 5 | 845 | Risk Ratio (M‐H, Fixed, 95% CI) | 0.40 [0.26, 0.59] |
| 6.4.5 Trials conducted in 2010s | 4 | 6401 | Risk Ratio (M‐H, Fixed, 95% CI) | 0.82 [0.69, 0.98] |
| 6.5 IVH ‐ decade of trial Show forest plot | 12 | 8475 | Risk Ratio (M‐H, Fixed, 95% CI) | 0.58 [0.45, 0.75] |
| 6.5.1 Trials conducted in 1970s | 1 | 1218 | Risk Ratio (M‐H, Fixed, 95% CI) | 0.61 [0.33, 1.12] |
| 6.5.2 Trials conducted in 1980s | 3 | 510 | Risk Ratio (M‐H, Fixed, 95% CI) | 0.46 [0.26, 0.81] |
| 6.5.3 Trials conducted in 1990s | 4 | 580 | Risk Ratio (M‐H, Fixed, 95% CI) | 0.63 [0.44, 0.90] |
| 6.5.4 Trials conducted in 2000s | 2 | 270 | Risk Ratio (M‐H, Fixed, 95% CI) | 0.33 [0.15, 0.73] |
| 6.5.5 Trials conducted in 2010s | 2 | 5897 | Risk Ratio (M‐H, Fixed, 95% CI) | 2.40 [0.69, 8.31] |
| 6.6 Birthweight ‐ decade of trial Show forest plot | 19 | 9551 | Mean Difference (IV, Fixed, 95% CI) | ‐14.02 [‐33.79, 5.76] |
| 6.6.1 Trials conducted in 1970s | 5 | 1822 | Mean Difference (IV, Fixed, 95% CI) | ‐41.39 [‐110.05, 27.26] |
| 6.6.2 Trials conducted in 1980s | 3 | 280 | Mean Difference (IV, Fixed, 95% CI) | ‐19.60 [‐108.55, 69.35] |
| 6.6.3 Trials conducted in 1990s | 4 | 569 | Mean Difference (IV, Fixed, 95% CI) | ‐33.13 [‐102.39, 36.13] |
| 6.6.4 Trials conducted in 2000s | 3 | 573 | Mean Difference (IV, Fixed, 95% CI) | ‐20.77 [‐61.95, 20.41] |
| 6.6.5 Trials conducted in 2010s | 4 | 6307 | Mean Difference (IV, Fixed, 95% CI) | ‐3.82 [‐30.36, 22.72] |
| 6.7 Chorioamnionitis ‐ decade of trial Show forest plot | 15 | 8374 | Risk Ratio (M‐H, Fixed, 95% CI) | 0.86 [0.69, 1.08] |
| 6.7.1 Trials conducted in 1970s | 2 | 1237 | Risk Ratio (M‐H, Fixed, 95% CI) | 0.74 [0.46, 1.17] |
| 6.7.2 Trials conducted in 1980s | 3 | 276 | Risk Ratio (M‐H, Fixed, 95% CI) | 0.50 [0.25, 1.01] |
| 6.7.3 Trials conducted in 1990s | 5 | 731 | Risk Ratio (M‐H, Fixed, 95% CI) | 1.27 [0.85, 1.89] |
| 6.7.4 Trials conducted in 2000s | 2 | 257 | Risk Ratio (M‐H, Fixed, 95% CI) | 2.02 [0.59, 6.95] |
| 6.7.5 Trials conducted in 2010s | 3 | 5873 | Risk Ratio (M‐H, Fixed, 95% CI) | 0.73 [0.48, 1.11] |
| 6.8 Endometritis ‐ decade of trial Show forest plot | 10 | 6764 | Risk Ratio (M‐H, Fixed, 95% CI) | 1.14 [0.82, 1.58] |
| 6.8.1 Trials conducted in 1970s | 1 | 101 | Risk Ratio (M‐H, Fixed, 95% CI) | 1.02 [0.07, 15.86] |
| 6.8.2 Trials conducted in 1980s | 1 | 71 | Risk Ratio (M‐H, Fixed, 95% CI) | 2.30 [0.88, 6.06] |
| 6.8.3 Trials conducted in 1990s | 4 | 574 | Risk Ratio (M‐H, Fixed, 95% CI) | 0.87 [0.53, 1.44] |
| 6.8.4 Trials conducted in 2000s | 4 | 6018 | Risk Ratio (M‐H, Fixed, 95% CI) | 1.23 [0.75, 2.03] |
| Outcome or subgroup title | No. of studies | No. of participants | Statistical method | Effect size |
| 7.1 Perinatal death ‐ protocol with weekly repeats Show forest plot | 14 | 9833 | Risk Ratio (M‐H, Fixed, 95% CI) | 0.85 [0.77, 0.93] |
| 7.1.1 Single course only | 10 | 6329 | Risk Ratio (M‐H, Fixed, 95% CI) | 0.88 [0.74, 1.04] |
| 7.1.2 Courses including weekly repeats | 4 | 3504 | Risk Ratio (M‐H, Fixed, 95% CI) | 0.83 [0.75, 0.93] |
| 7.2 Neonatal death ‐ protocol with weekly repeats Show forest plot | 22 | 10609 | Risk Ratio (M‐H, Fixed, 95% CI) | 0.78 [0.70, 0.87] |
| 7.2.1 Single course only | 14 | 6636 | Risk Ratio (M‐H, Fixed, 95% CI) | 0.83 [0.68, 1.02] |
| 7.2.2 Courses including weekly repeats | 8 | 3973 | Risk Ratio (M‐H, Fixed, 95% CI) | 0.76 [0.67, 0.86] |
| 7.3 Fetal death ‐ protocol with weekly repeats Show forest plot | 14 | 9833 | Risk Ratio (M‐H, Fixed, 95% CI) | 1.01 [0.83, 1.22] |
| 7.3.1 Single course only | 10 | 6329 | Risk Ratio (M‐H, Fixed, 95% CI) | 0.96 [0.70, 1.31] |
| 7.3.2 Courses including weekly repeats | 4 | 3504 | Risk Ratio (M‐H, Fixed, 95% CI) | 1.04 [0.82, 1.31] |
| 7.4 Respiratory distress syndrome ‐ protocol with weekly repeats Show forest plot | 26 | 11183 | Risk Ratio (M‐H, Fixed, 95% CI) | 0.71 [0.65, 0.78] |
| 7.4.1 Single course only | 18 | 7210 | Risk Ratio (M‐H, Fixed, 95% CI) | 0.73 [0.64, 0.83] |
| 7.4.2 Courses including weekly repeats | 8 | 3973 | Risk Ratio (M‐H, Fixed, 95% CI) | 0.69 [0.60, 0.79] |
| 7.5 Moderate/severe respiratory distress syndrome Show forest plot | 7 | 4874 | Risk Ratio (M‐H, Fixed, 95% CI) | 0.70 [0.59, 0.83] |
| 7.5.1 Single course only | 3 | 1359 | Risk Ratio (M‐H, Fixed, 95% CI) | 0.64 [0.47, 0.88] |
| 7.5.2 Courses including weekly repeats | 4 | 3515 | Risk Ratio (M‐H, Fixed, 95% CI) | 0.72 [0.59, 0.89] |
| 7.6 IVH ‐ protocol with weekly repeats Show forest plot | 12 | 8475 | Risk Ratio (M‐H, Fixed, 95% CI) | 0.58 [0.45, 0.75] |
| 7.6.1 Single course only | 4 | 4502 | Risk Ratio (M‐H, Fixed, 95% CI) | 0.58 [0.37, 0.91] |
| 7.6.2 Courses including weekly repeats | 8 | 3973 | Risk Ratio (M‐H, Fixed, 95% CI) | 0.58 [0.43, 0.79] |
| 7.7 Birthweight ‐ protocol with weekly repeats Show forest plot | 19 | 9551 | Mean Difference (IV, Fixed, 95% CI) | ‐14.02 [‐33.79, 5.76] |
| 7.7.1 Single course only | 14 | 6165 | Mean Difference (IV, Fixed, 95% CI) | ‐20.90 [‐44.39, 2.60] |
| 7.7.2 Courses including weekly repeats | 5 | 3386 | Mean Difference (IV, Fixed, 95% CI) | 2.72 [‐33.92, 39.36] |
| 7.8 Chorioamnionitis ‐ protocol with weekly repeats Show forest plot | 15 | 8374 | Risk Ratio (M‐H, Fixed, 95% CI) | 0.86 [0.69, 1.08] |
| 7.8.1 Single courses only | 7 | 4659 | Risk Ratio (M‐H, Fixed, 95% CI) | 0.83 [0.61, 1.11] |
| 7.8.2 Courses including weekly repeats | 8 | 3715 | Risk Ratio (M‐H, Fixed, 95% CI) | 0.91 [0.65, 1.28] |
| 7.9 Endometritis ‐ protocol with weekly repeats Show forest plot | 10 | 6764 | Risk Ratio (M‐H, Fixed, 95% CI) | 1.14 [0.82, 1.58] |
| 7.9.1 Single courses only | 4 | 3332 | Risk Ratio (M‐H, Fixed, 95% CI) | 0.82 [0.49, 1.39] |
| 7.9.2 Courses including weekly repeats | 6 | 3432 | Risk Ratio (M‐H, Fixed, 95% CI) | 1.43 [0.94, 2.19] |
| Outcome or subgroup title | No. of studies | No. of participants | Statistical method | Effect size |
| 8.1 Perinatal death ‐ gestational age at trial entry Show forest plot | 14 | 9833 | Risk Ratio (M‐H, Fixed, 95% CI) | 0.84 [0.77, 0.92] |
| 8.1.1 Less than or equal to 35 weeks + 0 days | 11 | 6185 | Risk Ratio (M‐H, Fixed, 95% CI) | 0.83 [0.76, 0.91] |
| 8.1.2 Greater than or equal to 34 weeks + 0 days | 4 | 3648 | Risk Ratio (M‐H, Fixed, 95% CI) | 1.70 [0.68, 4.28] |
| 8.2 Neonatal death ‐ gestational age at trial entry Show forest plot | 22 | 10609 | Risk Ratio (M‐H, Fixed, 95% CI) | 0.78 [0.70, 0.86] |
| 8.2.1 Less than or equal to 35 weeks + 0 days | 19 | 6961 | Risk Ratio (M‐H, Fixed, 95% CI) | 0.77 [0.69, 0.86] |
| 8.2.2 Greater than or equal to 34 weeks + 0 days | 4 | 3648 | Risk Ratio (M‐H, Fixed, 95% CI) | 1.51 [0.49, 4.61] |
| 8.3 Fetal death ‐ gestational age at trial entry Show forest plot | 14 | 9833 | Risk Ratio (M‐H, Fixed, 95% CI) | 1.00 [0.83, 1.20] |
| 8.3.1 Less than or equal to 35 weeks + 0 days | 11 | 6185 | Risk Ratio (M‐H, Fixed, 95% CI) | 0.99 [0.81, 1.19] |
| 8.3.2 Greater than or equal to 34 weeks + 0 days | 4 | 3648 | Risk Ratio (M‐H, Fixed, 95% CI) | 1.92 [0.42, 8.82] |
| 8.4 Respiratory distress syndrome ‐ gestational age at trial entry Show forest plot | 26 | 11183 | Risk Ratio (M‐H, Fixed, 95% CI) | 0.71 [0.65, 0.78] |
| 8.4.1 Less than or equal to 35 weeks + 0 days | 20 | 7041 | Risk Ratio (M‐H, Fixed, 95% CI) | 0.70 [0.63, 0.78] |
| 8.4.2 Greater than or equal to 34 weeks + 0 days | 7 | 4142 | Risk Ratio (M‐H, Fixed, 95% CI) | 0.75 [0.60, 0.95] |
| 8.5 IVH ‐ gestational age at trial entry Show forest plot | 12 | 8475 | Risk Ratio (M‐H, Fixed, 95% CI) | 0.58 [0.45, 0.74] |
| 8.5.1 Less than or equal to 35 weeks + 0 days | 11 | 5412 | Risk Ratio (M‐H, Fixed, 95% CI) | 0.56 [0.44, 0.72] |
| 8.5.2 Greater than or equal to 34 weeks + 0 days | 2 | 3063 | Risk Ratio (M‐H, Fixed, 95% CI) | 4.91 [0.24, 102.09] |
| 8.6 Birthweight ‐ gestational age at trial entry Show forest plot | 19 | 9551 | Mean Difference (IV, Fixed, 95% CI) | ‐13.36 [‐32.99, 6.26] |
| 8.6.1 Less than or equal to 35 weeks + 0 days | 13 | 5412 | Mean Difference (IV, Fixed, 95% CI) | ‐9.78 [‐40.81, 21.24] |
| 8.6.2 Greater than or equal to 34 weeks + 0 days | 7 | 4139 | Mean Difference (IV, Fixed, 95% CI) | ‐15.75 [‐41.09, 9.58] |
| 8.7 Chorioamnionitis ‐ gestational age at trial entry Show forest plot | 15 | 8374 | Risk Ratio (M‐H, Fixed, 95% CI) | 0.85 [0.68, 1.07] |
| 8.7.1 Less than or equal to 35 weeks + 0 days | 13 | 5132 | Risk Ratio (M‐H, Fixed, 95% CI) | 0.94 [0.73, 1.20] |
| 8.7.2 Greater than or equal to 34 weeks + 0 days | 3 | 3242 | Risk Ratio (M‐H, Fixed, 95% CI) | 0.58 [0.34, 0.99] |