Concentrado de factor VIIa recombinante versus concentrados derivados de plasma para el tratamiento de las hemorragias agudas en pacientes con hemofilia e inhibidores
Información
- DOI:
- https://doi.org/10.1002/14651858.CD004449.pub4Copiar DOI

- Base de datos:
-
- Cochrane Database of Systematic Reviews
- Versión publicada:
-
- 16 diciembre 2015see what's new
- Tipo:
-
- Intervention
- Etapa:
-
- Review
- Grupo Editorial Cochrane:
-
Grupo Cochrane de Fibrosis quística y enfermedades genéticas
- Copyright:
-
- Copyright © 2020 The Cochrane Collaboration. Published by John Wiley & Sons, Ltd.
Cifras del artículo
Altmetric:
Citado por:
Autores
Contributions of authors
Contributions to the current update:
DM is the lead reviewer and guarantor of the review.
AI and DM screened the search results, screened retrieved papers against inclusion criteria and entered data into RevMan.
KD performed the statistical analysis
DM, AI, and MM drafted the update of the review
MM and AI provided a clinical perspective.
‐‐‐‐‐‐‐‐‐‐‐‐‐‐‐‐‐‐‐‐‐‐‐‐‐‐‐‐‐‐‐‐‐‐‐‐‐‐‐‐‐‐‐‐‐‐‐‐‐‐‐‐‐‐‐‐‐‐‐‐‐‐‐‐‐‐‐‐‐‐‐‐‐‐‐‐‐‐‐‐‐‐‐‐‐‐‐‐‐‐
Contributions for Issue 8, 2010
AI is the lead reviewer and guarantor of the review.
AI and DM screened the search results, screened retrieved papers against inclusion criteria and entered data into RevMan.
AI, DM and MM drafted the update of the review
MM provided a clinical perspective.
‐‐‐‐‐‐‐‐‐‐‐‐‐‐‐‐‐‐‐‐‐‐‐‐‐‐‐‐‐‐‐‐‐‐‐‐‐‐‐‐‐
Review up to Issue 2, 2006
DH was the guarantor of the review.
DH coordinated the review.
DH, MLJ and MM drafted the title.
DH and MM drafted the protocol.
DH and MLJ screened the search results.
DH organised the retrieval of papers.
DH and MLJ screened retrieved papers against inclusion criteria.
DH entered data into RevMan.
DH, SP and MLJ provided a methodological perspective.
MM provided a clinical perspective.
DH and MLJ wrote the review.
SP secured funding for the review.
SP, MLJ, Chris Knight and Jeremy Wight and Elizabeth Currie performed previous work that was the foundation of current study.
Sources of support
Internal sources
-
No sources of support supplied
External sources
-
National Institute for Health Research, UK.
This systematic review was supported by the National Institute for Health Research, via Cochrane Infrastructure funding to the Cochrane Cystic Fibrosis and Genetic Disorders Group.
Declarations of interest
Davide Matino declares no conflict of interest.
Michael Makris has received fees for consultancy and sponsorship to attend scientific meetings from Baxter Healthcare and NovoNordisk.
Kerry Dwan declares no conflict of interest.
Roberto D'Amico declares no conflict of interest.
Alfonso Iorio has acted as paid lecturer and has been reimbursed for participation at International Congresses by both NovoNordisk and Baxter Healthcare.
"When originally published, the authors declared the above conflicts of interest. From 07 April 2020, the following conflicts of interest were declared. These conflicts applied during the period that the review was in preparation."Clarification statement added from the Co‐ordinating Editor on 07 April 2020: This review was found by the Cochrane Funding Arbiters, post‐publication, to be noncompliant with the Cochrane conflict of interest policy, which includes the relevant parts of the Cochrane Commercial Sponsorship Policy. It will be updated by 07 April 2021. The update will have a majority of authors and lead author free of conflicts.
Davdie Matino is the recipient of a Bayer Healthcare Fellowship Project Award. He has also received fees for consultancy and for development of educational presentation from Bayer Healthcare.
Michael Makris has received fees for consultancy and sponsorship to attend scientific meetings from Baxter Healthcare and NovoNordisk.
Kerry Dwan declares no conflict of interest.
Roberto D'Amico declares no conflict of interest.
Alfonso Iorio has acted as paid lecturer and has been reimbursed for participation at International Congresses by both NovoNordisk and Baxter Healthcare (monies received by institution not controlled by AIfonso Iorio).
Acknowledgements
We would like to acknowledge the contributions of Dr Daniel Hind, Dr Myfanwy Lloyd‐Jones and Miss Suzy Paisley who were members of the original review team (along with Dr Michael Makris) and developed the protocol and published the first version of this review. We also thank the authors and sponsors of the included trials for kindly providing the additional data we requested.
Version history
| Published | Title | Stage | Authors | Version |
| 2015 Dec 16 | Recombinant factor VIIa concentrate versus plasma‐derived concentrates for treating acute bleeding episodes in people with haemophilia and inhibitors | Review | Davide Matino, Michael Makris, Kerry Dwan, Roberto D'Amico, Alfonso Iorio | |
| 2010 Aug 04 | Recombinant Factor VIIa concentrate versus plasma derived concentrates for the treatment of acute bleeding episodes in people with haemophilia and inhibitors | Review | Alfonso Iorio, Davide Matino, Roberto D'Amico, Michael Makris | |
| 2004 Apr 19 | Recombinant Factor VIIa concentrate versus plasma derived concentrates for the treatment of acute bleeding episodes in people with Haemophilia A and inhibitors | Review | Daniel Hind, Myfanwy Lloyd‐Jones, Michael Makris, Suzy Paisley | |
| 2003 Aug 26 | Recombinant Factor VIIa concentrate versus plasma derived concentrates for the treatment of acute bleeding episodes in people with Haemophilia A and inhibitors | Protocol | Daniel Hind, Myfanwy Lloyd‐Jones, Michael Makris, Suzy Paisley | |
Differences between protocol and review
The review protocol was modified to include people with haemophilia A and haemophilia B, since no difference exists in the treatment of individuals with inhibitor in the two conditions. Even if most of the individuals with inhibitors are people with haemophilia A (inhibitor occurrence in haemophilia B is much more rare), there is no reason to limit the review to haemophilia A.
Notes
The current review was originally based on a previous systematic review of the management of inhibitors in haemophilia A funded by the London NHS Directorate of Health and Social Care:
Wight J, Lloyd Jones M, Knight C, Paisley S, Currie E. The management of inhibitors in haemophilia A: a systematic review and economic model. London: London NHS Directorate of Health and Social Care, 2002.
Paisley S, Wight J, Currie E, Knight C. The management of inhibitors in haemophilia A: introduction and systematic review of current practice. Haemophilia. 2003;9:405‐417
Wight J, Paisley, S. The epidemiology of inhibitors in haemophilia A: a systematic review. Haemophilia. 2003;9:418‐435.
Wight J, Paisley S, Knight C. Immune tolerance induction in patients with haemophilia A with inhibitors: a systematic review. Haemophilia. 2003;9:436‐463.
Lloyd Jones M, Wight J, Paisley S, Knight C. Control of bleeding in patients with haemophilia A with inhibitors: a systematic review. Haemophilia. 2003;9:464‐520.
Knight C, Paisley S, Wight J, Jones ML. Economic modelling of different treatment strategies for haemophilia A with high responding inhibitors. Haemophilia. 2003;9:521‐540.
Keywords
MeSH
Medical Subject Headings (MeSH) Keywords
- Acute Disease;
- Blood Coagulation Factors [*therapeutic use];
- Factor VIII [immunology, therapeutic use];
- Factor VIIa [*therapeutic use];
- Hemophilia A [blood, *drug therapy];
- Hemophilia B [blood, *drug therapy];
- Hemorrhage [*drug therapy];
- Randomized Controlled Trials as Topic;
- Recombinant Proteins [therapeutic use];
Medical Subject Headings Check Words
Humans;
PICO
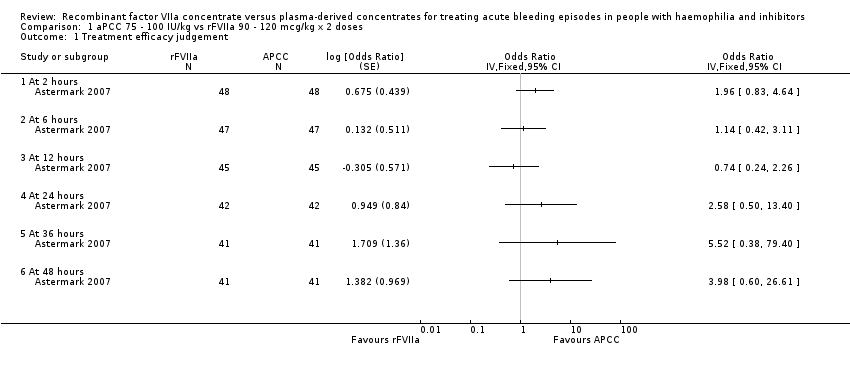
Comparison 1 aPCC 75 ‐ 100 IU/kg vs rFVIIa 90 ‐ 120 mcg/kg x 2 doses, Outcome 1 Treatment efficacy judgement.
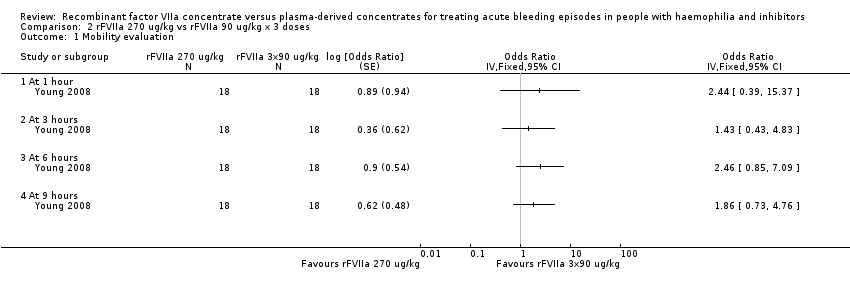
Comparison 2 rFVIIa 270 ug/kg vs rFVIIa 90 ug/kg x 3 doses, Outcome 1 Mobility evaluation.
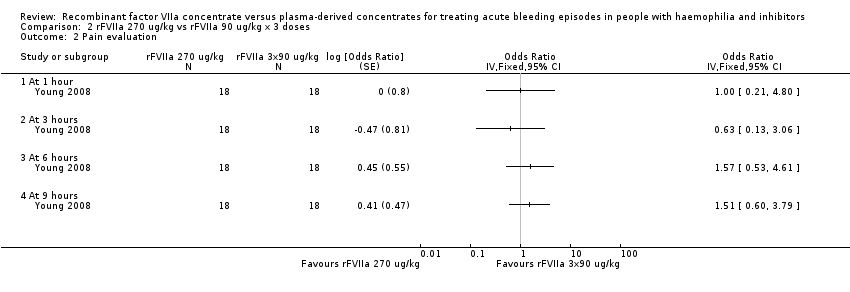
Comparison 2 rFVIIa 270 ug/kg vs rFVIIa 90 ug/kg x 3 doses, Outcome 2 Pain evaluation.
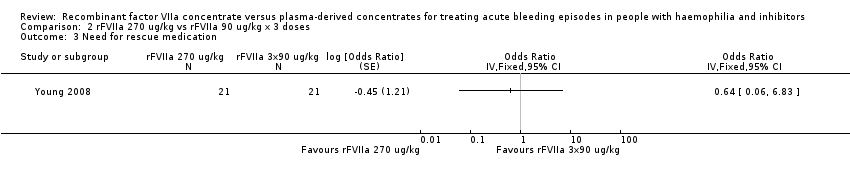
Comparison 2 rFVIIa 270 ug/kg vs rFVIIa 90 ug/kg x 3 doses, Outcome 3 Need for rescue medication.

Comparison 3 rFVIIa 270 ug/kg vs APCC 75 U/kg, Outcome 1 Mobility evaluation.
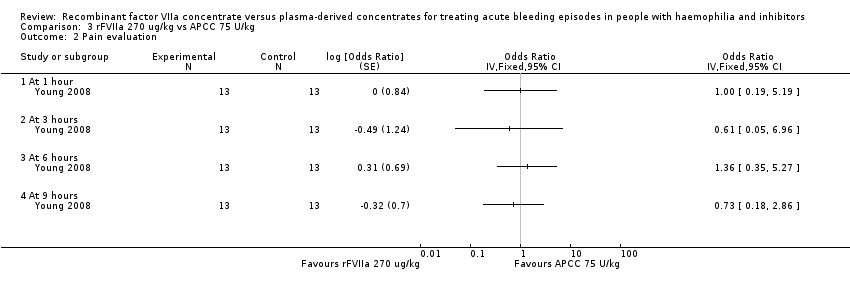
Comparison 3 rFVIIa 270 ug/kg vs APCC 75 U/kg, Outcome 2 Pain evaluation.

Comparison 3 rFVIIa 270 ug/kg vs APCC 75 U/kg, Outcome 3 Need for rescue medication.

Comparison 4 rFVIIa 90 ug/kg x 3 doses vs APCC 75 U/kg, Outcome 1 Mobility evaluation.

Comparison 4 rFVIIa 90 ug/kg x 3 doses vs APCC 75 U/kg, Outcome 2 Pain evaluation.

Comparison 4 rFVIIa 90 ug/kg x 3 doses vs APCC 75 U/kg, Outcome 3 Need for rescue medication.
| Study ID | Hours (pts number) | aPCC n (%) | rFVIIa n (%) | 90% CI of the difference (%) | P value |
| 2 (48) | 36 (75.0) | 29 (60.4) | ‐0.73 to 29.9 | 0.482 | |
| 6 (47) | 38 (80.9) | 37 (78.7) | ‐11.42 to 15.67 | 0.059 | |
| 12 (45) | 38 (80.0) | 38 (84.4) | ‐18.08 to 9.19 | 0.101 | |
| 24 (42) | 40 (95.2) | 36 (85.7) | ‐1.29 to 20.33 | 0.202 | |
| 36 (41) | 41 (100) | 37 (90.2) | 2.13 to 17.38 | 0.129 | |
| 48 (41) | 40 (97.6) | 35 (85.4) | 2.05 to 22.34 | 0.325 | |
| The table reports the number and % of participants who judged the treatment efficacious for any treatment and any time point. The 90% CIs of the difference test the hypothesis of equivalence between the treatments. When considering the difference at 2 hours, it has to be taken into account that this time point is before the administration of the second rFVIIa bolus. aPCC: activated prothrombin complex concentrates | |||||
| Study ID | Hours (number of participants) | aPCC (%) | rFVIIa (%) | 90% CI of the difference (%) | P value |
| 2 (47) | 53.2 | 38.3 | 0.06 to 29.72 | 0.495 | |
| 6 (46) | 76.1 | 65.2 | ‐2.73 to 24.47 | 0.309 | |
| 12 (45) | 77.8 | 75.6 | ‐11.92 to 16.37 | 0.069 | |
| 24 (42) | 90.5 | 85.7 | ‐4.75 to 14.28 | 0.038 | |
| 36 (41) | 95.1 | 87.8 | ‐1.45 to 16.09 | 0.075 | |
| 48 (41) | 95.1 | 92.7 | 4.48 to 9.36 | 0.001 | |
| The table reports the number and % of participants who judged the treatment efficacious for any treatment and any time point. The 90% CIs of the difference test the hypothesis of equivalence between the treatments. When considering the difference at 2 hours, it has to be taken into account that this time point is before the administration of the second rFVIIa bolus. aPCC: activated prothrombin complex concentrates | |||||
| Study ID | Outcome | rFVIIa 270 mcg/kg (N = 24) | rFVIIa 90 mcg/kg x 3 (n = 22) | aPCC 75 IU/kg (n = 22) |
| Positive treatment response (%) | 45.8 | 54.5 | 27.3 | |
| The response was globally evaluated 9 hours after treatment. The positive response were defined as at least 3 positive assessments at 1, 3, 6 and 9 hours. The positive assessment was defined on the base of a 3‐level scale (more pain, no difference, less pain). There were no statistically significant differences between treatments (P = 0.219). aPCC: activated prothrombin complex concentrates | ||||
| Study ID | Outcome | rFVIIa 270 mcg/kg (N = 24) | rFVIIa 90 mcg/kg x 3 (n = 22) | aPCC 75 IU/kg (n = 22) |
| Positive treatment response (%) | 25.0 | 45.5 | 22.7 | |
| The response was globally evaluated 9 hours after treatment. The positive response were defined as at least 3 positive assessments at 1, 3, 6 and 9 hours. The positive assessment was defined on the base of a 3‐level scale (more mobility, no difference, less mobility). There were no statistically significant differences between treatments (P = 0.903). aPCC: activated prothrombin complex concentrates | ||||
| Study ID | Outcome | rFVIIa 270 mcg/kg (n = 24) | rFVIIa 90 mcg/kg x 3 (n = 22) | aPCC 75 IU/kg (n = 22) |
| Participants requiring rescue medication n (%) | 2 (8.3) | 2 (9.1) | 8 (36.4) | |
| Participants with an insufficient treatment response within 6 hours of the first treatment administration were evaluated in the clinic or by phone to consider the use of rescue medication. Rescue medication was defined as additional haemostatic treatment within 9 hours post first administration of trial product. The difference between rFVIIa 270 mcg/kg vs aPCC was statistically significant (P = 0.032). The efficacy difference between the aPCC treatment group and the rFVIIa 90 x 3 mcg/kg did not reach statistical difference (P = 0.069). aPCC: activated prothrombin complex concentrates | ||||
| Outcome or subgroup title | No. of studies | No. of participants | Statistical method | Effect size |
| 1 Treatment efficacy judgement Show forest plot | 1 | Odds Ratio (Fixed, 95% CI) | Totals not selected | |
| 1.1 At 2 hours | 1 | Odds Ratio (Fixed, 95% CI) | 0.0 [0.0, 0.0] | |
| 1.2 At 6 hours | 1 | Odds Ratio (Fixed, 95% CI) | 0.0 [0.0, 0.0] | |
| 1.3 At 12 hours | 1 | Odds Ratio (Fixed, 95% CI) | 0.0 [0.0, 0.0] | |
| 1.4 At 24 hours | 1 | Odds Ratio (Fixed, 95% CI) | 0.0 [0.0, 0.0] | |
| 1.5 At 36 hours | 1 | Odds Ratio (Fixed, 95% CI) | 0.0 [0.0, 0.0] | |
| 1.6 At 48 hours | 1 | Odds Ratio (Fixed, 95% CI) | 0.0 [0.0, 0.0] | |
| Outcome or subgroup title | No. of studies | No. of participants | Statistical method | Effect size |
| 1 Mobility evaluation Show forest plot | 1 | Odds Ratio (Fixed, 95% CI) | Totals not selected | |
| 1.1 At 1 hour | 1 | Odds Ratio (Fixed, 95% CI) | 0.0 [0.0, 0.0] | |
| 1.2 At 3 hours | 1 | Odds Ratio (Fixed, 95% CI) | 0.0 [0.0, 0.0] | |
| 1.3 At 6 hours | 1 | Odds Ratio (Fixed, 95% CI) | 0.0 [0.0, 0.0] | |
| 1.4 At 9 hours | 1 | Odds Ratio (Fixed, 95% CI) | 0.0 [0.0, 0.0] | |
| 2 Pain evaluation Show forest plot | 1 | Odds Ratio (Fixed, 95% CI) | Totals not selected | |
| 2.1 At 1 hour | 1 | Odds Ratio (Fixed, 95% CI) | 0.0 [0.0, 0.0] | |
| 2.2 At 3 hours | 1 | Odds Ratio (Fixed, 95% CI) | 0.0 [0.0, 0.0] | |
| 2.3 At 6 hours | 1 | Odds Ratio (Fixed, 95% CI) | 0.0 [0.0, 0.0] | |
| 2.4 At 9 hours | 1 | Odds Ratio (Fixed, 95% CI) | 0.0 [0.0, 0.0] | |
| 3 Need for rescue medication Show forest plot | 1 | Odds Ratio (Fixed, 95% CI) | Totals not selected | |
| Outcome or subgroup title | No. of studies | No. of participants | Statistical method | Effect size |
| 1 Mobility evaluation Show forest plot | 1 | Odds Ratio (Fixed, 95% CI) | Totals not selected | |
| 1.1 At 6 hours | 1 | Odds Ratio (Fixed, 95% CI) | 0.0 [0.0, 0.0] | |
| 1.2 At 9 hours | 1 | Odds Ratio (Fixed, 95% CI) | 0.0 [0.0, 0.0] | |
| 2 Pain evaluation Show forest plot | 1 | Odds Ratio (Fixed, 95% CI) | Totals not selected | |
| 2.1 At 1 hour | 1 | Odds Ratio (Fixed, 95% CI) | 0.0 [0.0, 0.0] | |
| 2.2 At 3 hours | 1 | Odds Ratio (Fixed, 95% CI) | 0.0 [0.0, 0.0] | |
| 2.3 At 6 hours | 1 | Odds Ratio (Fixed, 95% CI) | 0.0 [0.0, 0.0] | |
| 2.4 At 9 hours | 1 | Odds Ratio (Fixed, 95% CI) | 0.0 [0.0, 0.0] | |
| 3 Need for rescue medication Show forest plot | 1 | Odds Ratio (Fixed, 95% CI) | Totals not selected | |