Scolaris Content Display Scolaris Content Display

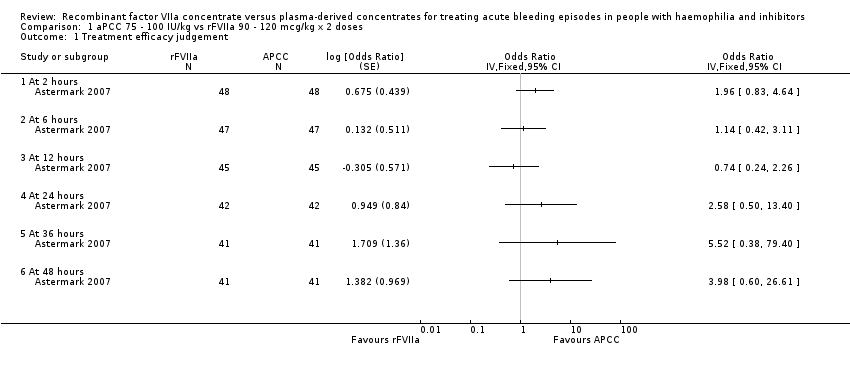
Comparison 1 aPCC 75 ‐ 100 IU/kg vs rFVIIa 90 ‐ 120 mcg/kg x 2 doses, Outcome 1 Treatment efficacy judgement.
Figuras y tablas -
Analysis 1.1

Comparison 1 aPCC 75 ‐ 100 IU/kg vs rFVIIa 90 ‐ 120 mcg/kg x 2 doses, Outcome 1 Treatment efficacy judgement.

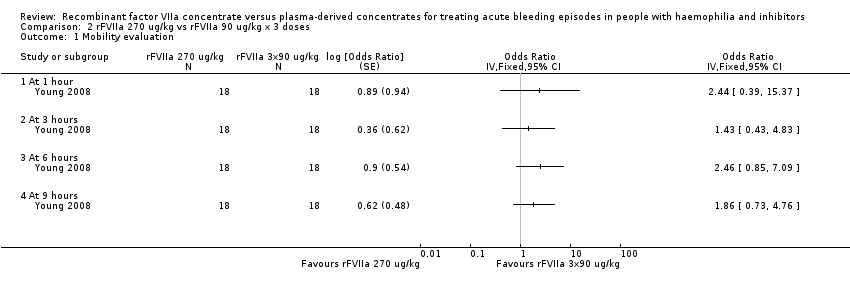
Comparison 2 rFVIIa 270 ug/kg vs rFVIIa 90 ug/kg x 3 doses, Outcome 1 Mobility evaluation.
Figuras y tablas -
Analysis 2.1

Comparison 2 rFVIIa 270 ug/kg vs rFVIIa 90 ug/kg x 3 doses, Outcome 1 Mobility evaluation.

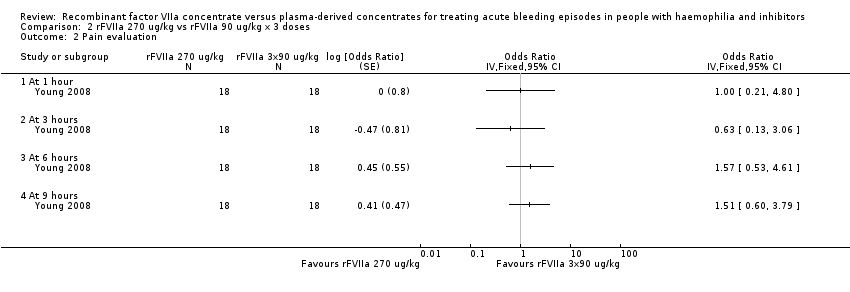
Comparison 2 rFVIIa 270 ug/kg vs rFVIIa 90 ug/kg x 3 doses, Outcome 2 Pain evaluation.
Figuras y tablas -
Analysis 2.2

Comparison 2 rFVIIa 270 ug/kg vs rFVIIa 90 ug/kg x 3 doses, Outcome 2 Pain evaluation.

Comparison 2 rFVIIa 270 ug/kg vs rFVIIa 90 ug/kg x 3 doses, Outcome 3 Need for rescue medication.
Figuras y tablas -
Analysis 2.3

Comparison 2 rFVIIa 270 ug/kg vs rFVIIa 90 ug/kg x 3 doses, Outcome 3 Need for rescue medication.

Comparison 3 rFVIIa 270 ug/kg vs APCC 75 U/kg, Outcome 1 Mobility evaluation.
Figuras y tablas -
Analysis 3.1

Comparison 3 rFVIIa 270 ug/kg vs APCC 75 U/kg, Outcome 1 Mobility evaluation.

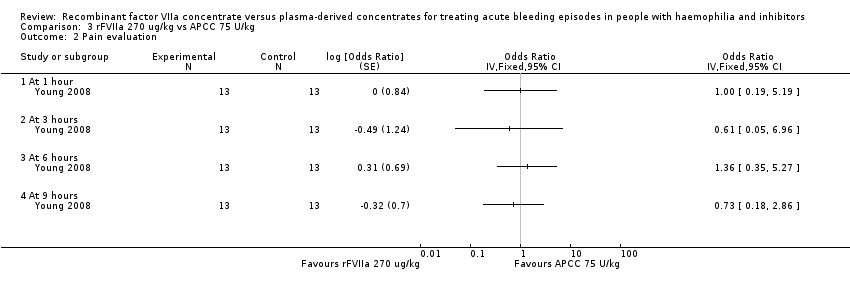
Comparison 3 rFVIIa 270 ug/kg vs APCC 75 U/kg, Outcome 2 Pain evaluation.
Figuras y tablas -
Analysis 3.2

Comparison 3 rFVIIa 270 ug/kg vs APCC 75 U/kg, Outcome 2 Pain evaluation.

Comparison 3 rFVIIa 270 ug/kg vs APCC 75 U/kg, Outcome 3 Need for rescue medication.
Figuras y tablas -
Analysis 3.3

Comparison 3 rFVIIa 270 ug/kg vs APCC 75 U/kg, Outcome 3 Need for rescue medication.

Comparison 4 rFVIIa 90 ug/kg x 3 doses vs APCC 75 U/kg, Outcome 1 Mobility evaluation.
Figuras y tablas -
Analysis 4.1

Comparison 4 rFVIIa 90 ug/kg x 3 doses vs APCC 75 U/kg, Outcome 1 Mobility evaluation.

Comparison 4 rFVIIa 90 ug/kg x 3 doses vs APCC 75 U/kg, Outcome 2 Pain evaluation.
Figuras y tablas -
Analysis 4.2

Comparison 4 rFVIIa 90 ug/kg x 3 doses vs APCC 75 U/kg, Outcome 2 Pain evaluation.

Comparison 4 rFVIIa 90 ug/kg x 3 doses vs APCC 75 U/kg, Outcome 3 Need for rescue medication.
Figuras y tablas -
Analysis 4.3

Comparison 4 rFVIIa 90 ug/kg x 3 doses vs APCC 75 U/kg, Outcome 3 Need for rescue medication.

Table 1. aPCC 75‐100 IU/kg vs rFVIIa 90 ‐ 120 mcg/kg x 2 doses ‐ Treatment efficacy judgement

Study ID

Hours (pts number)

aPCC n (%)

rFVIIa n (%)

90% CI of the difference (%)

P value

Astermark 2007

2 (48)

36 (75.0)

29 (60.4)

‐0.73 to 29.9

0.482

6 (47)

38 (80.9)

37 (78.7)

‐11.42 to 15.67

0.059

12 (45)

38 (80.0)

38 (84.4)

‐18.08 to 9.19

0.101

24 (42)

40 (95.2)

36 (85.7)

‐1.29 to 20.33

0.202

36 (41)

41 (100)

37 (90.2)

2.13 to 17.38

0.129

48 (41)

40 (97.6)

35 (85.4)

2.05 to 22.34

0.325

The table reports the number and % of participants who judged the treatment efficacious for any treatment and any time point. The 90% CIs of the difference test the hypothesis of equivalence between the treatments. When considering the difference at 2 hours, it has to be taken into account that this time point is before the administration of the second rFVIIa bolus.

aPCC: activated prothrombin complex concentrates
CI: confidence interval
rFVIIa: recombinant factor VIIa

Figuras y tablas -
Table 1. aPCC 75‐100 IU/kg vs rFVIIa 90 ‐ 120 mcg/kg x 2 doses ‐ Treatment efficacy judgement
Table 2. aPCC 75 ‐ 100 IU/kg vs rFVIIa 90 ‐ 120 mcg/kg x 2 doses ‐ Bleeding stop

Study ID

Hours (number of participants)

aPCC (%)

rFVIIa (%)

90% CI of the difference (%)

P value

Astermark 2007

2 (47)

53.2

38.3

0.06 to 29.72

0.495

6 (46)

76.1

65.2

‐2.73 to 24.47

0.309

12 (45)

77.8

75.6

‐11.92 to 16.37

0.069

24 (42)

90.5

85.7

‐4.75 to 14.28

0.038

36 (41)

95.1

87.8

‐1.45 to 16.09

0.075

48 (41)

95.1

92.7

4.48 to 9.36

0.001

The table reports the number and % of participants who judged the treatment efficacious for any treatment and any time point. The 90% CIs of the difference test the hypothesis of equivalence between the treatments. When considering the difference at 2 hours, it has to be taken into account that this time point is before the administration of the second rFVIIa bolus.

aPCC: activated prothrombin complex concentrates
CI: confidence interval
rFVIIa: recombinant factor VIIa

Figuras y tablas -
Table 2. aPCC 75 ‐ 100 IU/kg vs rFVIIa 90 ‐ 120 mcg/kg x 2 doses ‐ Bleeding stop
Table 3. aPCC 75 IU/kg vs rFVIIa 270 mcg/kg vs rFVIIa 90 mcg/kg x 3 doses ‐ Pain scale

Study ID

Outcome

rFVIIa 270 mcg/kg

(N = 24)

rFVIIa 90 mcg/kg x 3

(n = 22)

aPCC 75 IU/kg

(n = 22)

Young 2008

Positive treatment response (%)

45.8

54.5

27.3

The response was globally evaluated 9 hours after treatment. The positive response were defined as at least 3 positive assessments at 1, 3, 6 and 9 hours. The positive assessment was defined on the base of a 3‐level scale (more pain, no difference, less pain). There were no statistically significant differences between treatments (P = 0.219).

aPCC: activated prothrombin complex concentrates
rFVIIa: recombinant factor VIIa

Figuras y tablas -
Table 3. aPCC 75 IU/kg vs rFVIIa 270 mcg/kg vs rFVIIa 90 mcg/kg x 3 doses ‐ Pain scale
Table 4. aPCC 75 IU/kg vs rFVIIa 270 mcg/kg vs rFVIIa 90 mcg/kg x 3 doses ‐ Mobility scale

Study ID

Outcome

rFVIIa 270 mcg/kg

(N = 24)

rFVIIa 90 mcg/kg x 3

(n = 22)

aPCC 75 IU/kg

(n = 22)

Young 2008

Positive treatment response (%)

25.0

45.5

22.7

The response was globally evaluated 9 hours after treatment. The positive response were defined as at least 3 positive assessments at 1, 3, 6 and 9 hours. The positive assessment was defined on the base of a 3‐level scale (more mobility, no difference, less mobility). There were no statistically significant differences between treatments (P = 0.903).

aPCC: activated prothrombin complex concentrates
rFVIIa: recombinant factor VIIa

Figuras y tablas -
Table 4. aPCC 75 IU/kg vs rFVIIa 270 mcg/kg vs rFVIIa 90 mcg/kg x 3 doses ‐ Mobility scale
Table 5. aPCC 75 IU/kg vs rFVIIa 270 mcg/kg vs rFVIIa 90 mcg/kg x 3 doses ‐ Rescue medication use

Study ID

Outcome

rFVIIa 270 mcg/kg

(n = 24)

rFVIIa 90 mcg/kg x 3

(n = 22)

aPCC 75 IU/kg

(n = 22)

Young 2008

Participants requiring rescue medication n (%)

2 (8.3)

2 (9.1)

8 (36.4)

Participants with an insufficient treatment response within 6 hours of the first treatment administration were evaluated in the clinic or by phone to consider the use of rescue medication. Rescue medication was defined as additional haemostatic treatment within 9 hours post first administration of trial product. The difference between rFVIIa 270 mcg/kg vs aPCC was statistically significant (P = 0.032). The efficacy difference between the aPCC treatment group and the rFVIIa 90 x 3 mcg/kg did not reach statistical difference (P = 0.069).

aPCC: activated prothrombin complex concentrates
rFVIIa: recombinant factor VIIa

Figuras y tablas -
Table 5. aPCC 75 IU/kg vs rFVIIa 270 mcg/kg vs rFVIIa 90 mcg/kg x 3 doses ‐ Rescue medication use
Comparison 1. aPCC 75 ‐ 100 IU/kg vs rFVIIa 90 ‐ 120 mcg/kg x 2 doses

Outcome or subgroup title

No. of studies

No. of participants

Statistical method

Effect size

1 Treatment efficacy judgement Show forest plot

1

Odds Ratio (Fixed, 95% CI)

Totals not selected

1.1 At 2 hours

1

Odds Ratio (Fixed, 95% CI)

0.0 [0.0, 0.0]

1.2 At 6 hours

1

Odds Ratio (Fixed, 95% CI)

0.0 [0.0, 0.0]

1.3 At 12 hours

1

Odds Ratio (Fixed, 95% CI)

0.0 [0.0, 0.0]

1.4 At 24 hours

1

Odds Ratio (Fixed, 95% CI)

0.0 [0.0, 0.0]

1.5 At 36 hours

1

Odds Ratio (Fixed, 95% CI)

0.0 [0.0, 0.0]

1.6 At 48 hours

1

Odds Ratio (Fixed, 95% CI)

0.0 [0.0, 0.0]

Figuras y tablas -
Comparison 1. aPCC 75 ‐ 100 IU/kg vs rFVIIa 90 ‐ 120 mcg/kg x 2 doses
Comparison 2. rFVIIa 270 ug/kg vs rFVIIa 90 ug/kg x 3 doses

Outcome or subgroup title

No. of studies

No. of participants

Statistical method

Effect size

1 Mobility evaluation Show forest plot

1

Odds Ratio (Fixed, 95% CI)

Totals not selected

1.1 At 1 hour

1

Odds Ratio (Fixed, 95% CI)

0.0 [0.0, 0.0]

1.2 At 3 hours

1

Odds Ratio (Fixed, 95% CI)

0.0 [0.0, 0.0]

1.3 At 6 hours

1

Odds Ratio (Fixed, 95% CI)

0.0 [0.0, 0.0]

1.4 At 9 hours

1

Odds Ratio (Fixed, 95% CI)

0.0 [0.0, 0.0]

2 Pain evaluation Show forest plot

1

Odds Ratio (Fixed, 95% CI)

Totals not selected

2.1 At 1 hour

1

Odds Ratio (Fixed, 95% CI)

0.0 [0.0, 0.0]

2.2 At 3 hours

1

Odds Ratio (Fixed, 95% CI)

0.0 [0.0, 0.0]

2.3 At 6 hours

1

Odds Ratio (Fixed, 95% CI)

0.0 [0.0, 0.0]

2.4 At 9 hours

1

Odds Ratio (Fixed, 95% CI)

0.0 [0.0, 0.0]

3 Need for rescue medication Show forest plot

1

Odds Ratio (Fixed, 95% CI)

Totals not selected

Figuras y tablas -
Comparison 2. rFVIIa 270 ug/kg vs rFVIIa 90 ug/kg x 3 doses
Comparison 3. rFVIIa 270 ug/kg vs APCC 75 U/kg

Outcome or subgroup title

No. of studies

No. of participants

Statistical method

Effect size

1 Mobility evaluation Show forest plot

1

Odds Ratio (Fixed, 95% CI)

Totals not selected

1.1 At 6 hours

1

Odds Ratio (Fixed, 95% CI)

0.0 [0.0, 0.0]

1.2 At 9 hours

1

Odds Ratio (Fixed, 95% CI)

0.0 [0.0, 0.0]

2 Pain evaluation Show forest plot

1

Odds Ratio (Fixed, 95% CI)

Totals not selected

2.1 At 1 hour

1

Odds Ratio (Fixed, 95% CI)

0.0 [0.0, 0.0]

2.2 At 3 hours

1

Odds Ratio (Fixed, 95% CI)

0.0 [0.0, 0.0]

2.3 At 6 hours

1

Odds Ratio (Fixed, 95% CI)

0.0 [0.0, 0.0]

2.4 At 9 hours

1

Odds Ratio (Fixed, 95% CI)

0.0 [0.0, 0.0]

3 Need for rescue medication Show forest plot

1

Odds Ratio (Fixed, 95% CI)

Totals not selected

Figuras y tablas -
Comparison 3. rFVIIa 270 ug/kg vs APCC 75 U/kg
Comparison 4. rFVIIa 90 ug/kg x 3 doses vs APCC 75 U/kg

Outcome or subgroup title

No. of studies

No. of participants

Statistical method

Effect size

1 Mobility evaluation Show forest plot

1

Odds Ratio (Fixed, 95% CI)

Totals not selected

1.1 At 6 hours

1

Odds Ratio (Fixed, 95% CI)

0.0 [0.0, 0.0]

1.2 At 9 hours

1

Odds Ratio (Fixed, 95% CI)

0.0 [0.0, 0.0]

2 Pain evaluation Show forest plot

1

Odds Ratio (Fixed, 95% CI)

Totals not selected

2.1 At 1 hour

1

Odds Ratio (Fixed, 95% CI)

0.0 [0.0, 0.0]

2.2 At 3 hours

1

Odds Ratio (Fixed, 95% CI)

0.0 [0.0, 0.0]

2.3 At 6 hours

1

Odds Ratio (Fixed, 95% CI)

0.0 [0.0, 0.0]

2.4 At 9 hours

1

Odds Ratio (Fixed, 95% CI)

0.0 [0.0, 0.0]

3 Need for rescue medication Show forest plot

1

Odds Ratio (Fixed, 95% CI)

Totals not selected

Figuras y tablas -
Comparison 4. rFVIIa 90 ug/kg x 3 doses vs APCC 75 U/kg