Endothelin receptor antagonists for pulmonary arterial hypertension
Información
- DOI:
- https://doi.org/10.1002/14651858.CD004434.pub6Copiar DOI

- Base de datos:
-
- Cochrane Database of Systematic Reviews
- Versión publicada:
-
- 25 marzo 2021see what's new
- Tipo:
-
- Intervention
- Etapa:
-
- Review
- Grupo Editorial Cochrane:
-
Grupo Cochrane de Vías respiratorias
- Copyright:
-
- Copyright © 2021 The Cochrane Collaboration. Published by John Wiley & Sons, Ltd.
Cifras del artículo
Altmetric:
Citado por:
Autores
Contributions of authors
CL: protocol initiation, study assessment, data extraction and entry, interpretation and write‐up. Overall responsibility for maintaining the review.
JC: protocol development, study assessment, data extraction, interpretation and write‐up.
YG: study assessment, data extraction, interpretation and write‐up.
BD: study assessment, interpretation and write‐up.
KL: study assessment, interpretation and write‐up.
Contributions of editorial team
Chris Cates (Coordinating Editor) checked the data entry prior to the full write‐up of the review; edited the protocol; advised on methodology; and approved the protocol prior to publication.
Hayley Barnes (Contact Editor): edited the review; advised on methodology, interpretation, and content.
Emma Dennett (Managing Editor): co‐ordinated the editorial process; advised on interpretation and content; edited the review.
Emma Jackson (Assistant Managing Editor): conducted peer review; edited the reference and other sections of the protocol and the review.
Elizabeth Stovold (Information Specialist): designed the search strategy; ran the searches; edited the Search methods section.
Sources of support
Internal sources
-
All authors, Other
The authors declare that no such funding was received for this systematic review.
External sources
-
Wold Health Organization (WHO), Other
WHO sponsored Dr Chao Liu to receive evidence‐based practice training at Monash University in Australia.
Declarations of interest
This systematic review was supported by a grant from the World Health Organization whilst CL was in residence at the Australasian Cochrane Centre. Dr Chao Liu participated in training from the Australasian Cochrane Centre (including the Cochrane Review Completion Program) whilst in Australia.
Chao Liu: none known
Junmin Chen: none known
Yanqiu Gao: none known
Bao Deng: none known
Kunshen Liu: none known
Acknowledgements
We wish to thank the editorial staff of Cochrane Airways for their support. We would also like to thank Dr Sally Green, Ms Denise O'Connor, Mr Steve McDonald, Janet Piehl and other staff in the Australasian Cochrane Centre for their supervision and technical assistance in the progress of writing this review. We are also grateful to Dr Elmer Villanueva for excellent statistical assistance.
The authors and Airways Editorial Team are grateful to Theo Trandafirescu, Mount Sinai Medical Center for his peer review, as well as another peer reviewer who wishes to remain anonymous.
The Background and Methods sections of this review are based on a standard template used by Cochrane Airways.
This project was supported by the National Institute for Health Research (NIHR), via Cochrane Infrastructure funding to the Cochrane Airways Group. The views and opinions expressed therein are those of the authors and do not necessarily reflect those of the Systematic Reviews Programme, NIHR, NHS, or the Department of Health.
Version history
| Published | Title | Stage | Authors | Version |
| 2021 Mar 25 | Endothelin receptor antagonists for pulmonary arterial hypertension | Review | Chao Liu, Junmin Chen, Yanqiu Gao, Bao Deng, Kunshen Liu | |
| 2013 Feb 28 | Endothelin receptor antagonists for pulmonary arterial hypertension | Review | Chao Liu, Junmin Chen, Yanqiu Gao, Bao Deng, Kunshen Liu | |
| 2009 Jul 08 | Endothelin receptor antagonists for pulmonary arterial hypertension | Review | Chao Liu, Junmin Chen, Yanqiu Gao, Bao Deng, Kunshen Liu | |
| 2006 Jul 19 | Endothelin receptor antagonists for pulmonary arterial hypertension | Review | Chao Liu, Junmin Chen | |
| 2004 Oct 18 | Endothelin receptor antagonists for pulmonary arterial hypertension | Review | Chao Liu, Junmin Chen | |
| 2003 Jul 21 | Endothelin receptor antagonists for pulmonary arterial hypertension | Protocol | Chao Liu, Junmin Chen | |
Differences between protocol and review
The previous version of this review stated that studies would be excluded if the participants were not taking anticoagulants. This is no longer recommended, therefore we have removed this restriction, and included both studies of participants who were not taking anticoagulants as well as those who were.
Keywords
MeSH
Medical Subject Headings (MeSH) Keywords
Medical Subject Headings Check Words
Humans;
PICO
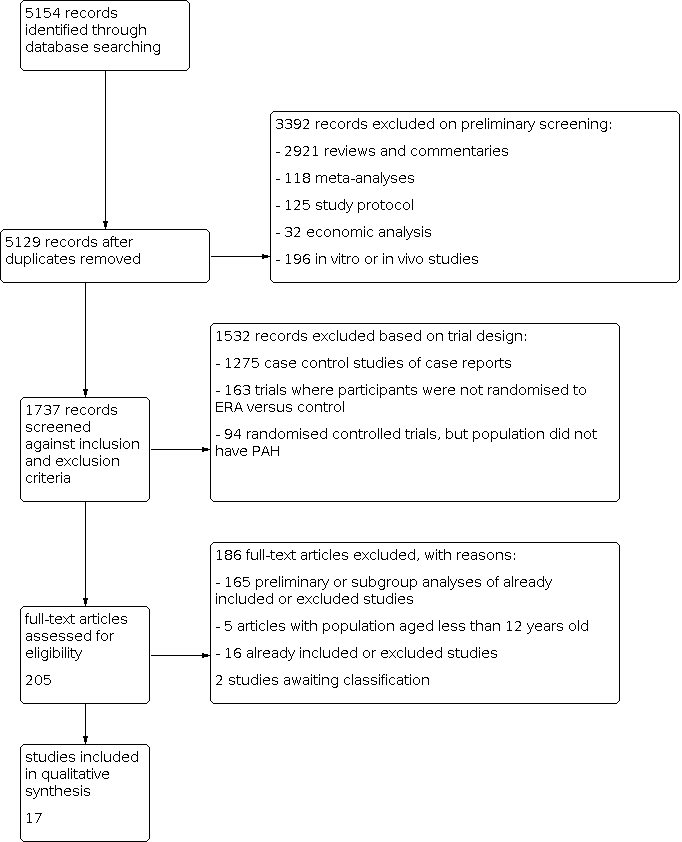
Study flow diagram.

'Risk of bias' summary: review authors' judgements about each risk of bias item for each included study.

Comparison 1: Endothelin receptor antagonists versus placebo, Outcome 1: Change from baseline in 6‐minute walk

Comparison 1: Endothelin receptor antagonists versus placebo, Outcome 2: Proportion of participants with improved functional class

Comparison 1: Endothelin receptor antagonists versus placebo, Outcome 3: Proportion of participants with deteriorated functional class

Comparison 1: Endothelin receptor antagonists versus placebo, Outcome 4: Change from baseline in Borg dyspnoea index

Comparison 1: Endothelin receptor antagonists versus placebo, Outcome 5: Mortality

Comparison 1: Endothelin receptor antagonists versus placebo, Outcome 6: Change from baseline in mean pulmonary artery pressure

Comparison 1: Endothelin receptor antagonists versus placebo, Outcome 7: Change from baseline in pulmonary vascular resistance

Comparison 1: Endothelin receptor antagonists versus placebo, Outcome 8: Pulmonary vascular resistance

Comparison 1: Endothelin receptor antagonists versus placebo, Outcome 9: Ratio of geometric mean PVR

Comparison 1: Endothelin receptor antagonists versus placebo, Outcome 10: Change from baseline in cardiac index

Comparison 1: Endothelin receptor antagonists versus placebo, Outcome 11: Change from baseline in SpO 2

Comparison 1: Endothelin receptor antagonists versus placebo, Outcome 12: Hepatic toxicity

Comparison 2: Endothelin receptor antagonists versus PDE5 inhibitor, Outcome 1: 6‐minute walk

Comparison 2: Endothelin receptor antagonists versus PDE5 inhibitor, Outcome 2: Proportion of participants with improved functional class

Comparison 2: Endothelin receptor antagonists versus PDE5 inhibitor, Outcome 3: Proportion of participants with deteriorated functional class

Comparison 2: Endothelin receptor antagonists versus PDE5 inhibitor, Outcome 4: Symptoms

Comparison 2: Endothelin receptor antagonists versus PDE5 inhibitor, Outcome 5: Mortality

Comparison 2: Endothelin receptor antagonists versus PDE5 inhibitor, Outcome 6: Cardiac index

Comparison 3: Endothelin receptor antagonists in Eisenmenger syndrome, Outcome 1: Change from baseline in 6‐minute walk

Comparison 3: Endothelin receptor antagonists in Eisenmenger syndrome, Outcome 2: Proportion of participants with improved functional class

Comparison 3: Endothelin receptor antagonists in Eisenmenger syndrome, Outcome 3: Proportion of participants with deteriorated functional class

Comparison 3: Endothelin receptor antagonists in Eisenmenger syndrome, Outcome 4: Mortality

Comparison 3: Endothelin receptor antagonists in Eisenmenger syndrome, Outcome 5: Change from baseline in mean pulmonary arterial pressure

Comparison 3: Endothelin receptor antagonists in Eisenmenger syndrome, Outcome 6: Change from baseline in pulmonary vascular resistance

Comparison 3: Endothelin receptor antagonists in Eisenmenger syndrome, Outcome 7: Change from baseline in SpO 2
| Endothelin receptor antagonists compared to placebo for pulmonary arterial hypertension | ||||||
| Participant or population: pulmonary arterial hypertension | ||||||
| Outcomes | Anticipated absolute effects* (95% CI) | Relative effect | № of participants | Certainty of the evidence | Comments | |
|---|---|---|---|---|---|---|
| Risk with placebo | Risk with endothelin receptor antagonists | |||||
| Change from baseline in 6MWD (m) mean duration of study 16.3 weeks | The weighted mean change on control was −4.56 m. | MD 25.06 higher | ‐ | 2739 | ⊕⊕⊕⊝ | Higher is better for 6MWD. |
| Proportion of participants with improved functional class mean duration of study 16.8 weeks | 175 per 1000 | 230 per 1000 | OR 1.41 | 3060 | ⊕⊕⊕⊝ | Participants with high OR are more likely to achieve functional improvement. |
| Change from baseline in BDI mean duration of study 14.3 weeks | The weighted mean change on control was 0.25 higher. | MD 0.43 lower | ‐ | 788 | ⊕⊕⊝⊝Low2 | Symptoms are worse with higher score of BDI. |
| Mortality mean duration of study 30.2 weeks | 73 per 1000 | 58 per 1000 | OR 0.78 | 2889 | ⊕⊕⊝⊝ | Participants with lower OR are less likely to die. |
| Change from baseline in mean PAP (mmHg) mean duration of study 17.1 weeks | The weighted mean change on control was 0.53 higher. | MD 4.65 lower | ‐ | 729 | ⊕⊕⊕⊝ | Participants are worse with higher pulmonary artery pressure. |
| Change from baseline in PVR (dyn/s/cm5) mean duration of study 15.7 weeks | The weighted mean change on control was 63.55 higher. | MD 236.24 lower | ‐ | 586 | ⊕⊕⊕⊝ | Participants are worse with higher pulmonary vascular resistance. |
| Hepatic toxicity mean duration of study 25 weeks | 37 per 1000 | 67 per 1000 | OR 1.88 | 2250 | ⊕⊕⊕⊝ | Participants with higher OR are more likely to suffer hepatic toxicity. |
| *The risk in the intervention group (and its 95% confidence interval) is based on the assumed risk in the comparison group and the relative effect of the intervention (and its 95% CI). | ||||||
| GRADE Working Group grades of evidence | ||||||
| 1Incomplete outcome data (attrition bias) due to missing data imbalanced between intervention and control groups in most of the included studies (−1 level). | ||||||
| Study | N | Country | Intervention | Control | Outcomes |
|---|---|---|---|---|---|
| AMBITION | 747 | International | Ambrisentan + tadalafil or ambrisentan | Tadalafil + placebo | Primary outcome: time to the first event of clinical failure Secondary outcomes: change from baseline in NT‐proBNP level, 6MWD, WHO FC, and Borg dyspnoea index |
| ARIES‐1 | 201 | International | Ambrisentan (5 mg/day or 10 mg/day) | Placebo | Primary outcome: change from baseline in 6MWD Secondary outcomes: change from baseline in WHO FC, Borg dyspnoea index and time to clinical worsening, plasma BNP, and SF‐36 physical functioning scale |
| ARIES‐2 | 192 | International | Ambrisentan (2.5 mg/day or 5 mg/day) | Placebo | Primary outcome: change from baseline in 6MWD Secondary outcomes: change from baseline in WHO FC, Borg dyspnoea index and time to clinical worsening, plasma BNP, and SF‐36 |
| BREATHE‐1 | 213 | International | Bosentan | Placebo | Primary outcome: change from baseline in 6MWD |
| BREATHE‐2 | 33 | International | Bosentan | Placebo | Primary outcome: change from baseline to week 16 in TPR |
| BREATHE‐5 | 54 | International | Bosentan | Placebo | Primary outcome: change from baseline in SpO2 and PVR |
| Channick 2001 | 32 | International | Bosentan | Placebo | Primary outcome: change from baseline in 6MWD |
| COMPASS‐2 | 334 | International | Bosentan | Placebo | Primary outcome: time to the first morbidity/mortality event Secondary outcomes: change in 6MWD, WHO FC, time to the first occurrence of death from any cause, hospitalisation for PAH or start of intravenous prostanoid therapy, atrial septostomy, or lung transplant. |
| EARLY | 185 | International | Bosentan | Placebo | Primary outcomes: PVR and change from baseline in 6MWD |
| EDITA | 38 | Germany | Ambrisentan | Placebo | Primary outcome: change in mPAP Secondary outcomes: change in WHO FC, change in cardiac index, change in PVR, symptoms of SSc, quality of life (SF‐36), lung function tests, right heart dimensions and function, NT‐proBNP, measures of disease‐related progression |
| MAESTRO | 150 | International | Macitentan | Placebo | Primary outcome: change from baseline in 6MWD Secondary outcomes: change from baseline in WHO FC and Borg dyspnoea index |
| PORTICO | 85 | International | Macitentan | Placebo | Primary outcome: change from baseline to PVR Secondary outcomes: change from baseline in RAP, mPAP, cardiac index, total pulmonary resistance, SvO2, NT‐proBNP, 6MWD, and WHO FC |
| SERAPH | 26 | British | Bosentan | Sildenafil | Primary outcome: change in right ventricle mass from baseline |
| SERAPHIN | 742 | International | Macitentan | Placebo | Primary outcome: time from the initiation of treatment to the first event related to pulmonary arterial hypertension Secondary outcomes: change from baseline in 6MWD, percentage of participants with an improvement in WHO FC, death due to PAH or hospitalisations for PAH, and death from |
| STRIDE‐1 | 178 | International | Sitaxsentan | Placebo | Primary outcome: peak oxygen consumption |
| STRIDE‐2 | 245 | International | Sitaxsentan | Placebo | Primary outcome: change from baseline in 6MWD |
| STRIDE‐4 | 98 | International | Sitaxsentan | Placebo | Primary efficacy endpoint was the change in 6MWD from baseline to week 18. Secondary outcomes: changes in WHO FC from baseline at each assessment and time to clinical worsening, Borg dyspnoea index |
| 6MWD: 6‐minute walk distance; BNP: B‐type natriuretic peptide; mPAP: mean pulmonary artery pressure; mRAP: mean right atrial pressure; MVO2: mixed venous oxygen saturation; NT‐proBNP: N‐terminal pro–brain natriuretic peptide; NYHA FC: New York Heart Association functional class; PAH: pulmonary arterial hypertension; PVR: pulmonary vascular resistance; SF‐36: 36‐item Short Form Health Survey; SpO2: oxygen saturation; SSc: systemic sclerosis; SvO2: mixed venous oxygen saturation; TPR: total pulmonary resistance; WHO FC: World Health Organization functional class | |||||
| Outcome | Including combination therapy | Excluding combination therapy |
|---|---|---|
| Change in 6MWD, mean with 95% CI | 25.06 (17.13 to 32.99) | 25.65 (16.80 to 34.49) |
| WHO/NYHA FC improvement, OR with 95% CI | 1.41 (1.16 to 1.70) | 1.52 (1.22 to 1.91) |
| Mortality, OR with 95% CI | 0.78 (0.58 to 1.07) | 0.82 (0.58 to 1.17) |
| 6MWD: 6‐minute walk distance; CI: confidence interval; NYHA FC: New York Heart Association functional class; OR: odds ratio; WHO FC: World Health Organization functional class | ||
| Outcome | Including combination therapy | Excluding combination therapy |
|---|---|---|
| Change in 6MWD, mean with 95% CI | 25.06 (17.13 to 32.99) | 27.90 (20.96 to 34.83) |
| WHO/NYHA FC improvement, OR with 95% CI | 1.41 (1.16 to 1.70) | 1.46 (1.19 to 1.78) |
| Mortality, OR with 95% CI | 0.78 (0.58 to 1.07) | 0.77 (0.57 to 1.05) |
| 6MWD: 6‐minute walk distance; CHD: congenital heart disease; CI: confidence interval; NYHA FC: New York Heart Association functional class; OR: odds ratio; PAH: pulmonary arterial hypertension; SSc: systemic sclerosis; WHO FC: World Health Organization functional class | ||
| Outcome or subgroup title | No. of studies | No. of participants | Statistical method | Effect size |
| 1.1 Change from baseline in 6‐minute walk Show forest plot | 14 | 2739 | Mean Difference (IV, Random, 95% CI) | 25.06 [17.13, 32.99] |
| 1.1.1 Non‐selective ERA | 8 | 1860 | Mean Difference (IV, Random, 95% CI) | 20.51 [10.03, 31.00] |
| 1.1.2 Selective ERA | 6 | 879 | Mean Difference (IV, Random, 95% CI) | 33.48 [23.12, 43.83] |
| 1.2 Proportion of participants with improved functional class Show forest plot | 15 | 3060 | Odds Ratio (M‐H, Fixed, 95% CI) | 1.41 [1.16, 1.70] |
| 1.2.1 Non‐selective ERAs | 9 | 1896 | Odds Ratio (M‐H, Fixed, 95% CI) | 1.45 [1.13, 1.87] |
| 1.2.2 Selective ERAs | 6 | 1164 | Odds Ratio (M‐H, Fixed, 95% CI) | 1.35 [1.01, 1.80] |
| 1.3 Proportion of participants with deteriorated functional class Show forest plot | 13 | 2347 | Odds Ratio (M‐H, Random, 95% CI) | 0.43 [0.26, 0.72] |
| 1.3.1 Non‐selective ERA | 7 | 1121 | Odds Ratio (M‐H, Random, 95% CI) | 0.65 [0.30, 1.42] |
| 1.3.2 Selective ERAs | 6 | 1226 | Odds Ratio (M‐H, Random, 95% CI) | 0.31 [0.17, 0.60] |
| 1.4 Change from baseline in Borg dyspnoea index Show forest plot | 7 | 788 | Mean Difference (IV, Random, 95% CI) | ‐0.43 [‐0.90, 0.04] |
| 1.4.1 Non‐selective ERAs | 3 | 240 | Mean Difference (IV, Random, 95% CI) | ‐0.27 [‐1.58, 1.03] |
| 1.4.2 Selective ERAs | 4 | 548 | Mean Difference (IV, Random, 95% CI) | ‐0.43 [‐1.01, 0.14] |
| 1.5 Mortality Show forest plot | 12 | 2889 | Odds Ratio (M‐H, Fixed, 95% CI) | 0.78 [0.58, 1.07] |
| 1.5.1 Non‐selective ERAs | 7 | 1759 | Odds Ratio (M‐H, Fixed, 95% CI) | 0.88 [0.62, 1.23] |
| 1.5.2 Selective ERAs | 5 | 1130 | Odds Ratio (M‐H, Fixed, 95% CI) | 0.45 [0.21, 0.94] |
| 1.6 Change from baseline in mean pulmonary artery pressure Show forest plot | 8 | 729 | Mean Difference (IV, Random, 95% CI) | ‐4.65 [‐6.05, ‐3.26] |
| 1.6.1 Non‐selective ERAs | 6 | 519 | Mean Difference (IV, Random, 95% CI) | ‐5.79 [‐7.30, ‐4.27] |
| 1.6.2 Selective ERAs | 2 | 210 | Mean Difference (IV, Random, 95% CI) | ‐2.65 [‐5.31, 0.00] |
| 1.7 Change from baseline in pulmonary vascular resistance Show forest plot | 7 | 586 | Mean Difference (IV, Random, 95% CI) | ‐236.24 [‐333.21, ‐139.26] |
| 1.7.1 Non‐selective ERAs | 5 | 376 | Mean Difference (IV, Random, 95% CI) | ‐281.74 [‐395.85, ‐167.63] |
| 1.7.2 Selective ERAs | 2 | 210 | Mean Difference (IV, Random, 95% CI) | ‐173.73 [‐332.52, ‐14.94] |
| 1.8 Pulmonary vascular resistance Show forest plot | 2 | 175 | Mean Difference (IV, Fixed, 95% CI) | ‐288.59 [‐472.18, ‐104.99] |
| 1.9 Ratio of geometric mean PVR Show forest plot | 3 | Ratio of Geometric mean (IV, Random, 95% CI) | Subtotals only | |
| 1.9.1 Selective ERAs | 0 | Ratio of Geometric mean (IV, Random, 95% CI) | Not estimable | |
| 1.9.2 Non‐selective ERAs | 3 | Ratio of Geometric mean (IV, Random, 95% CI) | 0.69 [0.60, 0.80] | |
| 1.10 Change from baseline in cardiac index Show forest plot | 7 | 718 | Mean Difference (IV, Random, 95% CI) | 0.50 [0.35, 0.65] |
| 1.10.1 Non‐selective ERAs | 5 | 509 | Mean Difference (IV, Random, 95% CI) | 0.55 [0.34, 0.77] |
| 1.10.2 Selective ERAs | 2 | 209 | Mean Difference (IV, Random, 95% CI) | 0.39 [0.23, 0.54] |
| 1.11 Change from baseline in SpO 2 Show forest plot | 1 | Mean Difference (IV, Fixed, 95% CI) | Totals not selected | |
| 1.12 Hepatic toxicity Show forest plot | 11 | 2250 | Odds Ratio (M‐H, Random, 95% CI) | 1.88 [0.91, 3.90] |
| 1.12.1 Non‐selective ERAs | 9 | 1888 | Odds Ratio (M‐H, Random, 95% CI) | 2.33 [0.98, 5.56] |
| 1.12.2 Selective ERAs | 2 | 362 | Odds Ratio (M‐H, Random, 95% CI) | 0.89 [0.31, 2.51] |
| Outcome or subgroup title | No. of studies | No. of participants | Statistical method | Effect size |
| 2.1 6‐minute walk Show forest plot | 1 | Mean Difference (IV, Fixed, 95% CI) | Totals not selected | |
| 2.2 Proportion of participants with improved functional class Show forest plot | 1 | Odds Ratio (M‐H, Fixed, 95% CI) | Totals not selected | |
| 2.3 Proportion of participants with deteriorated functional class Show forest plot | 1 | Odds Ratio (M‐H, Random, 95% CI) | Totals not selected | |
| 2.4 Symptoms Show forest plot | 1 | Mean Difference (IV, Fixed, 95% CI) | Totals not selected | |
| 2.5 Mortality Show forest plot | 2 | 273 | Odds Ratio (M‐H, Fixed, 95% CI) | 0.32 [0.07, 1.36] |
| 2.6 Cardiac index Show forest plot | 1 | Mean Difference (IV, Fixed, 95% CI) | Totals not selected | |
| Outcome or subgroup title | No. of studies | No. of participants | Statistical method | Effect size |
| 3.1 Change from baseline in 6‐minute walk Show forest plot | 2 | 280 | Mean Difference (IV, Random, 95% CI) | 21.49 [‐31.23, 74.21] |
| 3.1.1 Non‐selective ERA | 2 | 280 | Mean Difference (IV, Random, 95% CI) | 21.49 [‐31.23, 74.21] |
| 3.1.2 Selective ERA | 0 | 0 | Mean Difference (IV, Random, 95% CI) | Not estimable |
| 3.2 Proportion of participants with improved functional class Show forest plot | 2 | 280 | Odds Ratio (M‐H, Fixed, 95% CI) | 0.95 [0.48, 1.90] |
| 3.2.1 Non‐selective ERAs | 2 | 280 | Odds Ratio (M‐H, Fixed, 95% CI) | 0.95 [0.48, 1.90] |
| 3.2.2 Selective ERAs | 0 | 0 | Odds Ratio (M‐H, Fixed, 95% CI) | Not estimable |
| 3.3 Proportion of participants with deteriorated functional class Show forest plot | 2 | 280 | Odds Ratio (M‐H, Random, 95% CI) | 0.67 [0.09, 4.85] |
| 3.3.1 Non‐selective ERA | 2 | 280 | Odds Ratio (M‐H, Random, 95% CI) | 0.67 [0.09, 4.85] |
| 3.3.2 Selective ERAs | 0 | 0 | Odds Ratio (M‐H, Random, 95% CI) | Not estimable |
| 3.4 Mortality Show forest plot | 1 | Odds Ratio (M‐H, Fixed, 95% CI) | Totals not selected | |
| 3.4.1 Non‐selective ERAs | 1 | Odds Ratio (M‐H, Fixed, 95% CI) | Totals not selected | |
| 3.4.2 Selective ERAs | 0 | Odds Ratio (M‐H, Fixed, 95% CI) | Totals not selected | |
| 3.5 Change from baseline in mean pulmonary arterial pressure Show forest plot | 2 | 90 | Mean Difference (IV, Fixed, 95% CI) | ‐4.63 [‐8.03, ‐1.23] |
| 3.5.1 Non‐selective ERAs | 2 | 90 | Mean Difference (IV, Fixed, 95% CI) | ‐4.63 [‐8.03, ‐1.23] |
| 3.5.2 Selective ERAs | 0 | 0 | Mean Difference (IV, Fixed, 95% CI) | Not estimable |
| 3.6 Change from baseline in pulmonary vascular resistance Show forest plot | 2 | 93 | Mean Difference (IV, Fixed, 95% CI) | ‐480.07 [‐753.34, ‐206.79] |
| 3.6.1 Non‐selective ERAs | 2 | 93 | Mean Difference (IV, Fixed, 95% CI) | ‐480.07 [‐753.34, ‐206.79] |
| 3.6.2 Selective ERAs | 0 | 0 | Mean Difference (IV, Fixed, 95% CI) | Not estimable |
| 3.7 Change from baseline in SpO 2 Show forest plot | 1 | Mean Difference (IV, Fixed, 95% CI) | Totals not selected | |