| 1 Six minute walk Show forest plot | 2 | | Metres (Fixed, 95% CI) | 46.24 [23.96, 68.53] |
|
| 2 Number of patients who improved their classification (WHO or NYHA functional class) Show forest plot | 3 | 423 | Risk Ratio (M‐H, Fixed, 95% CI) | 1.65 [1.17, 2.32] |
|
| 2.1 Nonselective ERAs | 2 | 245 | Risk Ratio (M‐H, Fixed, 95% CI) | 1.52 [1.02, 2.26] |
| 2.2 Selective ERAs | 1 | 178 | Risk Ratio (M‐H, Fixed, 95% CI) | 1.98 [1.02, 3.84] |
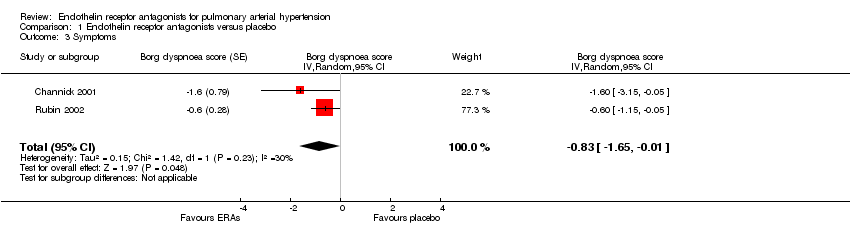
| 3 Symptoms Show forest plot | 2 | | Borg dyspnoea score (Random, 95% CI) | ‐0.83 [‐1.65, ‐0.01] |
|
| 4 Mortality Show forest plot | 1 | | Risk Ratio (M‐H, Fixed, 95% CI) | Totals not selected |
|
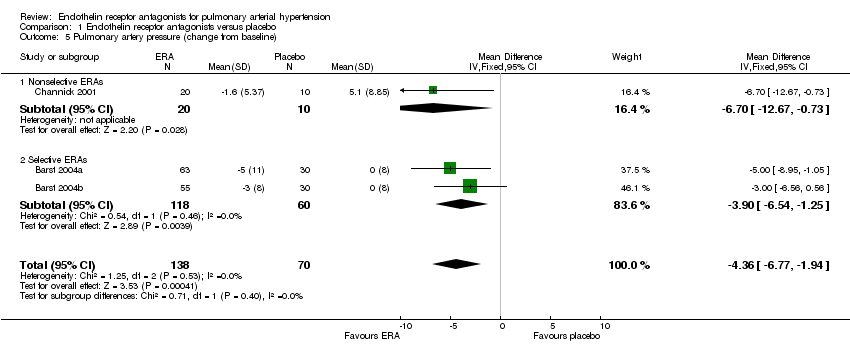
| 5 Pulmonary artery pressure (change from baseline) Show forest plot | 3 | 208 | Mean Difference (IV, Fixed, 95% CI) | ‐4.36 [‐6.77, ‐1.94] |
|
| 5.1 Nonselective ERAs | 1 | 30 | Mean Difference (IV, Fixed, 95% CI) | ‐6.70 [‐12.67, ‐0.73] |
| 5.2 Selective ERAs | 2 | 178 | Mean Difference (IV, Fixed, 95% CI) | ‐3.90 [‐6.54, ‐1.25] |
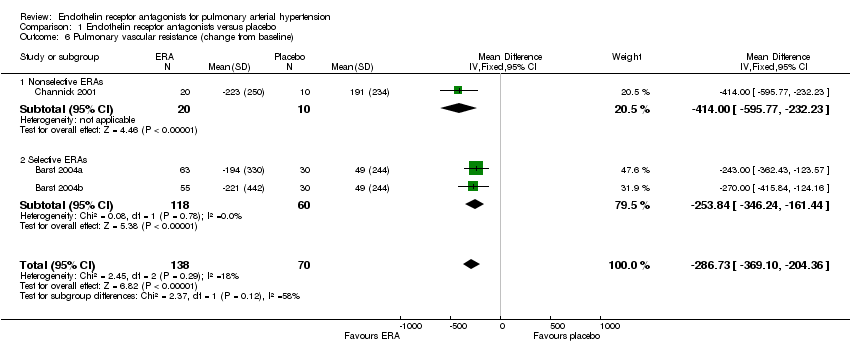
| 6 Pulmonary vascular resistance (change from baseline) Show forest plot | 3 | 208 | Mean Difference (IV, Fixed, 95% CI) | ‐286.73 [‐369.10, ‐204.36] |
|
| 6.1 Nonselective ERAs | 1 | 30 | Mean Difference (IV, Fixed, 95% CI) | ‐414.0 [‐595.77, ‐232.23] |
| 6.2 Selective ERAs | 2 | 178 | Mean Difference (IV, Fixed, 95% CI) | ‐253.84 [‐346.24, ‐161.44] |
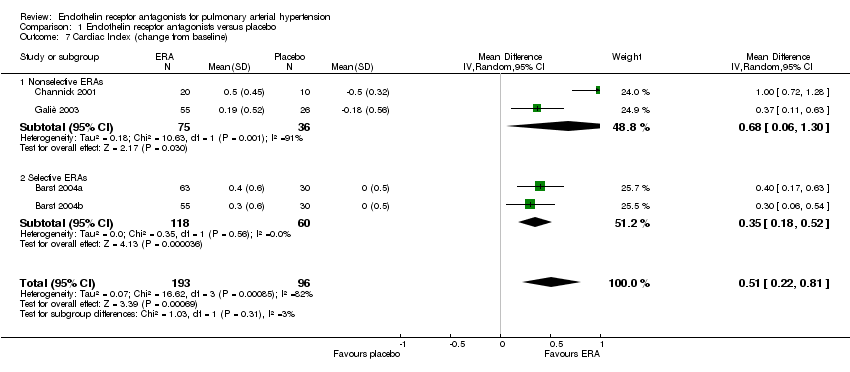
| 7 Cardiac Index (change from baseline) Show forest plot | 4 | 289 | Mean Difference (IV, Random, 95% CI) | 0.51 [0.22, 0.81] |
|
| 7.1 Nonselective ERAs | 2 | 111 | Mean Difference (IV, Random, 95% CI) | 0.68 [0.06, 1.30] |
| 7.2 Selective ERAs | 2 | 178 | Mean Difference (IV, Random, 95% CI) | 0.35 [0.18, 0.52] |
| 8 Hepatic toxicity Show forest plot | 3 | 422 | Odds Ratio (M‐H, Random, 95% CI) | 1.62 [0.57, 4.55] |
|
| 8.1 Nonselective ERAs | 2 | 245 | Odds Ratio (M‐H, Random, 95% CI) | 1.45 [0.22, 9.71] |
| 8.2 Selective ERAs | 1 | 177 | Odds Ratio (M‐H, Random, 95% CI) | 1.53 [0.30, 7.81] |