| Photodynamic therapy compared to interventions for actinic keratoses in immunocompetent participants |
| Intervention/Comparison intervention | Illustrative comparative risks* (95% CI) | Relative effect
(95% CI) | No of Participants
(studies) | Quality of the evidence
(GRADE) | Comments |
| Assumed risk With comparator | Corresponding risk With intervention |
| Participant complete clearance |
| ALA‐PDT |
| 1h ALA‐blue light PDT /1h ALA‐pulsed dye laser PDT (field‐directedtreatments) | 83 per 1000 | 500 per 1000
(71 to 1000) | RR 6
(0.85 to 42.59) | 24
(1 study) | ⊕⊝⊝⊝
very low | (Analysis 48.1) |
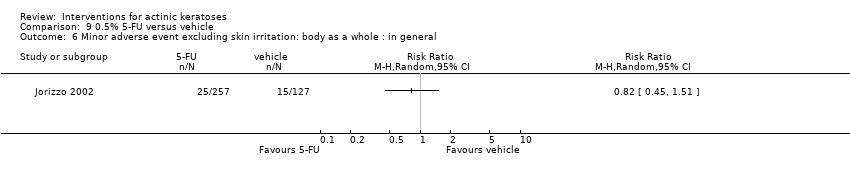
| 1h ALA‐blue light PDT /0.5% 5‐FU (field‐directedtreatments) | 500 per 1000 | 500 per 1000 (225 to 1000) | RR 1
(0.45 to 2.23) | 24
(1 study) | ⊕⊝⊝⊝
very low | (Analysis 50.1) |
| 14‐18h ALA‐blue light PDT /14‐18h placebo‐blue light PDT (individual lesions) | 97 per 1000 | 602 per 1000
(279 to 1000) | RR 6.22
(2.88 to 13.43) | 243
(1 study) | ⊕⊝⊝⊝
very low | 1 treatment. (Analysis 47.1) Additional intraindividual study: ALA‐PDT: 16/35, placebo‐PDT = 2/35. GRADE = moderate |
| 1h ALA‐pulsed dye laser PDT /0.5% 5‐FU (field‐directedtreatments) | 500 per 1000 | 85 per 1000
(10 to 590) | RR 0.17
(0.02 to 1.18) | 24
(1 study) | ⊕⊝⊝⊝
very low | (Analysis 50.1) |
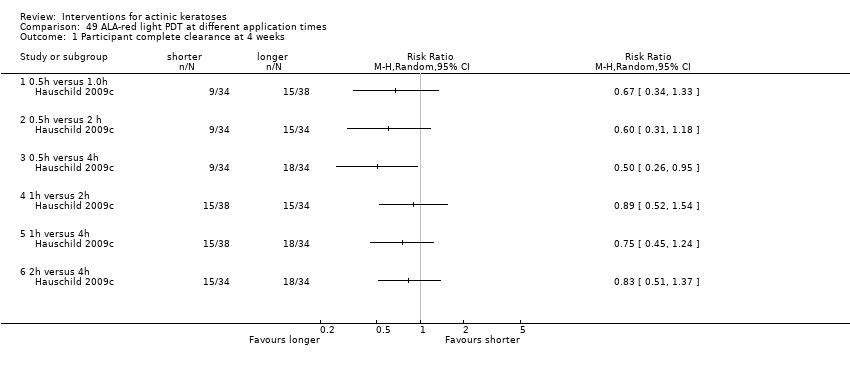
| 0.5h ALA‐red light PDT/1h ALA‐red light PDT (individual lesions) | 474 per 1000 | 237 per 1000
(118 to 469) | RR 0.5
(0.25 to 0.99) | 72
(1 study) | ⊕⊕⊝⊝
low | Data from assessment at 8 weeks after the end of treatment (Analysis 49.2) |
| 0.5h ALA‐red light PDT/2h ALA‐red light PDT (individual lesions) | 471 per 1000 | 235 per 1000
(118 to 475) | RR 0.5
(0.25 to 1.01) | 68
(1 study) | ⊕⊝⊝⊝
very low | Data from assessment at 8 weeks after the end of treatment (Analysis 49.2) |
| 0.5h ALA‐red light PDT /4h ALA‐red light PDT (individual lesions) | 735 per 1000 | 235 per 1000
(125 to 449) | RR 0.32
(0.17 to 0.61) | 68
(1 study) | ⊕⊕⊝⊝
low | Data from assessment at 8 weeks after the end of treatment (Analysis 49.2) |
| 1h ALA‐red light PDT /2h ALA‐red light PDT (individual lesions) | 471 per 1000 | 475 per 1000
(292 to 772) | RR 1.01
(0.62 to 1.64) | 72
(1 study) | ⊕⊝⊝⊝
very low | Data from assessment at 8 weeks after the end of treatment (Analysis 49.2) |
| 1h ALA‐red light PDT /4h ALA‐red light PDT (individual lesions) | 735 per 1000 | 471 per 1000
(324 to 699) | RR 0.64
(0.44 to 0.95) | 72
(1 study) | ⊕⊕⊝⊝
low | Data from assessment at 8 weeks after the end of treatment (Analysis 49.2) |
| 2h ALA‐red light PDT/4h ALA‐red light PDT (individual lesions) | 735 per 1000 | 471 per 1000
(309 to 706) | RR 0.64
(0.42 to 0.96) | 68
(1 study) | ⊕⊕⊝⊝
low | Data from assessment at 8 weeks after the end of treatment (Analysis 49.2) |
| 3‐4h ALA‐red light PDT/3 to 4h placebo‐red light PDT (individual lesions) | 89 per 1000 | 527 per 1000
(297 to 935) | RR 5.94
(3.35 to 10.54) | 422
(3 studies) | ⊕⊕⊕⊕
high | 1 treatment (Analysis 47.1) |
| 3% diclofenac in 2.5% hyaluronan gel + 4h ALA‐red light PDT /2.5% hyaluronan gel + 4h ALA‐red light PDT (field‐directedtreatments) | ‐ | ‐ | ‐ | ‐ | ‐ | Not reported |
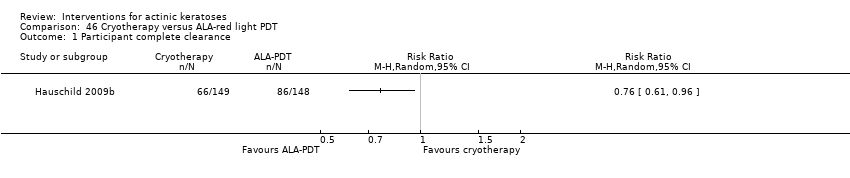
| 4h ALA‐red light PDT/Cryotherapy (individual lesions) | 443 per 1000 | 580 per 1000
(465 to 726) | RR 1.31
(1.05 to 1.64) | 297
(1 study) | ⊕⊕⊝⊝
low | (Analysis 51.1) |
| ALA‐red light PDT (individual lesions)/5% imiquimod (field‐directedtreatment) | ‐ | ‐ | ‐ | ‐ | ‐ | Not reported |
| ALA‐blue light PDT + 5% imiquimod / ALA‐blue light PDT + placebo (field‐directedtreatments) | See comment | See comment | Not estimable | 25
(1 study) | ⊕⊕⊝⊝
low | Intraindividual study: ALA‐PDT + 5% imiquimod = 2/25; ALA‐PDT + placebo = 2/25 |
| ALA‐PDT versus MAL‐PDT |
| 5h ALA‐red light PDT /3h MAL‐red light PDT (field‐directedtreatments) | See comment | See comment | Not estimable | 16
(1 study) | ⊕⊕⊕⊝
moderate | Intraindividual study: ALA‐PDT = 6/16, MAL‐PDT = 7/16 |
| MAL‐PDT |
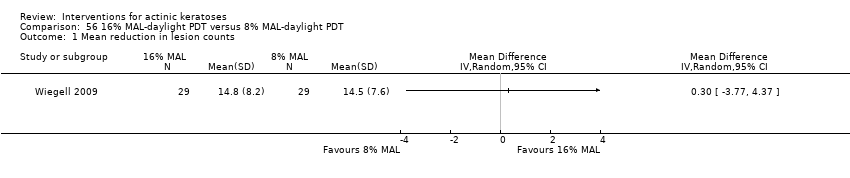
| All day 16% MAL‐daylight PDT /All day 8% MAL‐daylight PDT (field‐directedtreatments) | ‐ | ‐ | ‐ | ‐ | ‐ | Not reported |
| 2h MAL‐daylight PDT /3h MAL‐daylight PDT (field‐directedtreatments) | ‐ | ‐ | ‐ | ‐ | ‐ | Not reported |
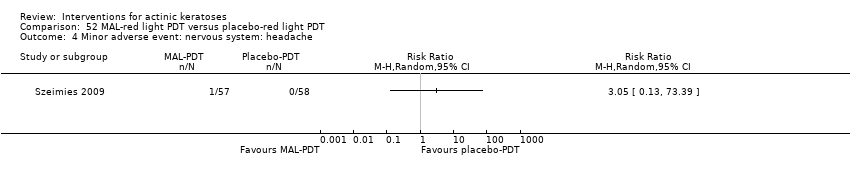
| 2.5‐4h MAL‐red light PDT /2.5‐4h placebo‐red light PDT (individual lesions) | 147 per 1000 | 656 per 1000
(466 to 924) | RR 4.46
(3.17 to 6.28) | 482
(5 studies) | ⊕⊕⊕⊝
moderate | (Analysis 52.1) |
| 3h MAL‐red light LED PDT /3h MAL‐broad visible + water‐filtered infrared A PDT (individual lesions) | 500 per 1000 | 575 per 1000
(380 to 865) | RR 1.15
(0.76 to 1.73) | 80
(1 study) | ⊕⊕⊝⊝
low | Data from assessment at 12 weeks after the end of treatment.(Analysis 53.1) |
| 3h MAL‐red light LED PDT /3h MAL‐daylight PDT (field‐directedtreatments) | ‐ | ‐ | ‐ | ‐ | ‐ | Not reported |
| Single 3h MAL‐red light PDT /Multiple 3h MAL‐red light PDT [2 treatments 1 week apart] (individual lesions) | 755 per 1000 | 883 per 1000
(777 to 1000) | RR 1.17
(1.03 to 1.33) | 211
(1 study) | ⊕⊕⊝⊝
low | (Analysis 57.1) |
| 3h MAL‐red light PDT /Cryotherapy (individual lesions) | ‐ | ‐ | ‐ | ‐ | ‐ | Not reported |
| Mean reduction in lesion counts |
| ALA‐PDT |
| 1h ALA‐blue light PDT /1h ALA‐pulsed dye laser PDT (field‐directedtreatments) | ‐ | ‐ | ‐ | ‐ | ‐ | Not reported |
| 1h ALA‐blue light PDT /0.5% 5‐FU (field‐directedtreatments) | ‐ | ‐ | ‐ | ‐ | ‐ | Not reported |
| 14‐18h ALA‐blue light PDT /14‐18h placebo‐blue light PDT (individual lesions) | ‐ | ‐ | ‐ | ‐ | ‐ | Not reported |
| 1h ALA‐pulsed dye laser PDT /0.5% 5‐FU (field‐directedtreatments) | ‐ | ‐ | ‐ | ‐ | ‐ | Not reported |
| 0.5h ALA‐red light PDT/1h ALA‐red light PDT (individual lesions) | ‐ | ‐ | ‐ | ‐ | ‐ | Not reported |
| 0.5h ALA‐red light PDT/2h ALA‐red light PDT (individual lesions) | ‐ | ‐ | ‐ | ‐ | ‐ | Not reported |
| 0.5h ALA‐red light PDT /4h ALA‐red light PDT (individual lesions) | ‐ | ‐ | ‐ | ‐ | ‐ | Not reported |
| 1h ALA‐red light PDT /2h ALA‐red light PDT (individual lesions) | ‐ | ‐ | ‐ | ‐ | ‐ | Not reported |
| 1h ALA‐red light PDT /4h ALA‐red light PDT (individual lesions) | ‐ | ‐ | ‐ | ‐ | ‐ | Not reported |
| 2h ALA‐red light PDT /4h ALA‐red light PDT (individual lesions) | ‐ | ‐ | ‐ | ‐ | ‐ | Not reported |
| 3‐4h ALA‐red light PDT /3‐4h placebo‐red light PDT (individual lesions) | ‐ | ‐ | ‐ | ‐ | ‐ | Not reported |
| 3% diclofenac in 2.5% hyaluronic acid gel + 4h ALA‐red light PDT /2.5% hyaluronic acid gel + 4h ALA‐red light PDT (field‐directedtreatments) | See comment | See comment | Not estimable | 10
(1 study) | ⊕⊕⊝⊝
low | Intraindividual study: at 6 weeks; diclofenac/hyaluronic acid (HA) + ALA‐PDT = 10.13, HA + ALA‐PDT= 9.9, at 6 months:; diclofenac/HA + ALA‐PDT = 11.56, HA + ALA‐PDT = 10.56, at 12 months; diclofenac/HA + ALA‐PDT = 12.5, HA + ALA‐PDT = 8.8 |
| 4h ALA‐red light PDT /Cryotherapy (individual lesions) | ‐ | ‐ | ‐ | ‐ | ‐ | Not reported |
| ALA‐red light PDT (individual lesions)/5% imiquimod (field‐directedtreatment) | ‐ | ‐ | ‐ | ‐ | ‐ | Not reported |
| ALA‐blue light PDT + 5% imiquimod / ALA‐blue light PDT + placebo (field‐directedtreatments) | See comment | See comment | Not estimable | 25
(1 study) | ⊕⊕⊝⊝
low | Results from intraindividual study without SD: ALA‐PDT + 5% imiquimod = 19.9 lesions; ALA‐PDT + placebo = 16.0 lesions |
| ALA‐PDT versus MAL‐PDT |
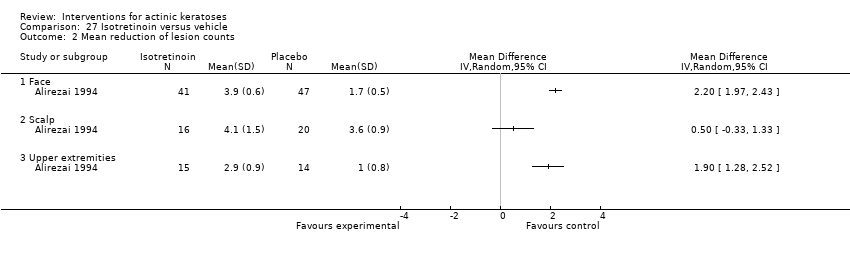
| 5h ALA‐red light PDT /3h MAL‐red light PDT (field‐directedtreatments) | The mean reduction in lesion counts in the control groups was
5.6 lesions | The mean reduction in lesion counts in the intervention groups was 0.6 higher
(1.28 lower to 2.48 higher) | ‐ | 15
(1 study) | ⊕⊕⊝⊝
low | (Analysis 59.1) |
| MAL‐PDT |
| All day 16% MAL‐daylight PDT /All day 8% MAL‐daylight PDT (field‐directedtreatments) | The mean reduction in lesion counts in the control groups was
14.5 lesions | The mean reduction in lesion counts in the intervention groups was 0.3 higher
(3.77 lower to 4.37 higher) | ‐ | 29
(1 study) | ⊕⊕⊝⊝
low | (Analysis 56.1) |
| 2h MAL‐daylight PDT /3h MAL‐daylight PDT (field‐directedtreatments) | The mean reduction in lesion counts in the control groups was
9.7 lesions | The mean reduction in lesion counts in the intervention groups was 0.1 higher
(3.17 lower to 3.37 higher) | | 120
(1 study) | ⊕⊕⊝⊝
low | (Analysis 55.1) |
| 2.5‐4h MAL‐red light PDT /2.5‐4h placebo‐red light PDT (individual lesions) | ‐ | ‐ | ‐ | ‐ | ‐ | Not reported |
| 3h MAL‐red light LED PDT /3h MAL‐broad visible + water‐filtered infrared A PDT (individual lesions) | ‐ | ‐ | ‐ | ‐ | ‐ | Not reported |
| 3h MAL‐red light LED PDT /3h MAL‐daylight PDT (field‐directedtreatments) | The mean reduction in lesion counts in the control groups was
8.4 lesions | The mean reduction in lesion counts in the intervention groups was 0.4 lower
(3.23 lower to 2.43 higher) | ‐ | 29
(1 study) | ⊕⊕⊝⊝
low | (Analysis 54.1) |
| Single 3h MAL‐red light PDT /Multiple 3h MAL‐red light PDT [2 treatments 1 week apart] (individual lesions) | ‐ | ‐ | ‐ | ‐ | ‐ | Not reported |
| 3h MAL‐red light PDT /Cryotherapy (individual lesions) | ‐ | ‐ | ‐ | ‐ | ‐ | Not reported |
| Mean percentage of reduction in lesion count |
| ALA‐PDT |
| 1h ALA‐blue light PDT /1h ALA‐pulsed dye laser PDT (field‐directedtreatments) | ‐ | ‐ | ‐ | ‐ | ‐ | Not reported |
| 1h ALA‐blue light PDT /0.5% 5‐FU (field‐directedtreatments) | ‐ | ‐ | ‐ | ‐ | ‐ | Not reported |
| 14‐18h ALA‐blue light PDT /14‐18h placebo‐blue light PDT (individual lesions) | ‐ | ‐ | ‐ | ‐ | ‐ | Not reported |
| 1h ALA‐pulsed dye laser PDT /0.5% 5‐FU (field‐directedtreatments) | ‐ | ‐ | ‐ | ‐ | ‐ | Not reported |
| 0.5h ALA‐red light PDT/1h ALA‐red light PDT (individual lesions) | ‐ | ‐ | ‐ | ‐ | ‐ | Not reported |
| 0.5h ALA‐red light PDT/2h ALA‐red light PDT (individual lesions) | ‐ | ‐ | ‐ | ‐ | ‐ | Not reported |
| 0.5h ALA‐red light PDT /4h ALA‐red light PDT (individual lesions) | ‐ | ‐ | ‐ | ‐ | ‐ | Not reported |
| 1h ALA‐red light PDT /2h ALA‐red light PDT (individual lesions) | ‐ | ‐ | ‐ | ‐ | ‐ | Not reported |
| 1h ALA‐red light PDT /4h ALA‐red light PDT (individual lesions) | ‐ | ‐ | ‐ | ‐ | ‐ | Not reported |
| 2h ALA‐red light PDT /4h ALA‐red light PDT (individual lesions) | ‐ | ‐ | ‐ | ‐ | ‐ | Not reported |
| 3‐4h ALA‐red light PDT /3‐4h placebo‐red light PDT (individual lesions) | ‐ | ‐ | ‐ | ‐ | ‐ | Not reported |
| 3% diclofenac in 2.5% hyaluronic acid gel + 4h ALA‐red light PDT /2.5% hyaluronic acid gel + 4h ALA‐red light PDT (field‐directedtreatments) | ‐ | ‐ | ‐ | ‐ | ‐ | Not reported |
| 4h ALA‐red light PDT /Cryotherapy (individual lesions) | ‐ | ‐ | ‐ | ‐ | ‐ | Not reported |
| ALA‐red light PDT (individual lesions)/5% imiquimod (field‐directedtreatment) | ‐ | ‐ | ‐ | ‐ | ‐ | Not reported |
| ALA‐blue light PDT + 5% imiquimod / ALA‐blue light PDT + placebo (field‐directedtreatments) | See comment | See comment | Not estimable | 25
(1 study) | ⊕⊕⊝⊝
low | Results from intraindividual study without SD: ALA‐PDT + 5% imiquimod = 86.7%; ALA‐PDT + placebo = 73.1% |
| ALA‐PDT versus MAL‐PDT |
| 5h ALA‐red light PDT /3h MAL‐red light PDT (field‐directedtreatments) | ‐ | See comment | ‐ | ‐ | ‐ | Not reported |
| MAL‐PDT |
| All day 16% MAL‐daylight PDT /All day 8% MAL‐daylight PDT (field‐directedtreatments) | See comment | See comment | Not estimable | 29
(1 study) | ⊕⊕⊝⊝
low | Data with no SD: 16% MAL‐daylight PDT = 76.9%, 8% MAL‐daylight PDT = 79.5%. |
| 2h MAL‐daylight PDT /3h MAL‐daylight PDT (field‐directedtreatments) | The mean percentage of reduction in lesion counts in the control groups was
74.6 percent | The mean percentage of reduction in lesion counts in the intervention groups was 2.6 higher
(6.46 lower to 11.66 higher) | ‐ | 120
(1 study) | ⊕⊕⊝⊝
low | (Analysis 55.2) |
| 2.5‐4h MAL‐red light PDT /2.5‐4h placebo‐red light PDT (individual lesions) | ‐ | ‐ | ‐ | ‐ | ‐ | Not reported |
| 3h MAL‐red light LED PDT /3h MAL‐broad visible + water‐filtered infrared A PDT (individual lesions) | ‐ | ‐ | ‐ | ‐ | ‐ | Not reported |
| 3h MAL‐red light LED PDT /3h MAL‐daylight PDT (field‐directedtreatments) | See comment | See comment | Not estimable | 29
(1 study) | ⊕⊕⊝⊝
low | Data with no SD: MAL‐red light LED PDT = 71%, MAL‐daylight PDT = 79%. |
| Single 3h MAL‐red light PDT /Multiple 3h MAL‐red light PDT [2 treatments 1 week apart] (individual lesions) | ‐ | ‐ | ‐ | ‐ | ‐ | Not reported |
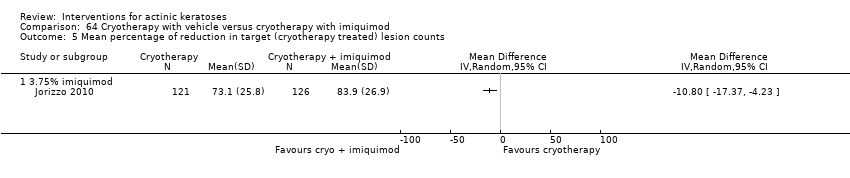
| 3h MAL‐red light PDT /Cryotherapy (individual lesions) | See comment | See comment | Not estimable | 240
(2 studies) | ⊕⊝⊝⊝
very low | Intraindividual studies with no SD: at 12 weeks: MAL‐PDT = 84.4%, cryotherapy = 74.5%, at 24 weeks: MAL‐PDT = 75‐86.7%, cryotherapy = 83.9‐87% |
| Withdrawal due to adverse events |
| ALA‐PDT |
| 1h ALA‐blue light PDT /1h ALA‐pulsed dye laser PDT (field‐directedtreatments) | 0 per 1000 | 0 per 1000 | Not estimable | 24
(1 study) | ⊕⊕⊝⊝
low | There were no participant withdrawals due to adverse events. |
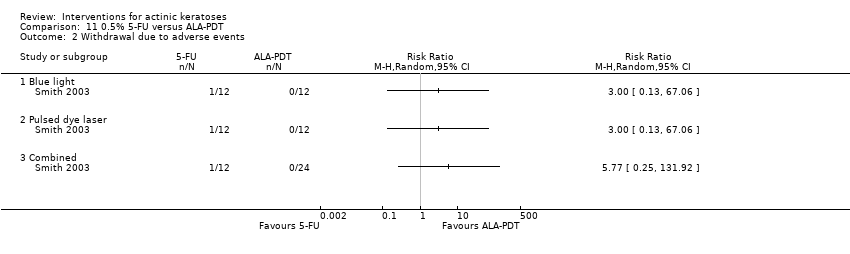
| 1h ALA‐blue light PDT /0.5% 5‐FU (field‐directedtreatments) | 83 per 1000 | 28 per 1000
(1 to 621) | RR 0.33
(0.01 to 7.45) | 24
(1 study) | ⊕⊕⊝⊝
low | (Analysis 50.3) |
| 14‐18h ALA‐blue light PDT /14‐18h placebo‐blue light PDT (individual lesions) | 0 per 1000 | 0 per 1000 | Not estimable | 271
(2 studies) | ⊕⊕⊝⊝
low | There were no participant withdrawals due to adverse events. |
| 1h ALA‐pulsed dye laser PDT /0.5% 5‐FU (field‐directedtreatments) | 83 per 1000 | 28 per 1000
(1 to 621) | RR 0.33
(0.01 to 7.45) | 24
(1 study) | ⊕⊕⊝⊝
low | (Analysis 50.3) |
| 0.5h ALA‐red light PDT/1h ALA‐red light PDT (individual lesions) | See comment | See comment | Not estimable | 72
(1 study) | ⊕⊝⊝⊝
very low | No details were given for the reasons for withdrawal. |
| 0.5h ALA‐red light PDT/2h ALA‐red light PDT (individual lesions) | See comment | See comment | Not estimable | 68
(1 study) | ⊕⊝⊝⊝
very low | No details were given for the reasons for withdrawal. |
| 0.5h ALA‐red light PDT /4h ALA‐red light PDT (individual lesions) | See comment | See comment | Not estimable | 68
(1 study) | ⊕⊝⊝⊝
very low | No details were given for the reasons for withdrawal. |
| 1h ALA‐red light PDT /2h ALA‐red light PDT (individual lesions) | See comment | See comment | Not estimable | 72
(1 study) | ⊕⊝⊝⊝
very low | No details were given for the reasons for withdrawal. |
| 1h ALA‐red light PDT /4h ALA‐red light PDT (individual lesions) | See comment | See comment | Not estimable | 72
(1 study) | ⊕⊝⊝⊝
very low | No details were given for the reasons for withdrawal. |
| 2h ALA‐red light PDT /4h ALA‐red light PDT (individual lesions) | See comment | See comment | Not estimable | 68
(1 study) | ⊕⊝⊝⊝
very low | No details were given for the reasons for withdrawal. |
| 3‐4h ALA‐red light PDT /3‐4h placebo‐red light PDT (individual lesions) | 0 per 1000 | 0 per 1000 | Not estimable | 391
(3 studies) | ⊕⊕⊕⊕
high | There were no participant withdrawals due to adverse events. |
| 3% diclofenac in 2.5% hyaluronic acid gel + 4h ALA‐red light PDT /2.5% hyaluronic acid gel + 4h ALA‐red light PDT (field‐directedtreatments) | 0 per 1000 | 0 per 1000 | Not estimable | 10
(1 study) | ⊕⊕⊕⊝
moderate | There were no participant withdrawals due to adverse events. |
| 4h ALA‐red light PDT /Cryotherapy (individual lesions) | 0 per 1000 | 0 per 1000 | Not estimable | 255
(1 study) | ⊕⊕⊕⊝
moderate | There were no participant withdrawals due to adverse events. |
| ALA‐red light PDT (individual lesions)/5% imiquimod (field‐directedtreatment) | 0 per 1000 | 0 per 1000 | Not estimable | 30
(1 study) | ⊕⊕⊝⊝
low | There were no participant withdrawals due to adverse events. |
| ALA‐blue light PDT + 5% imiquimod / ALA‐blue light PDT + placebo (field‐directedtreatments) | 0 per 1000 | 0 per 1000 | Not estimable | 25
(1 study) | ⊕⊕⊝⊝
low | There were no participant withdrawals due to adverse events. |
| ALA‐PDT versus MAL‐PDT |
| 5h ALA‐red light PDT /3h MAL‐red light PDT (field‐directedtreatments) | 0 per 1000 | 0 per 1000 | Not estimable | 15
(1 study) | ⊕⊕⊕⊝
moderate | There were no participant withdrawals due to adverse events. |
| MAL‐PDT |
| All day 16% MAL‐daylight PDT /All day 8% MAL‐daylight PDT (field‐directedtreatments) | See comment | See comment | Not estimable | 29
(1 study) | ⊕⊕⊕⊝
moderate | One of 30 participants withdrew because of adverse events unrelated to treatments. |
| 2h MAL‐daylight PDT /3h MAL‐daylight PDT (field‐directedtreatments) | 0 per 1000 | 0 per 1000 | Not estimable | 120
(1 study) | ⊕⊕⊕⊝
moderate | There were no participant withdrawals due to adverse events. |
| 2.5‐4h MAL‐red light PDT /2.5‐4h placebo‐red light PDT (individual lesions) | 0 per 1000 | N/A (3/130 = 23/1000) | RR 2
(0.23 to 17.74) | 191
(2 studies) | ⊕⊝⊝⊝
very low | (Analysis 52.3) Two additional studies with no participant withdrawals because of adverse events (N = 211). GRADE = low |
| 3h MAL‐red light LED PDT /3h MAL‐broad visible + water‐filtered infrared A PDT (individual lesions) | 0 per 1000 | 0 per 1000 | Not estimable | 78
(1 study) | ⊕⊕⊕⊝
moderate | There were no participant withdrawals due to adverse events. |
| 3h MAL‐red light LED PDT /3h MAL‐daylight PDT (field‐directedtreatments) | 0 per 1000 | 0 per 1000 | Not estimable | 29
(1 study) | ⊕⊕⊕⊝
moderate | There were no participant withdrawals due to adverse events. |
| Single 3h MAL‐red light PDT /Multiple 3h MAL‐red light PDT [2 treatments 1 week apart] (individual lesions) | 9 per 1000 | 3 per 1000
(0 to 77) | RR 0.34
(0.01 to 8.17) | 211
(1 study) | ⊕⊕⊝⊝
low | (Analysis 57.2) |
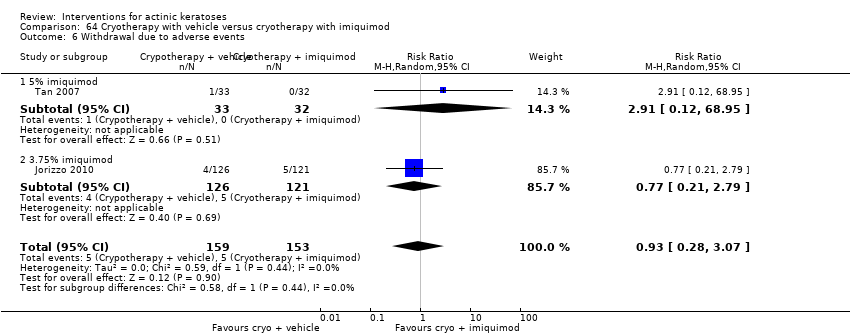
| 3h MAL‐red light PDT /Cryotherapy (individual lesions) | 11 per 1000 | 10 per 1000
(1 to 67) | RR 0.94
(0.14 to 6.36) | 379
(2 studies) | ⊕⊕⊕⊝
moderate | (Analysis 58.1) Two additional intraindividual studies: 4 of 119 and 2 of 121 participants withdrew because of adverse events and one of them was related to MAL‐PDT. GRADE = low |
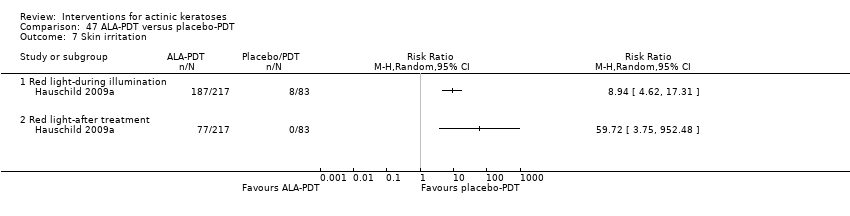
| Skin irritation |
| ALA‐PDT |
| 1h ALA‐blue light PDT /1h ALA‐pulsed dye laser PDT (field‐directedtreatments) | ‐ | ‐ | ‐ | ‐ | ‐ | Not reported |
| 1h ALA‐blue light PDT /0.5% 5‐FU (field‐directedtreatments) | ‐ | ‐ | ‐ | ‐ | ‐ | Not reported |
| 14‐18h ALA‐blue light PDT /14‐18h placebo‐blue light PDT (individual lesions) | ‐ | ‐ | ‐ | ‐ | ‐ | Not reported |
| 1h ALA‐pulsed dye laser PDT /0.5% 5‐FU (field‐directedtreatments) | ‐ | ‐ | ‐ | ‐ | ‐ | Not reported |
| 0.5h ALA‐red light PDT/1h ALA‐red light PDT (individual lesions) | ‐ | ‐ | ‐ | ‐ | ‐ | Not reported |
| 0.5h ALA‐red light PDT/2h ALA‐red light PDT (individual lesions) | ‐ | ‐ | ‐ | ‐ | ‐ | Not reported |
| 0.5h ALA‐red light PDT/4h ALA‐red light PDT (individual lesions) | ‐ | ‐ | ‐ | ‐ | ‐ | Not reported |
| 1h ALA‐red light PDT/2h ALA‐red light PDT (individual lesions) | ‐ | ‐ | ‐ | ‐ | ‐ | Not reported |
| 1h ALA‐red light PDT/4h ALA‐red light PDT (individual lesions) | ‐ | ‐ | ‐ | ‐ | ‐ | Not reported |
| 2h ALA‐red light PDT/4h ALA‐red light PDT (individual lesions) | ‐ | ‐ | ‐ | ‐ | ‐ | Not reported |
| 3 to 4h ALA‐red light PDT /3 to 4h placebo‐red light PDT (individual lesions) | 0 per 1000 | N/A (77/217 = 355/1000) | RR 59.72
(3.75 to 952.48) | 300
(2 studies) | ⊕⊕⊕⊝
moderate | Data for ALA‐PDT was given separately for two studies but not for placebo. Data from assessment after treatment (Analysis 47.7) |
| 3% diclofenac in 2.5% hyaluronic acid gel + 4h ALA‐red light PDT /2.5% hyaluronic acid gel + 4h ALA‐red light PDT (field‐directedtreatments) | ‐ | ‐ | ‐ | ‐ | ‐ | Not reported |
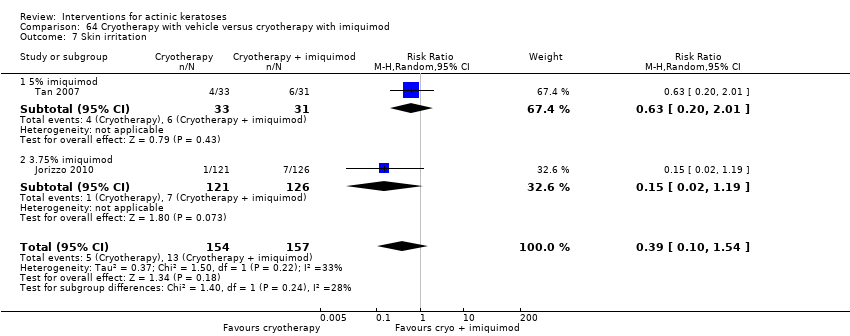
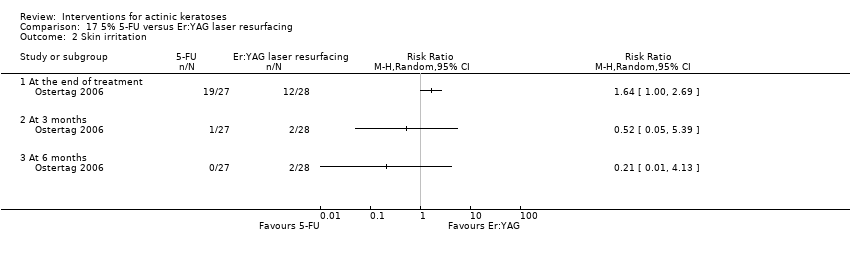
| 4h ALA‐red light PDT /Cryotherapy (individual lesions) | 101 per 1000 | 371 per 1000
(220 to 627) | RR 3.69
(2.19 to 6.23) | 297
(1 study) | ⊕⊕⊝⊝
low | Assessment one day after the treatment (Analysis 51.2) |
| ALA‐red light PDT (individual lesions)/5% imiquimod (field‐directedtreatment) | ‐ | ‐ | ‐ | ‐ | ‐ | Not reported |
| ALA‐blue light PDT + 5% imiquimod / ALA‐blue light PDT + placebo (field‐directedtreatments) | ‐ | ‐ | ‐ | ‐ | ‐ | Not reported |
| ALA‐PDT versus MAL‐PDT |
| 5h ALA‐red light PDT /3h MAL‐red light PDT (field‐directedtreatments) | ‐ | ‐ | ‐ | ‐ | ‐ | Not reported |
| MAL‐PDT |
| All comparisons | ‐ | ‐ | ‐ | ‐ | ‐ | Not reported |


![Comparison 47 ALA‐PDT versus placebo‐PDT, Outcome 1 Participant complete clearance [1 treatment].](/es/cdsr/doi/10.1002/14651858.CD004415.pub2/media/CDSR/CD004415/image_n/nCD004415-CMP-047-01.png)
![Comparison 47 ALA‐PDT versus placebo‐PDT, Outcome 2 Participant complete clearance [1 or 2 treatments].](/es/cdsr/doi/10.1002/14651858.CD004415.pub2/media/CDSR/CD004415/image_n/nCD004415-CMP-047-02.png)
![Comparison 47 ALA‐PDT versus placebo‐PDT, Outcome 3 Participant complete clearance [1 or 2 treatments] by anatomical location.](/es/cdsr/doi/10.1002/14651858.CD004415.pub2/media/CDSR/CD004415/image_n/nCD004415-CMP-047-03.png)
![Comparison 47 ALA‐PDT versus placebo‐PDT, Outcome 4 Participant partial (> 75%) clearance [1 treatment].](/es/cdsr/doi/10.1002/14651858.CD004415.pub2/media/CDSR/CD004415/image_n/nCD004415-CMP-047-04.png)
![Comparison 47 ALA‐PDT versus placebo‐PDT, Outcome 5 Participant partial (>75%) clearance[1 or 2 treatments].](/es/cdsr/doi/10.1002/14651858.CD004415.pub2/media/CDSR/CD004415/image_n/nCD004415-CMP-047-05.png)
![Comparison 47 ALA‐PDT versus placebo‐PDT, Outcome 6 Participant partial (>75%) clearance [1 or 2 treatment] by anatomical location.](/es/cdsr/doi/10.1002/14651858.CD004415.pub2/media/CDSR/CD004415/image_n/nCD004415-CMP-047-06.png)