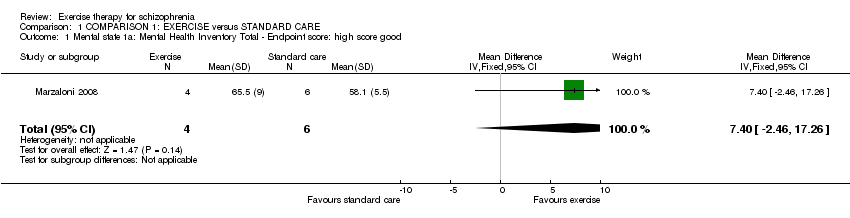
| 1 Mental state 1a: Mental Health Inventory Total ‐ Endpoint score: high score good Show forest plot | 1 | 10 | Mean Difference (IV, Fixed, 95% CI) | 7.40 [‐2.46, 17.26] |
|
| 2 Mental State 1b: Mental Health Inventory Depression ‐ Endpoint: high score good Show forest plot | 1 | 10 | Mean Difference (IV, Fixed, 95% CI) | 17.5 [6.70, 28.30] |
|
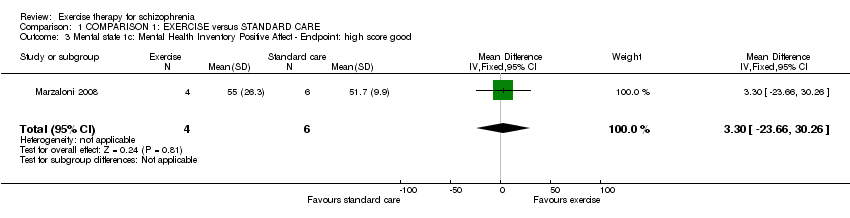
| 3 Mental state 1c: Mental Health Inventory Positive Affect ‐ Endpoint: high score good Show forest plot | 1 | 10 | Mean Difference (IV, Fixed, 95% CI) | 3.30 [‐23.66, 30.26] |
|
| 4 Mental state 1d: Mental Health Inventory Behavioural ‐ Endpoint: high score good Show forest plot | 1 | 10 | Mean Difference (IV, Fixed, 95% CI) | ‐5.40 [‐21.28, 10.48] |
|
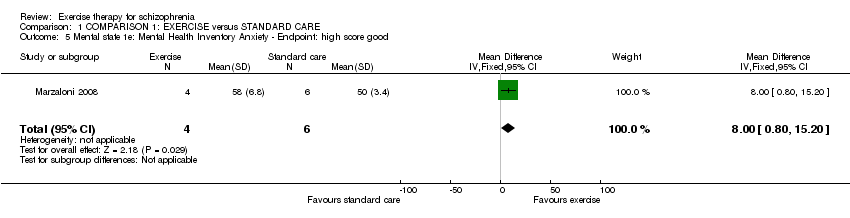
| 5 Mental state 1e: Mental Health Inventory Anxiety ‐ Endpoint: high score good Show forest plot | 1 | 10 | Mean Difference (IV, Fixed, 95% CI) | 8.0 [0.80, 15.20] |
|
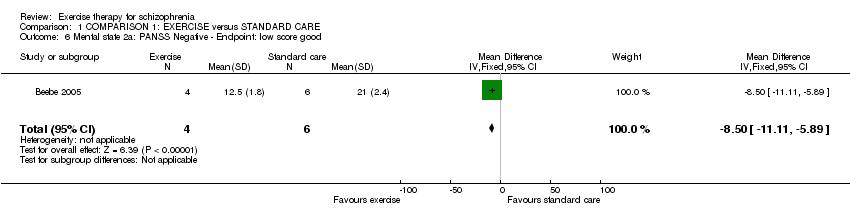
| 6 Mental state 2a: PANSS Negative ‐ Endpoint: low score good Show forest plot | 1 | 10 | Mean Difference (IV, Fixed, 95% CI) | ‐8.5 [‐11.11, ‐5.89] |
|
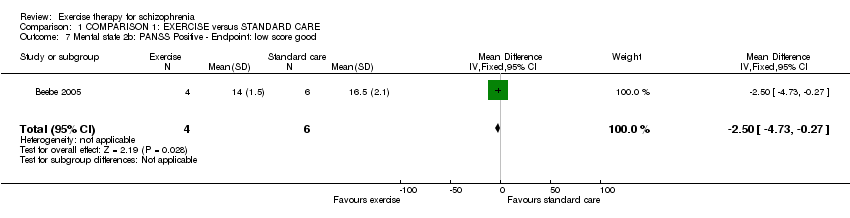
| 7 Mental state 2b: PANSS Positive ‐ Endpoint: low score good Show forest plot | 1 | 10 | Mean Difference (IV, Fixed, 95% CI) | ‐2.5 [‐4.73, ‐0.27] |
|
| 8 Physical fitness 1: Six minute walking test ‐ Endpoint: High score good Show forest plot | 1 | 13 | Mean Difference (IV, Fixed, 95% CI) | 79.50 [33.82, 125.18] |
|
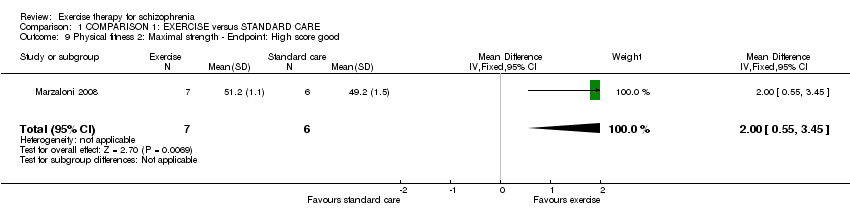
| 9 Physical fitness 2: Maximal strength ‐ Endpoint: High score good Show forest plot | 1 | 13 | Mean Difference (IV, Fixed, 95% CI) | 2.0 [0.55, 3.45] |
|
| 10 Physical Fitness 3: Cardiovascular measures 1: Blood pressure Show forest plot | 1 | 13 | Mean Difference (IV, Fixed, 95% CI) | ‐1.0 [‐8.05, 6.05] |
|
| 11 Weight 1: BMI Show forest plot | 1 | 13 | Mean Difference (IV, Fixed, 95% CI) | ‐1.20 [‐2.92, 0.52] |
|
| 12 Weight 2: Percentage body fat Show forest plot | | | Other data | No numeric data |
|
| 13 Weight 3: Waist and Hip Ratio Show forest plot | 1 | 13 | Mean Difference (IV, Fixed, 95% CI) | 0.01 [‐0.02, 0.04] |
|
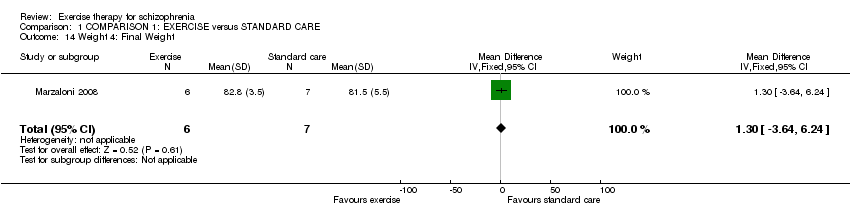
| 14 Weight 4: Final Weight Show forest plot | 1 | 13 | Mean Difference (IV, Fixed, 95% CI) | 1.30 [‐3.64, 6.24] |
|
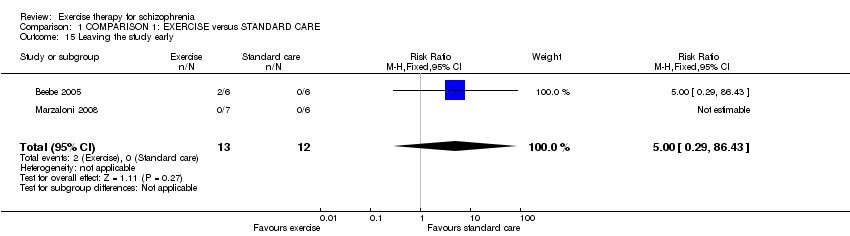
| 15 Leaving the study early Show forest plot | 2 | 25 | Risk Ratio (M‐H, Fixed, 95% CI) | 5.0 [0.29, 86.43] |
|