Terapia de ejercicios para la esquizofrenia
Referencias
References to studies included in this review
References to studies excluded from this review
References to studies awaiting assessment
References to ongoing studies
Additional references
Characteristics of studies
Characteristics of included studies [ordered by study ID]
| Methods | Allocation: randomised. | |
| Participants | Diagnosis: schizophrenia (DSM‐IV). | |
| Interventions | 1. Exercise Group: exercise programme 3x a week. 10 minute warm up stretches in addition to walking on a treadmill; participants increased their walking time from 5 minutes on the first day to 30 minutes. N=6. 2. Standard care: participants continued usual care and were placed on waiting list and then received identical intervention at the conclusion of the study. N=6. Data was taken only from the time participants received standard care. | |
| Outcomes | Mental state: PANSS positive, negative score. Unable to use ‐ | |
| Notes | ||
| Risk of bias | ||
| Bias | Authors' judgement | Support for judgement |
| Adequate sequence generation? | Low risk | Allocation schedule designed by statistician. |
| Allocation concealment? | Unclear risk | No details given. |
| Blinding? | Low risk | Single, researcher blinded to group status, untested. |
| Incomplete outcome data addressed? | High risk | 83.3% of participants in the analysis (10/12). Two participants in the exercise arm did not attend first session. These participants were excluded from the results. |
| Free of selective reporting? | High risk | Several SDs were not reported for PANSS, BMI, and Percentage Body Fat. |
| Free of other bias? | High risk | Small sample size. |
| Methods | Allocation: randomised. | |
| Participants | Diagnosis: schizophrenia, any subtype, DSM‐IV. | |
| Interventions | 1. Exercise Group: brisk walking, jogging, exercises in standing and sitting postures and relaxation. Participants underwent three weeks of training and then continued with the programme for the remaining three months. Participants met for 1 hour a day, 5 days a week. N=30. 2. Other treatment: yoga with breathing practice and relaxation techniques. Participants underwent three weeks of training and then continued with the programme for the remaining three months. Participants met for 1 hour a day, 5 days a week. N=31. | |
| Outcomes | Mental State: PANSS positive, negative, depression, anergia, total score. Unable to use ‐ | |
| Notes | ||
| Risk of bias | ||
| Bias | Authors' judgement | Support for judgement |
| Adequate sequence generation? | Low risk | Computer generated. |
| Allocation concealment? | Unclear risk | No details given. |
| Blinding? | Low risk | Single, researcher blinded to group status, untested. |
| Incomplete outcome data addressed? | High risk | 67.2% of participants in the analysis (41/61). Then participants in each study arm left early because of disinterest and long distance from hospital. These participants were excluded from the results. |
| Free of selective reporting? | High risk | Quality of life total data not reported. |
| Free of other bias? | High risk | No true control group used. Exercise compared with yoga. Same therapist delivered both conditions. |
| Methods | Allocation: randomised. | |
| Participants | Diagnosis: schizophrenia, any subtype, DSM‐IV. | |
| Interventions | 1. Exercise Group: each session consisted of a 10 minute warm‐up, 20 minutes of resistance weight training, 60 minutes of aerobic training, and a 5 minute cool‐down. Participants met twice a week for 12 weeks. Each session was 90 minutes in length. Participants were encouraged to exercise one additional time per week on their own. N=7. 2. Standard care: continued usual care; no further details were provided. N=6. | |
| Outcomes | Mental state: Mental Health Inventory (MHI) ‐ total, depression, positive affect, behavioral, anxiety scores. Unable to use ‐ | |
| Notes | ||
| Risk of bias | ||
| Bias | Authors' judgement | Support for judgement |
| Adequate sequence generation? | Low risk | Two options for group assignments were identified on |
| Allocation concealment? | Low risk | Random draw by an independent observer uninvolved |
| Blinding? | Unclear risk | Single, researcher blinded to group status, untested. |
| Incomplete outcome data addressed? | Low risk | 100% of participants in the analysis (13/13). |
| Free of selective reporting? | High risk | Not all anthropometric measurements were reported. |
| Free of other bias? | High risk | Small sample size. |
Characteristics of excluded studies [author‐defined order]
| Study | Reason for exclusion |
| Allocation: quasi‐experimental design. | |
| Allocation: unclear. | |
| Allocation: randomised. | |
| Allocation: randomised. | |
| Allocation: randomised. | |
| Allocation: randomised. | |
| Allocation: randomised. | |
| Allocation: randomised. | |
| Allocation: randomised. | |
| Allocation: randomised |
Characteristics of studies awaiting assessment [ordered by study ID]
| Methods | Allocation: randomised. |
| Participants | Diagnosis: schizophrenia. |
| Interventions | Exercise Therapy Group: unclear, no details provided. N=30. |
| Outcomes | Unclear, no details provided. |
| Notes | Paper needs to be translated. |
| Methods | Allocation: randomised. |
| Participants | Diagnosis: schizophrenia (ICD 10, F20). |
| Interventions | Physical activity Group: unclear, no details provided. |
| Outcomes | Mental State. PANSS. |
| Notes | Details being sought from author. |
| Methods | Allocation: randomised. |
| Participants | Diagnosis: schizophrenia. |
| Interventions | Jianshen Gymnastics Group: Jianshen gymnastics and common treatment. |
| Outcomes | Mental state. PANSS, SANS. |
| Notes | Paper needs to be translated. |
| Methods | Allocation: randomised. |
| Participants | Diagnosis: schizophrenia. |
| Interventions | Horse Riding Group: Unclear, no details provided. |
| Outcomes | Unclear, no details provided. |
| Notes | Paper needs to be translated. |
| Methods | Allocation: randomised. |
| Participants | Diagnosis: Schizophrenia. |
| Interventions | Exercise Therapy: unclear, no details provided. |
| Outcomes | Mental State. PANSS. |
| Notes | Paper needs to be translated to obtain further details. |
| Methods | Allocation: randomised. |
| Participants | Diagnosis: schizophrenia. |
| Interventions | Yoga Group: yoga exercises for 8 weeks in addition to antipsychotic treatment. N=38. |
| Outcomes | Quality of Life. |
| Notes | Paper needs to be translated to obtain further details. |
| Methods | Allocation: randomised. |
| Participants | Diagnosis: schizophrenia. |
| Interventions | Exercise Therapy: unclear, no details provided. |
| Outcomes | Nurses' observation scale for inpatient evaluation (NOSIE). |
| Notes | Paper needs to be translated to obtain further details. |
Characteristics of ongoing studies [ordered by study ID]
| Trial name or title | Effectiveness of a lifestyle intervention for increasing physical activity in adults with schizophrenia. |
| Methods | Allocation: randomised. Setting: San Diego, CA. |
| Participants | Diagnosis: schizophrenia. |
| Interventions | Physical activity and leisure Group: 90 minute sessions conducted weekly for the first 16 weeks, then biweekly for the following 8 weeks. Sessions will focus on short and long term goals, learning about physical activity, and playing leisure activities (e.g., board games). Participants will also have opportunities to socialise with each other. Control Group: unclear, no details provided. |
| Outcomes | Physical Fitness. Cardiovascular Measures. |
| Starting date | June 2006. |
| Contact information | Laurie Lindamer UC San Diego 858 552 8585 x3870 |
| Notes |
Data and analyses
| Outcome or subgroup title | No. of studies | No. of participants | Statistical method | Effect size | |||||||||
| 1 Mental state 1a: Mental Health Inventory Total ‐ Endpoint score: high score good Show forest plot | 1 | 10 | Mean Difference (IV, Fixed, 95% CI) | 7.40 [‐2.46, 17.26] | |||||||||
| Analysis 1.1  Comparison 1 COMPARISON 1: EXERCISE versus STANDARD CARE, Outcome 1 Mental state 1a: Mental Health Inventory Total ‐ Endpoint score: high score good. | |||||||||||||
| 2 Mental State 1b: Mental Health Inventory Depression ‐ Endpoint: high score good Show forest plot | 1 | 10 | Mean Difference (IV, Fixed, 95% CI) | 17.5 [6.70, 28.30] | |||||||||
| Analysis 1.2  Comparison 1 COMPARISON 1: EXERCISE versus STANDARD CARE, Outcome 2 Mental State 1b: Mental Health Inventory Depression ‐ Endpoint: high score good. | |||||||||||||
| 3 Mental state 1c: Mental Health Inventory Positive Affect ‐ Endpoint: high score good Show forest plot | 1 | 10 | Mean Difference (IV, Fixed, 95% CI) | 3.30 [‐23.66, 30.26] | |||||||||
| Analysis 1.3  Comparison 1 COMPARISON 1: EXERCISE versus STANDARD CARE, Outcome 3 Mental state 1c: Mental Health Inventory Positive Affect ‐ Endpoint: high score good. | |||||||||||||
| 4 Mental state 1d: Mental Health Inventory Behavioural ‐ Endpoint: high score good Show forest plot | 1 | 10 | Mean Difference (IV, Fixed, 95% CI) | ‐5.40 [‐21.28, 10.48] | |||||||||
| Analysis 1.4  Comparison 1 COMPARISON 1: EXERCISE versus STANDARD CARE, Outcome 4 Mental state 1d: Mental Health Inventory Behavioural ‐ Endpoint: high score good. | |||||||||||||
| 5 Mental state 1e: Mental Health Inventory Anxiety ‐ Endpoint: high score good Show forest plot | 1 | 10 | Mean Difference (IV, Fixed, 95% CI) | 8.0 [0.80, 15.20] | |||||||||
| Analysis 1.5  Comparison 1 COMPARISON 1: EXERCISE versus STANDARD CARE, Outcome 5 Mental state 1e: Mental Health Inventory Anxiety ‐ Endpoint: high score good. | |||||||||||||
| 6 Mental state 2a: PANSS Negative ‐ Endpoint: low score good Show forest plot | 1 | 10 | Mean Difference (IV, Fixed, 95% CI) | ‐8.5 [‐11.11, ‐5.89] | |||||||||
| Analysis 1.6  Comparison 1 COMPARISON 1: EXERCISE versus STANDARD CARE, Outcome 6 Mental state 2a: PANSS Negative ‐ Endpoint: low score good. | |||||||||||||
| 7 Mental state 2b: PANSS Positive ‐ Endpoint: low score good Show forest plot | 1 | 10 | Mean Difference (IV, Fixed, 95% CI) | ‐2.5 [‐4.73, ‐0.27] | |||||||||
| Analysis 1.7  Comparison 1 COMPARISON 1: EXERCISE versus STANDARD CARE, Outcome 7 Mental state 2b: PANSS Positive ‐ Endpoint: low score good. | |||||||||||||
| 8 Physical fitness 1: Six minute walking test ‐ Endpoint: High score good Show forest plot | 1 | 13 | Mean Difference (IV, Fixed, 95% CI) | 79.50 [33.82, 125.18] | |||||||||
| Analysis 1.8  Comparison 1 COMPARISON 1: EXERCISE versus STANDARD CARE, Outcome 8 Physical fitness 1: Six minute walking test ‐ Endpoint: High score good. | |||||||||||||
| 9 Physical fitness 2: Maximal strength ‐ Endpoint: High score good Show forest plot | 1 | 13 | Mean Difference (IV, Fixed, 95% CI) | 2.0 [0.55, 3.45] | |||||||||
| Analysis 1.9  Comparison 1 COMPARISON 1: EXERCISE versus STANDARD CARE, Outcome 9 Physical fitness 2: Maximal strength ‐ Endpoint: High score good. | |||||||||||||
| 10 Physical Fitness 3: Cardiovascular measures 1: Blood pressure Show forest plot | 1 | 13 | Mean Difference (IV, Fixed, 95% CI) | ‐1.0 [‐8.05, 6.05] | |||||||||
| Analysis 1.10  Comparison 1 COMPARISON 1: EXERCISE versus STANDARD CARE, Outcome 10 Physical Fitness 3: Cardiovascular measures 1: Blood pressure. | |||||||||||||
| 11 Weight 1: BMI Show forest plot | 1 | 13 | Mean Difference (IV, Fixed, 95% CI) | ‐1.20 [‐2.92, 0.52] | |||||||||
| Analysis 1.11  Comparison 1 COMPARISON 1: EXERCISE versus STANDARD CARE, Outcome 11 Weight 1: BMI. | |||||||||||||
| 12 Weight 2: Percentage body fat Show forest plot | Other data | No numeric data | |||||||||||
| Analysis 1.12
Comparison 1 COMPARISON 1: EXERCISE versus STANDARD CARE, Outcome 12 Weight 2: Percentage body fat. | |||||||||||||
| 13 Weight 3: Waist and Hip Ratio Show forest plot | 1 | 13 | Mean Difference (IV, Fixed, 95% CI) | 0.01 [‐0.02, 0.04] | |||||||||
| Analysis 1.13  Comparison 1 COMPARISON 1: EXERCISE versus STANDARD CARE, Outcome 13 Weight 3: Waist and Hip Ratio. | |||||||||||||
| 14 Weight 4: Final Weight Show forest plot | 1 | 13 | Mean Difference (IV, Fixed, 95% CI) | 1.30 [‐3.64, 6.24] | |||||||||
| Analysis 1.14  Comparison 1 COMPARISON 1: EXERCISE versus STANDARD CARE, Outcome 14 Weight 4: Final Weight. | |||||||||||||
| 15 Leaving the study early Show forest plot | 2 | 25 | Risk Ratio (M‐H, Fixed, 95% CI) | 5.0 [0.29, 86.43] | |||||||||
| Analysis 1.15  Comparison 1 COMPARISON 1: EXERCISE versus STANDARD CARE, Outcome 15 Leaving the study early. | |||||||||||||
| Outcome or subgroup title | No. of studies | No. of participants | Statistical method | Effect size |
| 1 Mental state 1a: PANSS Total ‐ Endpoint: low score good Show forest plot | 1 | 41 | Mean Difference (IV, Fixed, 95% CI) | 14.95 [2.60, 27.30] |
| Analysis 2.1  Comparison 2 COMPARISON 2: EXERCISE versus OTHER TREATMENT, Outcome 1 Mental state 1a: PANSS Total ‐ Endpoint: low score good. | ||||
| 2 Mental state 1b: PANSS Depression ‐ Endpoint: low score good Show forest plot | 1 | 41 | Mean Difference (IV, Fixed, 95% CI) | 2.89 [0.86, 4.92] |
| Analysis 2.2  Comparison 2 COMPARISON 2: EXERCISE versus OTHER TREATMENT, Outcome 2 Mental state 1b: PANSS Depression ‐ Endpoint: low score good. | ||||
| 3 Mental state 1c: PANSS Anergia ‐ Endpoint: low score good Show forest plot | 1 | 41 | Mean Difference (IV, Fixed, 95% CI) | 2.40 [0.47, 4.33] |
| Analysis 2.3  Comparison 2 COMPARISON 2: EXERCISE versus OTHER TREATMENT, Outcome 3 Mental state 1c: PANSS Anergia ‐ Endpoint: low score good. | ||||
| 4 Mental state 1d: PANSS Positive ‐ Endpoint: low score good Show forest plot | 1 | 41 | Mean Difference (IV, Fixed, 95% CI) | 2.41 [‐1.20, 6.02] |
| Analysis 2.4  Comparison 2 COMPARISON 2: EXERCISE versus OTHER TREATMENT, Outcome 4 Mental state 1d: PANSS Positive ‐ Endpoint: low score good. | ||||
| 5 Mental state 1d: PANSS Negative ‐ Endpoint: low score good Show forest plot | 1 | 41 | Mean Difference (IV, Fixed, 95% CI) | 5.56 [1.69, 9.43] |
| Analysis 2.5  Comparison 2 COMPARISON 2: EXERCISE versus OTHER TREATMENT, Outcome 5 Mental state 1d: PANSS Negative ‐ Endpoint: low score good. | ||||
| 6 General functioning 1: SOFS ‐ Endpoint: low score good Show forest plot | 1 | 41 | Mean Difference (IV, Fixed, 95% CI) | 4.35 [‐1.18, 9.88] |
| Analysis 2.6  Comparison 2 COMPARISON 2: EXERCISE versus OTHER TREATMENT, Outcome 6 General functioning 1: SOFS ‐ Endpoint: low score good. | ||||
| 7 Adverse effects 1: SAS ‐ Endpoint: low score good Show forest plot | 1 | 41 | Mean Difference (IV, Fixed, 95% CI) | 0.5 [‐0.44, 1.44] |
| Analysis 2.7  Comparison 2 COMPARISON 2: EXERCISE versus OTHER TREATMENT, Outcome 7 Adverse effects 1: SAS ‐ Endpoint: low score good. | ||||
| 8 Adverse effects 2: AIMS ‐ Endpoint: low score good Show forest plot | 1 | 41 | Mean Difference (IV, Fixed, 95% CI) | 0.20 [‐1.18, 1.58] |
| Analysis 2.8  Comparison 2 COMPARISON 2: EXERCISE versus OTHER TREATMENT, Outcome 8 Adverse effects 2: AIMS ‐ Endpoint: low score good. | ||||
| 9 Quality of life 1a: WHOQOL‐100 Physical ‐ Endpoint: High score good Show forest plot | 1 | 41 | Mean Difference (IV, Fixed, 95% CI) | ‐9.22 [‐18.86, 0.42] |
| Analysis 2.9  Comparison 2 COMPARISON 2: EXERCISE versus OTHER TREATMENT, Outcome 9 Quality of life 1a: WHOQOL‐100 Physical ‐ Endpoint: High score good. | ||||
| 10 Quality of life 1b: WHOQOL‐100 Psychological ‐ Endpoint: High score good Show forest plot | 1 | 41 | Mean Difference (IV, Fixed, 95% CI) | ‐17.70 [‐28.90, ‐6.50] |
| Analysis 2.10  Comparison 2 COMPARISON 2: EXERCISE versus OTHER TREATMENT, Outcome 10 Quality of life 1b: WHOQOL‐100 Psychological ‐ Endpoint: High score good. | ||||
| 11 Quality of life 1c: WHOQOL‐100 Social ‐ Endpoint: High score good Show forest plot | 1 | 41 | Mean Difference (IV, Fixed, 95% CI) | ‐20.75 [‐34.08, ‐7.42] |
| Analysis 2.11  Comparison 2 COMPARISON 2: EXERCISE versus OTHER TREATMENT, Outcome 11 Quality of life 1c: WHOQOL‐100 Social ‐ Endpoint: High score good. | ||||
| 12 Quality of life 1d: WHOQOL‐100 Environmental ‐ Endpoint: High score good Show forest plot | 1 | 41 | Mean Difference (IV, Fixed, 95% CI) | ‐18.09 [‐28.52, ‐7.66] |
| Analysis 2.12  Comparison 2 COMPARISON 2: EXERCISE versus OTHER TREATMENT, Outcome 12 Quality of life 1d: WHOQOL‐100 Environmental ‐ Endpoint: High score good. | ||||
| 13 Leaving the study early Show forest plot | 1 | 61 | Risk Ratio (M‐H, Fixed, 95% CI) | 0.94 [0.47, 1.88] |
| Analysis 2.13  Comparison 2 COMPARISON 2: EXERCISE versus OTHER TREATMENT, Outcome 13 Leaving the study early. | ||||

Methodological quality summary: review authors' judgements about each methodological quality item for each included study.

Methodological quality graph: review authors' judgements about each methodological quality item presented as percentages across all included studies.
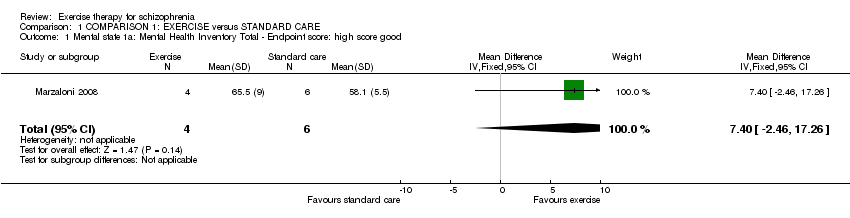
Comparison 1 COMPARISON 1: EXERCISE versus STANDARD CARE, Outcome 1 Mental state 1a: Mental Health Inventory Total ‐ Endpoint score: high score good.

Comparison 1 COMPARISON 1: EXERCISE versus STANDARD CARE, Outcome 2 Mental State 1b: Mental Health Inventory Depression ‐ Endpoint: high score good.
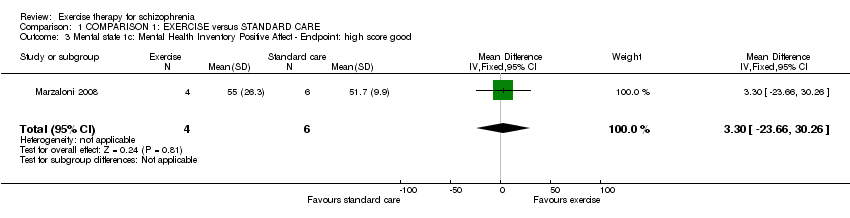
Comparison 1 COMPARISON 1: EXERCISE versus STANDARD CARE, Outcome 3 Mental state 1c: Mental Health Inventory Positive Affect ‐ Endpoint: high score good.

Comparison 1 COMPARISON 1: EXERCISE versus STANDARD CARE, Outcome 4 Mental state 1d: Mental Health Inventory Behavioural ‐ Endpoint: high score good.
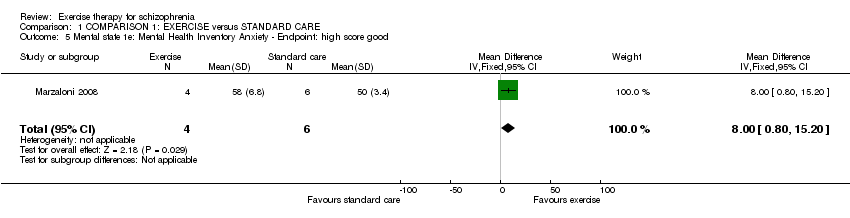
Comparison 1 COMPARISON 1: EXERCISE versus STANDARD CARE, Outcome 5 Mental state 1e: Mental Health Inventory Anxiety ‐ Endpoint: high score good.
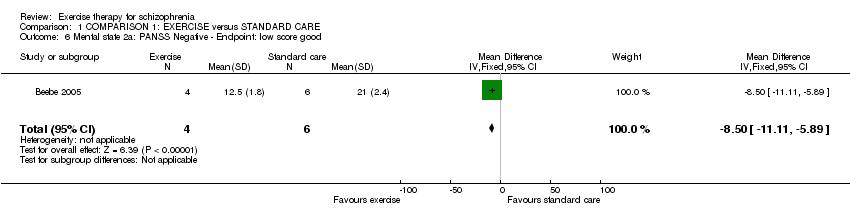
Comparison 1 COMPARISON 1: EXERCISE versus STANDARD CARE, Outcome 6 Mental state 2a: PANSS Negative ‐ Endpoint: low score good.
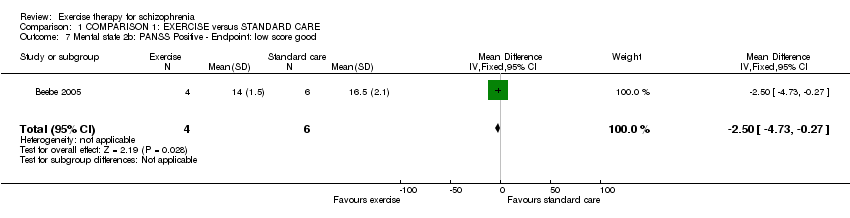
Comparison 1 COMPARISON 1: EXERCISE versus STANDARD CARE, Outcome 7 Mental state 2b: PANSS Positive ‐ Endpoint: low score good.

Comparison 1 COMPARISON 1: EXERCISE versus STANDARD CARE, Outcome 8 Physical fitness 1: Six minute walking test ‐ Endpoint: High score good.
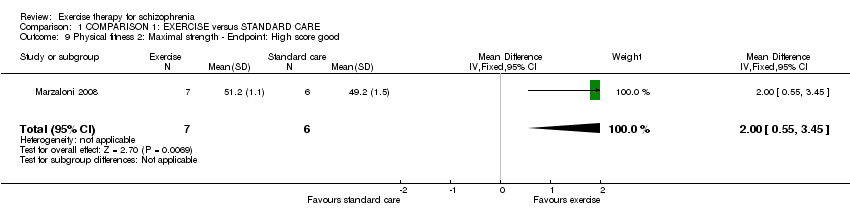
Comparison 1 COMPARISON 1: EXERCISE versus STANDARD CARE, Outcome 9 Physical fitness 2: Maximal strength ‐ Endpoint: High score good.

Comparison 1 COMPARISON 1: EXERCISE versus STANDARD CARE, Outcome 10 Physical Fitness 3: Cardiovascular measures 1: Blood pressure.

Comparison 1 COMPARISON 1: EXERCISE versus STANDARD CARE, Outcome 11 Weight 1: BMI.
| Study | Exercise Group | Standard care Group |
| Beebe 2005 | reduced body fat by 3.7% | reduced body fat by 0.02% |
Comparison 1 COMPARISON 1: EXERCISE versus STANDARD CARE, Outcome 12 Weight 2: Percentage body fat.

Comparison 1 COMPARISON 1: EXERCISE versus STANDARD CARE, Outcome 13 Weight 3: Waist and Hip Ratio.
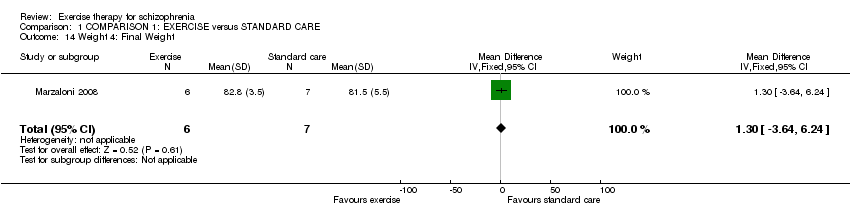
Comparison 1 COMPARISON 1: EXERCISE versus STANDARD CARE, Outcome 14 Weight 4: Final Weight.
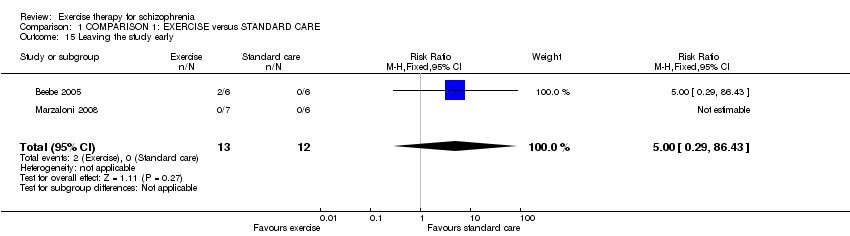
Comparison 1 COMPARISON 1: EXERCISE versus STANDARD CARE, Outcome 15 Leaving the study early.
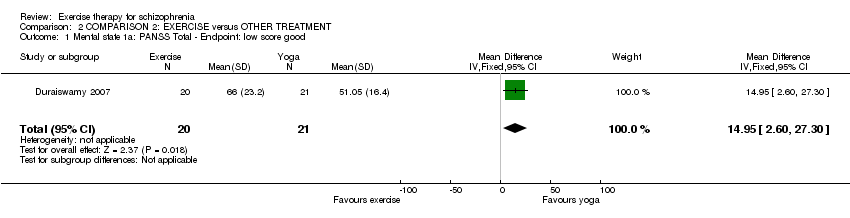
Comparison 2 COMPARISON 2: EXERCISE versus OTHER TREATMENT, Outcome 1 Mental state 1a: PANSS Total ‐ Endpoint: low score good.

Comparison 2 COMPARISON 2: EXERCISE versus OTHER TREATMENT, Outcome 2 Mental state 1b: PANSS Depression ‐ Endpoint: low score good.
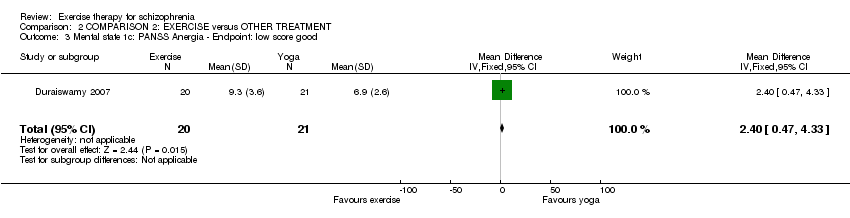
Comparison 2 COMPARISON 2: EXERCISE versus OTHER TREATMENT, Outcome 3 Mental state 1c: PANSS Anergia ‐ Endpoint: low score good.

Comparison 2 COMPARISON 2: EXERCISE versus OTHER TREATMENT, Outcome 4 Mental state 1d: PANSS Positive ‐ Endpoint: low score good.

Comparison 2 COMPARISON 2: EXERCISE versus OTHER TREATMENT, Outcome 5 Mental state 1d: PANSS Negative ‐ Endpoint: low score good.

Comparison 2 COMPARISON 2: EXERCISE versus OTHER TREATMENT, Outcome 6 General functioning 1: SOFS ‐ Endpoint: low score good.

Comparison 2 COMPARISON 2: EXERCISE versus OTHER TREATMENT, Outcome 7 Adverse effects 1: SAS ‐ Endpoint: low score good.

Comparison 2 COMPARISON 2: EXERCISE versus OTHER TREATMENT, Outcome 8 Adverse effects 2: AIMS ‐ Endpoint: low score good.
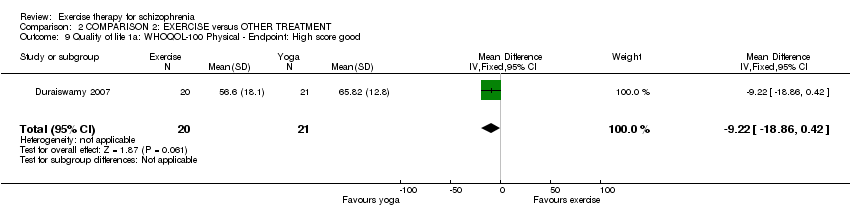
Comparison 2 COMPARISON 2: EXERCISE versus OTHER TREATMENT, Outcome 9 Quality of life 1a: WHOQOL‐100 Physical ‐ Endpoint: High score good.

Comparison 2 COMPARISON 2: EXERCISE versus OTHER TREATMENT, Outcome 10 Quality of life 1b: WHOQOL‐100 Psychological ‐ Endpoint: High score good.

Comparison 2 COMPARISON 2: EXERCISE versus OTHER TREATMENT, Outcome 11 Quality of life 1c: WHOQOL‐100 Social ‐ Endpoint: High score good.
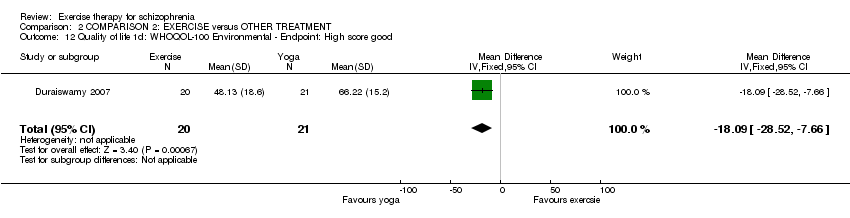
Comparison 2 COMPARISON 2: EXERCISE versus OTHER TREATMENT, Outcome 12 Quality of life 1d: WHOQOL‐100 Environmental ‐ Endpoint: High score good.

Comparison 2 COMPARISON 2: EXERCISE versus OTHER TREATMENT, Outcome 13 Leaving the study early.
| Outcome or subgroup title | No. of studies | No. of participants | Statistical method | Effect size |
| 1 Mental state 1a: Mental Health Inventory Total ‐ Endpoint score: high score good Show forest plot | 1 | 10 | Mean Difference (IV, Fixed, 95% CI) | 7.40 [‐2.46, 17.26] |
| 2 Mental State 1b: Mental Health Inventory Depression ‐ Endpoint: high score good Show forest plot | 1 | 10 | Mean Difference (IV, Fixed, 95% CI) | 17.5 [6.70, 28.30] |
| 3 Mental state 1c: Mental Health Inventory Positive Affect ‐ Endpoint: high score good Show forest plot | 1 | 10 | Mean Difference (IV, Fixed, 95% CI) | 3.30 [‐23.66, 30.26] |
| 4 Mental state 1d: Mental Health Inventory Behavioural ‐ Endpoint: high score good Show forest plot | 1 | 10 | Mean Difference (IV, Fixed, 95% CI) | ‐5.40 [‐21.28, 10.48] |
| 5 Mental state 1e: Mental Health Inventory Anxiety ‐ Endpoint: high score good Show forest plot | 1 | 10 | Mean Difference (IV, Fixed, 95% CI) | 8.0 [0.80, 15.20] |
| 6 Mental state 2a: PANSS Negative ‐ Endpoint: low score good Show forest plot | 1 | 10 | Mean Difference (IV, Fixed, 95% CI) | ‐8.5 [‐11.11, ‐5.89] |
| 7 Mental state 2b: PANSS Positive ‐ Endpoint: low score good Show forest plot | 1 | 10 | Mean Difference (IV, Fixed, 95% CI) | ‐2.5 [‐4.73, ‐0.27] |
| 8 Physical fitness 1: Six minute walking test ‐ Endpoint: High score good Show forest plot | 1 | 13 | Mean Difference (IV, Fixed, 95% CI) | 79.50 [33.82, 125.18] |
| 9 Physical fitness 2: Maximal strength ‐ Endpoint: High score good Show forest plot | 1 | 13 | Mean Difference (IV, Fixed, 95% CI) | 2.0 [0.55, 3.45] |
| 10 Physical Fitness 3: Cardiovascular measures 1: Blood pressure Show forest plot | 1 | 13 | Mean Difference (IV, Fixed, 95% CI) | ‐1.0 [‐8.05, 6.05] |
| 11 Weight 1: BMI Show forest plot | 1 | 13 | Mean Difference (IV, Fixed, 95% CI) | ‐1.20 [‐2.92, 0.52] |
| 12 Weight 2: Percentage body fat Show forest plot | Other data | No numeric data | ||
| 13 Weight 3: Waist and Hip Ratio Show forest plot | 1 | 13 | Mean Difference (IV, Fixed, 95% CI) | 0.01 [‐0.02, 0.04] |
| 14 Weight 4: Final Weight Show forest plot | 1 | 13 | Mean Difference (IV, Fixed, 95% CI) | 1.30 [‐3.64, 6.24] |
| 15 Leaving the study early Show forest plot | 2 | 25 | Risk Ratio (M‐H, Fixed, 95% CI) | 5.0 [0.29, 86.43] |
| Outcome or subgroup title | No. of studies | No. of participants | Statistical method | Effect size |
| 1 Mental state 1a: PANSS Total ‐ Endpoint: low score good Show forest plot | 1 | 41 | Mean Difference (IV, Fixed, 95% CI) | 14.95 [2.60, 27.30] |
| 2 Mental state 1b: PANSS Depression ‐ Endpoint: low score good Show forest plot | 1 | 41 | Mean Difference (IV, Fixed, 95% CI) | 2.89 [0.86, 4.92] |
| 3 Mental state 1c: PANSS Anergia ‐ Endpoint: low score good Show forest plot | 1 | 41 | Mean Difference (IV, Fixed, 95% CI) | 2.40 [0.47, 4.33] |
| 4 Mental state 1d: PANSS Positive ‐ Endpoint: low score good Show forest plot | 1 | 41 | Mean Difference (IV, Fixed, 95% CI) | 2.41 [‐1.20, 6.02] |
| 5 Mental state 1d: PANSS Negative ‐ Endpoint: low score good Show forest plot | 1 | 41 | Mean Difference (IV, Fixed, 95% CI) | 5.56 [1.69, 9.43] |
| 6 General functioning 1: SOFS ‐ Endpoint: low score good Show forest plot | 1 | 41 | Mean Difference (IV, Fixed, 95% CI) | 4.35 [‐1.18, 9.88] |
| 7 Adverse effects 1: SAS ‐ Endpoint: low score good Show forest plot | 1 | 41 | Mean Difference (IV, Fixed, 95% CI) | 0.5 [‐0.44, 1.44] |
| 8 Adverse effects 2: AIMS ‐ Endpoint: low score good Show forest plot | 1 | 41 | Mean Difference (IV, Fixed, 95% CI) | 0.20 [‐1.18, 1.58] |
| 9 Quality of life 1a: WHOQOL‐100 Physical ‐ Endpoint: High score good Show forest plot | 1 | 41 | Mean Difference (IV, Fixed, 95% CI) | ‐9.22 [‐18.86, 0.42] |
| 10 Quality of life 1b: WHOQOL‐100 Psychological ‐ Endpoint: High score good Show forest plot | 1 | 41 | Mean Difference (IV, Fixed, 95% CI) | ‐17.70 [‐28.90, ‐6.50] |
| 11 Quality of life 1c: WHOQOL‐100 Social ‐ Endpoint: High score good Show forest plot | 1 | 41 | Mean Difference (IV, Fixed, 95% CI) | ‐20.75 [‐34.08, ‐7.42] |
| 12 Quality of life 1d: WHOQOL‐100 Environmental ‐ Endpoint: High score good Show forest plot | 1 | 41 | Mean Difference (IV, Fixed, 95% CI) | ‐18.09 [‐28.52, ‐7.66] |
| 13 Leaving the study early Show forest plot | 1 | 61 | Risk Ratio (M‐H, Fixed, 95% CI) | 0.94 [0.47, 1.88] |