Tratamiento comunitario obligatorio y tratamiento ambulatorio no voluntario para pacientes con trastornos mentales graves
Información
- DOI:
- https://doi.org/10.1002/14651858.CD004408.pub5Copiar DOI

- Base de datos:
-
- Cochrane Database of Systematic Reviews
- Versión publicada:
-
- 17 marzo 2017see what's new
- Tipo:
-
- Intervention
- Etapa:
-
- Review
- Grupo Editorial Cochrane:
-
Grupo Cochrane de Esquizofrenia
- Copyright:
-
- Copyright © 2017 The Cochrane Collaboration. Published by John Wiley & Sons, Ltd.
Cifras del artículo
Altmetric:
Citado por:
Autores
Contributions of authors
1. 2016 search
SK independently inspected citations from the new electronic search and identified relevant abstracts. SK also inspected full articles of the abstracts meeting inclusion criteria. SK updated results and discussion in light of new search.
LAC provided comments on the search strategy and the updated review.
ROR is a new review author who provided comments on the search strategy and the updated review.
2. 2012 and 2013 searches
SK independently inspected citations from the new electronic search and identified relevant abstracts. SK also inspected full articles of the abstracts meeting inclusion criteria. SK carried out the reliability check of all citations from the new electronic search, updated results and discussion in light of new search.
LAC provided comments on the search strategy and the updated review.
3. Original review
SK formulated the review question, initially developed the search strategy, selected trials, conducted the analysis and wrote the first draft of the review. SK also wrote the first draft of the updated review.
LAC selected trials, reviewed and provided comments on the search strategy and review, and assisted the analysis.
Sources of support
Internal sources
-
Health Outcomes Unit, Capital District Health Authority, Halifax, Canada.
-
Dalhousie University, Halifax, Canada.
-
Fremantle Hospital, Australia.
-
University of Western Australia, Australia.
-
University of Queensland, Australia.
-
Faculty of Medicine, Western University, London, Ontario, Canada.
External sources
-
No sources of support supplied
Declarations of interest
SK: none known.
LAC: this review was supported by a Nova Scotia Health Research Foundation Knowledge Programs Grant.
ROR: none known.
Acknowledgements
SK is employed by the University of Queensland, Australia and previously by Dalhousie University, Canada and the University of Western Australia.
LAC is employed by Capital District Health Authority, Halifax, Canada.
RO'R is employed by the Faculty of Medicine, Western University, London, Ontario, Canada.
We also wish to thank Neil Preston from Fremantle Hospital, Western Australia who was an author on earlier versions of this review. The principal investigators of two groups who conducted RCTs in this area kindly confirmed that we had all the relevant papers and supplied additional data.
The Cochrane Schizophrenia Group provides a standard template for its Methods, which we have used and adapted for this update.
Version history
| Published | Title | Stage | Authors | Version |
| 2017 Mar 17 | Compulsory community and involuntary outpatient treatment for people with severe mental disorders | Review | Steve R Kisely, Leslie A Campbell, Richard O'Reilly | |
| 2014 Dec 04 | Compulsory community and involuntary outpatient treatment for people with severe mental disorders | Review | Steve R Kisely, Leslie A Campbell | |
| 2011 Feb 16 | Compulsory community and involuntary outpatient treatment for people with severe mental disorders | Review | Steve R Kisely, Leslie Anne Campbell, Neil J Preston | |
| 2005 Jul 20 | Compulsory community and involuntary outpatient treatment for people with severe mental disorders | Review | Steve R Kisely, Leslie Anne Campbell, Neil J Preston | |
| 2003 Oct 20 | Compulsory community treatment and involuntary outpatient treatment for people with severe mental disorders | Protocol | Steve R Kisely, Neil J Preston | |
Differences between protocol and review
1. Overall loss of credibility
We now think that the 35% cut‐off was inadvisable and prefer 50%. However, this decision was taken only after seeing the data and leaves all subsequent analyses very prone to the inclusion of bias (see Potential biases in the review process). We also added a comparison of CCT with supervised discharge.
2. Funnel plot
In our protocol (Kisely 2004), we stated that data from all included studies would be entered into a funnel graph (trial effect against trial size) in an attempt to investigate the likelihood of overt publication bias (Egger 1997). Because there were never more than three studies for each outcome, we were unable to use this technique to investigate publication bias.
3. Updating of Methods and inclusion of 'Summary of findings' and 'Risk of bias' tables
In our protocol, we stated that we would only compare CCT with standard voluntary care. However, the scarcity of randomised trials in the assessment of CCT meant that we subsequently extended inclusion criteria to studies that compared different types of compulsory treatment in the community.
In addition, we added 'Risk of bias' and a 'Summary of findings' tables, and updated some of the methods and layout of text to reflect the updated structure of Cochrane Reviews.
4. Outcomes: global state added
The new trial provided useable data from a global state scale.
5. Reordering and rewording of health service contact and utilisation
We have reworded two outcomes to clarify meaning, and reordered them in the outcome list. We have not changed the type of outcome measured.
1. Compliance with treatment to Compliance with medication
2. Readmissions to Number with multiple readmissions
6. Reordering of outcomes in SOF list changed to match order of outcomes in Secondary Outcomes
Keywords
MeSH
Medical Subject Headings (MeSH) Keywords
- Ambulatory Care [standards, statistics & numerical data];
- Commitment of Mentally Ill [*legislation & jurisprudence];
- Community Mental Health Services [*legislation & jurisprudence];
- Crime Victims;
- Length of Stay [statistics & numerical data];
- Medication Adherence [statistics & numerical data];
- Mental Disorders [*therapy];
- Patient Readmission [legislation & jurisprudence, statistics & numerical data];
- Patient Satisfaction;
- Quality of Life;
- Randomized Controlled Trials as Topic;
- Social Skills;
- Treatment Outcome;
Medical Subject Headings Check Words
Humans;
PICO

Study flow diagram.

'Risk of bias' graph: review authors' judgements about each risk of bias item presented as percentages across all included studies.
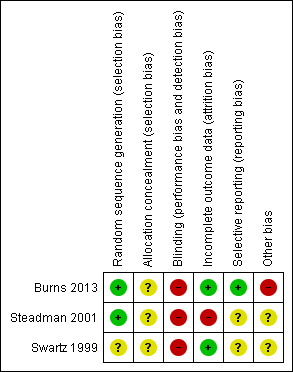
'Risk of bias' summary: review authors' judgements about each risk of bias item for each included study.
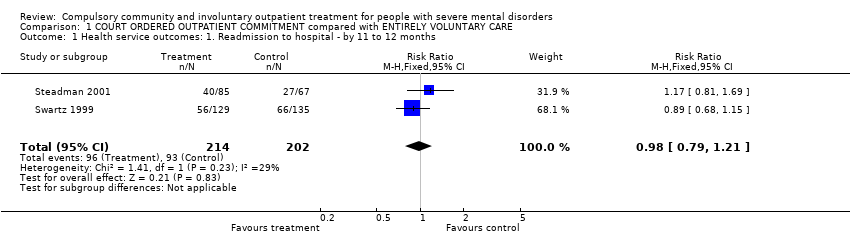
Comparison 1 COURT ORDERED OUTPATIENT COMMITMENT compared with ENTIRELY VOLUNTARY CARE, Outcome 1 Health service outcomes: 1. Readmission to hospital ‐ by 11 to 12 months.

Comparison 1 COURT ORDERED OUTPATIENT COMMITMENT compared with ENTIRELY VOLUNTARY CARE, Outcome 2 Health service outcomes: 2. Hospital bed‐days.
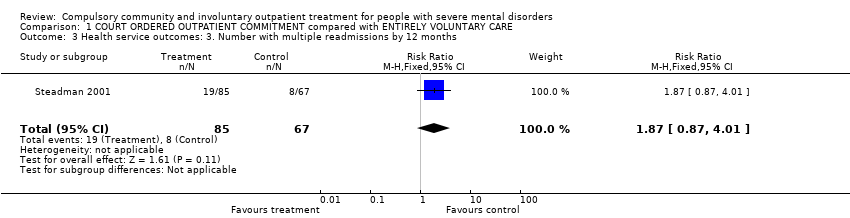
Comparison 1 COURT ORDERED OUTPATIENT COMMITMENT compared with ENTIRELY VOLUNTARY CARE, Outcome 3 Health service outcomes: 3. Number with multiple readmissions by 12 months.

Comparison 1 COURT ORDERED OUTPATIENT COMMITMENT compared with ENTIRELY VOLUNTARY CARE, Outcome 4 Health service outcomes: 4. Compliance with medication by 11 to 12 months.

Comparison 1 COURT ORDERED OUTPATIENT COMMITMENT compared with ENTIRELY VOLUNTARY CARE, Outcome 5 Participant level outcomes: 1. Mental state ‐ psychiatric symptoms and global state at 11 to 12 months.

Comparison 1 COURT ORDERED OUTPATIENT COMMITMENT compared with ENTIRELY VOLUNTARY CARE, Outcome 6 Participant level outcomes: 2. Social functioning: trouble with police by 11 to 12 months.

Comparison 1 COURT ORDERED OUTPATIENT COMMITMENT compared with ENTIRELY VOLUNTARY CARE, Outcome 7 Participant level outcomes: 3. Social functioning: homeless by 11 to 12 months.

Comparison 1 COURT ORDERED OUTPATIENT COMMITMENT compared with ENTIRELY VOLUNTARY CARE, Outcome 8 Participant level outcomes: 4. Quality of life: Lehman Quality of Life Scale.

Comparison 1 COURT ORDERED OUTPATIENT COMMITMENT compared with ENTIRELY VOLUNTARY CARE, Outcome 9 Participant level outcomes: 5. Quality of life: victimisation by 11 to 12 months.

Comparison 1 COURT ORDERED OUTPATIENT COMMITMENT compared with ENTIRELY VOLUNTARY CARE, Outcome 10 Participant level outcomes: 6. Satisfaction with care: perceived coercion by 11 to 12 months.

Comparison 2 COMMUNITY TREATMENT ORDERS compared with SUPERVISED DISCHARGE (SECTION 17), Outcome 1 Health service outcomes: 1a. Readmission to hospital ‐ by 12 months.
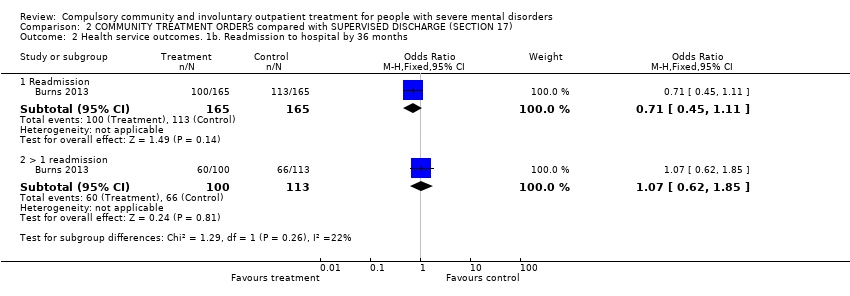
Comparison 2 COMMUNITY TREATMENT ORDERS compared with SUPERVISED DISCHARGE (SECTION 17), Outcome 2 Health service outcomes. 1b. Readmission to hospital by 36 months.

Comparison 2 COMMUNITY TREATMENT ORDERS compared with SUPERVISED DISCHARGE (SECTION 17), Outcome 3 Health service outcomes: 2. Hospital bed‐days by 12 months.

Comparison 2 COMMUNITY TREATMENT ORDERS compared with SUPERVISED DISCHARGE (SECTION 17), Outcome 4 Health service outcomes: 3. Number of readmissions by 12 months.

Comparison 2 COMMUNITY TREATMENT ORDERS compared with SUPERVISED DISCHARGE (SECTION 17), Outcome 5 Health service outcomes: 4. Number with multiple readmissions by 12 months.
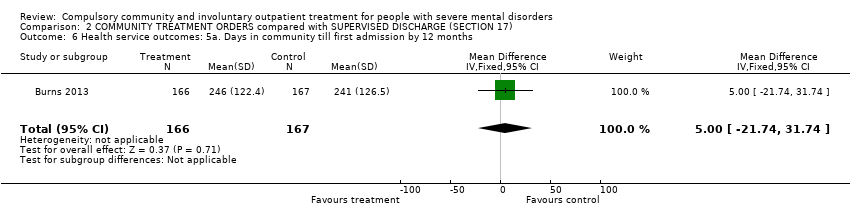
Comparison 2 COMMUNITY TREATMENT ORDERS compared with SUPERVISED DISCHARGE (SECTION 17), Outcome 6 Health service outcomes: 5a. Days in community till first admission by 12 months.

Comparison 2 COMMUNITY TREATMENT ORDERS compared with SUPERVISED DISCHARGE (SECTION 17), Outcome 7 Health service outcomes: 5b. Days in community till first admission and mean duration of bed‐days by 36 months.
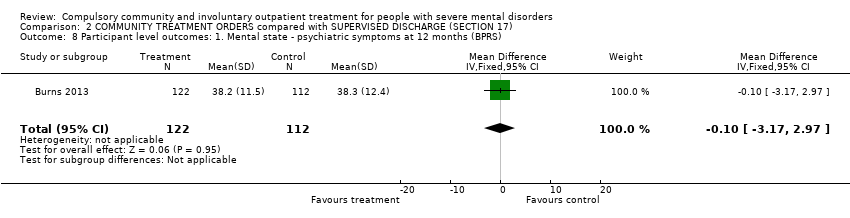
Comparison 2 COMMUNITY TREATMENT ORDERS compared with SUPERVISED DISCHARGE (SECTION 17), Outcome 8 Participant level outcomes: 1. Mental state ‐ psychiatric symptoms at 12 months (BPRS).
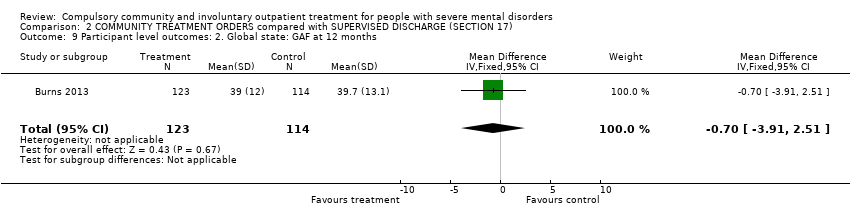
Comparison 2 COMMUNITY TREATMENT ORDERS compared with SUPERVISED DISCHARGE (SECTION 17), Outcome 9 Participant level outcomes: 2. Global state: GAF at 12 months.

Comparison 2 COMMUNITY TREATMENT ORDERS compared with SUPERVISED DISCHARGE (SECTION 17), Outcome 10 Participant level outcomes: 3. Satisfaction with care: perceived coercion at 11 to 12 months.
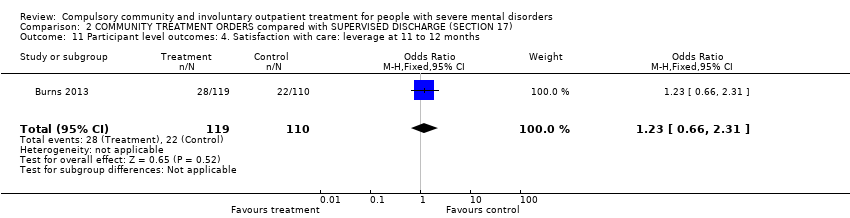
Comparison 2 COMMUNITY TREATMENT ORDERS compared with SUPERVISED DISCHARGE (SECTION 17), Outcome 11 Participant level outcomes: 4. Satisfaction with care: leverage at 11 to 12 months.

Comparison 2 COMMUNITY TREATMENT ORDERS compared with SUPERVISED DISCHARGE (SECTION 17), Outcome 12 Participant level outcomes: 5. Social Outcomes Index at 12 months.
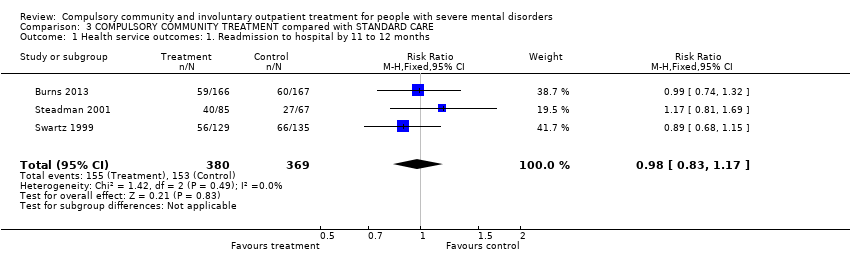
Comparison 3 COMPULSORY COMMUNITY TREATMENT compared with STANDARD CARE, Outcome 1 Health service outcomes: 1. Readmission to hospital by 11 to 12 months.
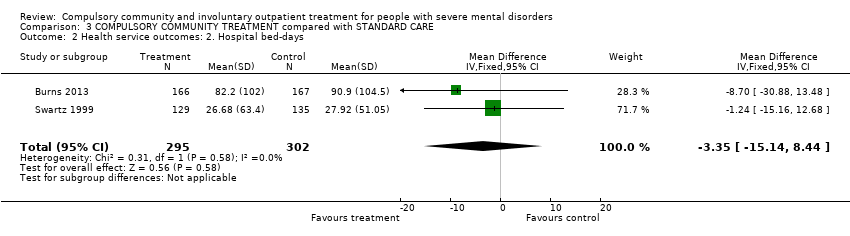
Comparison 3 COMPULSORY COMMUNITY TREATMENT compared with STANDARD CARE, Outcome 2 Health service outcomes: 2. Hospital bed‐days.

Comparison 3 COMPULSORY COMMUNITY TREATMENT compared with STANDARD CARE, Outcome 3 Health service outcomes: 3. Number with multiple readmissions by 12 months.
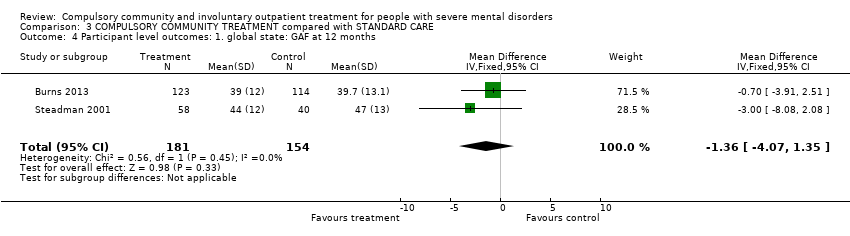
Comparison 3 COMPULSORY COMMUNITY TREATMENT compared with STANDARD CARE, Outcome 4 Participant level outcomes: 1. global state: GAF at 12 months.
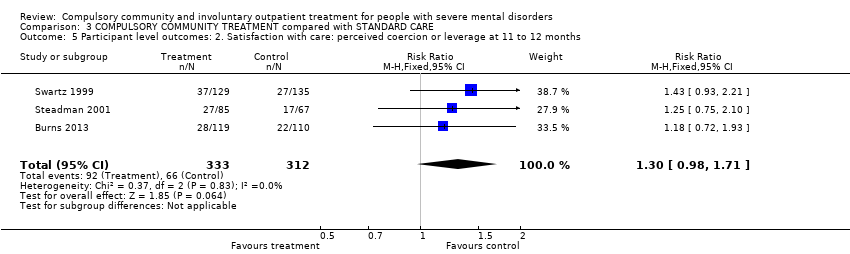
Comparison 3 COMPULSORY COMMUNITY TREATMENT compared with STANDARD CARE, Outcome 5 Participant level outcomes: 2. Satisfaction with care: perceived coercion or leverage at 11 to 12 months.
| COMPULSORY COMMUNITY AND INVOLUNTARY OUTPATIENT TREATMENT FOR PEOPLE WITH SEVERE MENTAL DISORDERS | ||||||
| Patient or population: people with severe mental disorders Settings: patients in community settings Intervention: COURT ORDERED OUTPATIENT COMMITMENT Comparison: ENTIRELY VOLUNTARY CARE | ||||||
| Outcomes | Illustrative comparative risks* (95% CI) | Relative effect | No of participants | Quality of the evidence | Comments | |
| Assumed risk | Corresponding risk | |||||
| VOLUNTARY CARE | COURT ORDERED OUTPATIENT COMMITMENT | |||||
| Health service outcomes: 1. Readmission to hospital by 11 to 12 months | Study population | RR 0.98 | 416 | ⊕⊕⊝⊝ | ‐ | |
| 460 per 1000 | 451 per 1000 | |||||
| Medium risk population | ||||||
| 446 per 1000 | 437 per 1000 | |||||
| Health service outcomes: 4. Compliance with medication by 11 to 12 months | Study population | RR 0.99 | 416 | ⊕⊕⊝⊝ | ‐ | |
| 505 per 1000 | 500 per 1000 | |||||
| Medium risk population | ||||||
| 554 per 1000 | 548 per 1000 | |||||
| Participant level outcomes: 2. Social functioning: trouble with police by 11 to 12 months, at least 1 arrest | Study population | RR 0.97 | 416 | ⊕⊕⊝⊝ | ‐ | |
| 158 per 1000 | 153 per 1000 | |||||
| Medium risk population | ||||||
| 156 per 1000 | 151 per 1000 | |||||
| Participant level outcomes: 2. Social functioning: trouble with police by 11 to 12 months, ever arrested/picked up by police for violence against a person | Study population | RR 0.82 | 416 | ⊕⊕⊝⊝ | ‐ | |
| 208 per 1000 | 171 per 1000 | |||||
| Medium risk population | ||||||
| 156 per 1000 | 128 per 1000 | |||||
| Participant level outcomes: 3. Social functioning: homeless by 11 to 12 months | Study population | RR 0.67 | 416 | ⊕⊕⊝⊝ | ‐ | |
| 134 per 1000 | 90 per 1000 | |||||
| Medium risk population | ||||||
| 145 per 1000 | 97 per 1000 | |||||
| Participant level outcomes: 5. Quality of life: victimisation by 11 to 12 months | Study population | RR 0.5 | 264 | ⊕⊕⊝⊝ | ‐ | |
| 311 per 1000 | 156 per 1000 | |||||
| Medium risk population | ||||||
| 311 per 1000 | 156 per 1000 | |||||
| Participant level outcomes: 6. Satisfaction with care/adverse events: perceived coercion by 11 to 12 months | Study population | RR 1.36 | 416 | ⊕⊕⊝⊝ | ‐ | |
| 218 per 1000 | 296 per 1000 | |||||
| Medium risk population | ||||||
| 227 per 1000 | 309 per 1000 | |||||
| *The basis for the assumed risk (e.g. the median control group risk across studies) is provided in footnotes. The corresponding risk (and its 95% confidence interval) is based on the assumed risk in the comparison group and the relative effect of the intervention (and its 95% CI). | ||||||
| GRADE Working Group grades of evidence | ||||||
| 1 Allocation concealment and blinding unclear: serious risk of bias, downgraded by one level. 2 Only 2 studies, both from the USA: serious imprecision, downgraded by one level. 3 Only 1 study: serious imprecision, downgraded by one level. | ||||||
| COMPULSORY COMMUNITY AND INVOLUNTARY OUTPATIENT TREATMENT FOR PEOPLE WITH SEVERE MENTAL DISORDERS | ||||||
| Patient or population: people with severe mental disorders Settings: community Intervention: COMMUNITY TREATMENT ORDERS Comparison: SUPERVISED DISCHARGE (Section 17) | ||||||
| Outcomes | Illustrative comparative risks* (95% CI) | Relative effect | No of participants | Quality of the evidence | Comments | |
| Assumed risk | Corresponding risk | |||||
| SECTION 17 | COMMUNITY TREATMENT ORDERS | |||||
| Health service outcomes: 1. Readmission to hospital by 12 months | Study population | RR 0.99 | 333 | ⊕⊕⊕⊝ | ‐ | |
| 359 per 1000 | 356 per 1000 | |||||
| Moderate risk population | ||||||
| 359 per 1000 | 355 per 1000 | |||||
| Health service outcomes: 2. Hospital bed‐days by 12 months | ‐ | The mean health service outcomes: 2. total duration of psychiatric hospital stays over 12 months in the intervention groups was | ‐ | 333 | ⊕⊕⊕⊝ | ‐ |
| Health service outcomes: 3. Number of readmissions by 12 months | ‐ | The mean health service outcomes: 3. number of readmissions by 12 months in the intervention groups was | ‐ | 119 | ⊕⊕⊕⊝ | ‐ |
| Health service outcomes: 4. Number with multiple readmissions by 12 months | Study population | RR 0.56 | 333 | ⊕⊕⊕⊝ | ‐ | |
| 108 per 1000 | 60 per 1000 | |||||
| Moderate risk population | ||||||
| 108 per 1000 | 60 per 1000 | |||||
| Health service outcomes: 5. Days in community to first admission by 12 months | ‐ | The mean days in community to 1st admission in the intervention groups was | ‐ | 333 | ⊕⊕⊕⊝ | ‐ |
| Participant level outcomes: 1. Mental state ‐ psychiatric symptoms at 12 months (BPRS) | ‐ | The mean patierticipant level outcomes: BPRS in the intervention groups was | ‐ | 234 | ⊕⊕⊕⊝ | |
| Participant level outcomes: 3. Satisfaction with care: perceived coercion at 11 ‐ 12 months | ‐ | The mean participant level outcomes: Satisfaction with care: perceived coercion intervention groups was | ‐ | 182 | ⊕⊕⊕⊝ | |
| Other pre‐stated participant level outcomes of interest: Social functioning: trouble with police, homeless; Quality of life: victimisation; not reported | ||||||
| *The basis for the assumed risk (e.g. the median control group risk across studies) is provided in footnotes. The corresponding risk (and its 95% confidence interval) is based on the assumed risk in the comparison group and the relative effect of the intervention (and its 95% CI). | ||||||
| GRADE Working Group grades of evidence | ||||||
| 1 Forty people (25%) allocated to Section 17 were subsequently placed on a CTO during the study. 2 35 people randomised to CTOs (22%) did not actually receive the intervention. 3 No adverse events reported. | ||||||
| COMPULSORY COMMUNITY AND INVOLUNTARY OUTPATIENT TREATMENT FOR PEOPLE WITH SEVERE MENTAL DISORDERS | ||||||
| Patient or population: people with severe mental disorders Settings: community Intervention: COMPULSORY COMMUNITY TREATMENT Comparison: STANDARD CARE | ||||||
| Outcomes | Illustrative comparative risks* (95% CI) | Relative effect | No of participants | Quality of the evidence | Comments | |
| Assumed risk | Corresponding risk | |||||
| STANDARD CARE | COMPULSORY COMMUNITY TREATMENT | |||||
| Health service outcomes: 1. Readmission to hospital by 11 to 12 months | Study population | RR 0.98 | 749 | ⊕⊕⊕⊝ | ‐ | |
| 415 per 1000 | 406 per 1000 | |||||
| Moderate | ||||||
| 403 per 1000 | 395 per 1000 | |||||
| Health service outcomes: 2. Hospital bed‐days | ‐ | The mean health service outcomes: 2. hospital bed‐days in the intervention groups was | ‐ | 597 | ⊕⊕⊕⊝ | ‐ |
| Health service outcomes: 3. Number with multiple readmissions by 12 months | Study population | RR 1.0 | 485 | ⊕⊕⊕⊝ | ‐ | |
| 111 per 1000 | 111 per 1000 | |||||
| Moderate | ||||||
| 114 per 1000 | 114 per 1000 | |||||
| Participant level outcomes: 1. Global state: GAF at 12 months | ‐ | The mean participant level outcomes: global state: GAF at 12 months in the intervention groups was | ‐ | 335 | ⊕⊕⊕⊝ | |
| Participant level outcomes: 2. Satisfaction with care: perceived coercion or leverage at 11 to 12 months | Study population | RR 1.3 | 645 | ⊕⊕⊕⊝ | ‐ | |
| 212 per 1000 | 275 per 1000 | |||||
| Moderate | ||||||
| 200 per 1000 | 260 per 1000 | |||||
| Other pre‐stated participant level outcomes of interest: Social functioning: trouble with police, homeless; Quality of life: victimisation; not reported | ||||||
| *The basis for the assumed risk (e.g. the median control group risk across studies) is provided in footnotes. The corresponding risk (and its 95% confidence interval) is based on the assumed risk in the comparison group and the relative effect of the intervention (and its 95% CI). | ||||||
| GRADE Working Group grades of evidence | ||||||
| 1 Forty people (25%) allocated to Section 17 were subsequently placed on a CTO during the study. 2 35 people randomised to compulsory community treatments (22%) did not actually receive the intervention. 3 No adverse events reported. | ||||||
| Outcome or subgroup title | No. of studies | No. of participants | Statistical method | Effect size |
| 1 Health service outcomes: 1. Readmission to hospital ‐ by 11 to 12 months Show forest plot | 2 | 416 | Risk Ratio (M‐H, Fixed, 95% CI) | 0.98 [0.79, 1.21] |
| 2 Health service outcomes: 2. Hospital bed‐days Show forest plot | 1 | 264 | Mean Difference (IV, Fixed, 95% CI) | ‐1.24 [‐15.16, 12.68] |
| 3 Health service outcomes: 3. Number with multiple readmissions by 12 months Show forest plot | 1 | 152 | Risk Ratio (M‐H, Fixed, 95% CI) | 1.87 [0.87, 4.01] |
| 4 Health service outcomes: 4. Compliance with medication by 11 to 12 months Show forest plot | 2 | 416 | Risk Ratio (M‐H, Fixed, 95% CI) | 0.99 [0.83, 1.19] |
| 5 Participant level outcomes: 1. Mental state ‐ psychiatric symptoms and global state at 11 to 12 months Show forest plot | 1 | 98 | Mean Difference (IV, Fixed, 95% CI) | ‐3.0 [‐8.08, 2.08] |
| 6 Participant level outcomes: 2. Social functioning: trouble with police by 11 to 12 months Show forest plot | 2 | Risk Ratio (M‐H, Fixed, 95% CI) | Subtotals only | |
| 6.1 at least 1 arrest | 2 | 416 | Risk Ratio (M‐H, Fixed, 95% CI) | 0.97 [0.62, 1.52] |
| 6.2 ever arrested/picked up by police for violence against a person | 2 | 416 | Risk Ratio (M‐H, Fixed, 95% CI) | 0.82 [0.56, 1.21] |
| 7 Participant level outcomes: 3. Social functioning: homeless by 11 to 12 months Show forest plot | 2 | 416 | Risk Ratio (M‐H, Fixed, 95% CI) | 0.67 [0.39, 1.15] |
| 8 Participant level outcomes: 4. Quality of life: Lehman Quality of Life Scale Show forest plot | 2 | 406 | Mean Difference (IV, Random, 95% CI) | ‐0.22 [‐0.95, 0.50] |
| 9 Participant level outcomes: 5. Quality of life: victimisation by 11 to 12 months Show forest plot | 1 | 264 | Risk Ratio (M‐H, Fixed, 95% CI) | 0.50 [0.31, 0.80] |
| 10 Participant level outcomes: 6. Satisfaction with care: perceived coercion by 11 to 12 months Show forest plot | 2 | 416 | Risk Ratio (M‐H, Fixed, 95% CI) | 1.36 [0.97, 1.89] |
| Outcome or subgroup title | No. of studies | No. of participants | Statistical method | Effect size |
| 1 Health service outcomes: 1a. Readmission to hospital ‐ by 12 months Show forest plot | 1 | 333 | Risk Ratio (M‐H, Fixed, 95% CI) | 0.99 [0.74, 1.32] |
| 2 Health service outcomes. 1b. Readmission to hospital by 36 months Show forest plot | 1 | Odds Ratio (M‐H, Fixed, 95% CI) | Subtotals only | |
| 2.1 Readmission | 1 | 330 | Odds Ratio (M‐H, Fixed, 95% CI) | 0.71 [0.45, 1.11] |
| 2.2 > 1 readmission | 1 | 213 | Odds Ratio (M‐H, Fixed, 95% CI) | 1.07 [0.62, 1.85] |
| 3 Health service outcomes: 2. Hospital bed‐days by 12 months Show forest plot | 1 | 333 | Mean Difference (IV, Fixed, 95% CI) | ‐8.70 [‐30.88, 13.48] |
| 4 Health service outcomes: 3. Number of readmissions by 12 months Show forest plot | 1 | 119 | Mean Difference (IV, Fixed, 95% CI) | ‐0.20 [‐0.45, 0.05] |
| 5 Health service outcomes: 4. Number with multiple readmissions by 12 months Show forest plot | 1 | 333 | Risk Ratio (M‐H, Fixed, 95% CI) | 0.56 [0.27, 1.17] |
| 6 Health service outcomes: 5a. Days in community till first admission by 12 months Show forest plot | 1 | 333 | Mean Difference (IV, Fixed, 95% CI) | 5.0 [‐21.74, 31.74] |
| 7 Health service outcomes: 5b. Days in community till first admission and mean duration of bed‐days by 36 months Show forest plot | 1 | Mean Difference (IV, Fixed, 95% CI) | Subtotals only | |
| 7.1 Time to 1st readmission in days | 1 | 330 | Mean Difference (IV, Fixed, 95% CI) | 60.0 [‐27.62, 147.62] |
| 7.2 Mean duration of bed‐days | 1 | 212 | Mean Difference (IV, Fixed, 95% CI) | ‐15.10 [‐89.39, 59.19] |
| 8 Participant level outcomes: 1. Mental state ‐ psychiatric symptoms at 12 months (BPRS) Show forest plot | 1 | 234 | Mean Difference (IV, Fixed, 95% CI) | ‐0.10 [‐3.17, 2.97] |
| 9 Participant level outcomes: 2. Global state: GAF at 12 months Show forest plot | 1 | 237 | Mean Difference (IV, Fixed, 95% CI) | ‐0.70 [‐3.91, 2.51] |
| 10 Participant level outcomes: 3. Satisfaction with care: perceived coercion at 11 to 12 months Show forest plot | 1 | 182 | Mean Difference (IV, Fixed, 95% CI) | ‐0.5 [‐1.71, 0.71] |
| 11 Participant level outcomes: 4. Satisfaction with care: leverage at 11 to 12 months Show forest plot | 1 | 229 | Odds Ratio (M‐H, Fixed, 95% CI) | 1.23 [0.66, 2.31] |
| 12 Participant level outcomes: 5. Social Outcomes Index at 12 months Show forest plot | 1 | 236 | Mean Difference (IV, Fixed, 95% CI) | ‐0.10 [‐0.40, 0.20] |
| Outcome or subgroup title | No. of studies | No. of participants | Statistical method | Effect size |
| 1 Health service outcomes: 1. Readmission to hospital by 11 to 12 months Show forest plot | 3 | 749 | Risk Ratio (M‐H, Fixed, 95% CI) | 0.98 [0.83, 1.17] |
| 2 Health service outcomes: 2. Hospital bed‐days Show forest plot | 2 | 597 | Mean Difference (IV, Fixed, 95% CI) | ‐3.35 [‐15.14, 8.44] |
| 3 Health service outcomes: 3. Number with multiple readmissions by 12 months Show forest plot | 2 | 485 | Risk Ratio (M‐H, Random, 95% CI) | 1.02 [0.31, 3.33] |
| 4 Participant level outcomes: 1. global state: GAF at 12 months Show forest plot | 2 | 335 | Mean Difference (IV, Fixed, 95% CI) | ‐1.36 [‐4.07, 1.35] |
| 5 Participant level outcomes: 2. Satisfaction with care: perceived coercion or leverage at 11 to 12 months Show forest plot | 3 | 645 | Risk Ratio (M‐H, Fixed, 95% CI) | 1.30 [0.98, 1.71] |