Tratamiento comunitario obligatorio y tratamiento ambulatorio no voluntario para pacientes con trastornos mentales graves
Resumen
Antecedentes
Existe controversia acerca de si el tratamiento comunitario obligatorio (TCO) para los pacientes con enfermedades mentales graves (EMG) reduce el uso de los servicios sanitarios, o mejora el resultado clínico y el funcionamiento social.
Objetivos
Examinar la efectividad del tratamiento comunitario obligatorio (TCO) para los pacientes con enfermedades mentales graves (EMG).
Métodos de búsqueda
Se realizaron búsquedas en el registro de ensayos basado en estudios del Grupo Cochrane de Esquizofrenia (Cochrane Schizophrenia Group's Study‐Based Register of Trials) (2003, 2008, 2012, 8 noviembre 2013, 3 junio 2016). Se obtuvieron todas las referencias de los estudios identificados y se estableció contacto con los autores cuando fue necesario.
Criterios de selección
Todos los ensayos clínicos controlados aleatorizados (ECA) relevantes de TCO comparados con la atención estándar para los pacientes con EMG (principalmente esquizofrenia y trastornos similares a la esquizofrenia, trastorno bipolar o depresión con características psicóticas). La atención estándar podría ser el tratamiento voluntario en la comunidad u otra forma preexistente de TCO, como el alta supervisada.
Obtención y análisis de los datos
Dos autores de la revisión, de forma independiente, seleccionaron los estudios, evaluaron su calidad y extrajeron los datos. Se utilizó la herramienta de Cochrane para evaluar el riesgo de sesgo. Para los resultados binarios, se calculó un riesgo relativo (RR) de efectos fijos, su intervalo de confianza del 95% (IC del 95%) y, cuando fue posible, el número necesario a tratar para un resultado beneficioso adicional (NNTB). Para los resultados continuos, se calculó una diferencia de medias de efectos fijos (DM) y su IC del 95%. Se utilizó el enfoque GRADE para crear tablas de «Resumen de los hallazgos» para los resultados clave y se evaluó el riesgo de sesgo de estos hallazgos.
Resultados principales
Esta revisión incluyó tres estudios (n = 749). Dos se basaron en los Estados Unidos y uno en Inglaterra. El estudio inglés tuvo el menor sesgo, cumpliendo tres de los siete criterios de la herramienta de Cochrane para evaluar el riesgo de sesgo. Los otros dos estudios cumplieron sólo un criterio, la mayoría de los cuales se calificó como incierto.
Dos ensayos de los EE.UU. (n = 416) compararon el "compromiso ambulatorio ordenado" (CAO) por el tribunal con el tratamiento comunitario totalmente voluntario. No hubo diferencias significativas entre el CAO y el tratamiento voluntario a los 11‐12 meses en ninguno de los principales índices de resultados de los servicios de salud o de los participantes: uso del servicio ‐ reingreso al hospital (dos ECA, n = 416; RR 0,98; IC del 95%: 0,79 a 1,21; evidencia de baja calidad); uso del servicio ‐ cumplimiento con la medicación (dos ECA, n = 416; RR 0,99; IC del 95%: 0,83 a 1,19, evidencia de baja calidad); funcionamiento social ‐ detención al menos una vez (dos ECA, n = 416; RR 0,97; IC del 95%: 0,62 a 1,52; evidencia de baja calidad); funcionamiento social ‐ falta de hogar (dos ECA, n = 416; RR 0,67; IC del 95%: 0,39 a 1,15; evidencia de baja calidad); o satisfacción con la atención ‐ coerción percibida (dos ECA, n = 416; RR 1,36; RR 1,36; IC del 95%: 0,97 a 1,89; evidencia de baja calidad). Sin embargo, un ensayo encontró que el riesgo de victimización disminuyó con el CAO (un ECA, n = 264; RR 0,50; IC del 95%: 0,31 a 0,80; evidencia de baja calidad).
El otro ECA comparó las órdenes de tratamiento comunitario (OTC) con el alta supervisada menos intensiva y más breve (sección 17) en Inglaterra. El estudio no encontró diferencias entre los dos grupos para los resultados principales de los servicios de salud, incluido el reingreso al hospital a los 12 meses (un ECA, n = 333; RR 0,99; IC del 95%: 0,74 a 1,32; evidencia de calidad moderada), ni para ninguno de los resultados a nivel de los participantes. La ausencia de diferencias entre los dos grupos persistió a los 36 meses de seguimiento.
La combinación de los resultados de los tres ensayos no alteró estos resultados. Por ejemplo, los participantes en cualquier forma de TCO no tuvieron menos probabilidades de ser readmitidos que los participantes en los grupos control, ya sea en tratamiento totalmente voluntario o sujetos a alta supervisada intermitente (tres ECA, n = 749; RR de reingreso al hospital a los 12 meses 0,98; IC del 95%: 0,82 a 1,16 evidencia de calidad moderada). En términos de NNTB, se necesitarían 142 órdenes para evitar una readmisión. No hubo diferencias claras entre los grupos para la coerción percibida a los 12 meses (tres ECAs, n = 645; RR 1,30; IC del 95%: 0,98 a 1,71; evidencia de calidad moderada).
No hubo datos sobre los efectos adversos.
Conclusiones de los autores
Estos datos de la revisión muestran que los resultados de la TCO no muestran diferencias claras en el uso de los servicios, el funcionamiento social o la calidad de vida en comparación con la atención voluntaria o el alta supervisada breve. Sin embargo, los pacientes que recibían TCO tenían menos probabilidades de ser víctimas de delitos violentos o no violentos. No está claro si este beneficio se debe a la intensidad del tratamiento o a su carácter obligatorio. Los períodos cortos de licencia condicional pueden ser tan efectivos (o no) como el tratamiento formal obligatorio en la comunidad. La evaluación de una amplia gama de resultados debe ser considerada cuando se introduzca esta legislación. Sin embargo, las conclusiones se basan en tres ensayos relativamente pequeños, con riesgo alto o incierto de sesgo de cegamiento y evidencia de calidad baja a moderada. Además, es posible que los ensayos clínicos no reflejen plenamente los beneficios potenciales de esta intervención compleja.
PICOs
Resumen en términos sencillos
Tratamiento comunitario obligatorio y tratamiento ambulatorio no voluntario para pacientes con trastornos mentales graves
Antecedentes
Muchos países utilizan el tratamiento comunitario obligatorio (TCO) para los pacientes con problemas graves de salud mental, incluyendo Australia, Canadá, Israel, Nueva Zelanda, el Reino Unido y los Estados Unidos. Los partidarios de este enfoque sugieren que el TCO es necesario debido al cambio a la atención comunitaria de los pacientes con enfermedades mentales graves y que es menos restrictivo tratar obligatoriamente a alguien en la comunidad que someterlo a repetidas hospitalizaciones. También alegan que es efectivo para ofrecer estabilidad a la vida de los pacientes con enfermedades mentales graves. Los que se oponen al TCO temen que el tratamiento y el apoyo sean sustituidos por un mayor énfasis en el control, la contención y la amenaza. También existe el temor de que el TCO pueda socavar la relación entre los profesionales de la salud y los pacientes, provocando sentimientos de desconfianza y control, lo que podría alejar a los pacientes con enfermedades mentales graves de los servicios de atención.
Dado el uso generalizado de estos poderes, que obligan a los pacientes a someterse a un seguimiento con los servicios de salud mental y a tratamiento mientras viven en la comunidad, es importante evaluar los beneficios, la efectividad o los posibles riesgos del tratamiento obligatorio.
Búsquedas
Esta revisión se basa en búsquedas realizadas en 2012 y 2013, y actualizadas en 2016.
Características de los estudios
Esta revisión ahora incluye tres ensayos con 749 pacientes, con seguimiento en un estudio que se extiende a 36 meses. Dos de estos ensayos compararon formas de TCO versus atención estándar o atención voluntaria y el tercer ensayo comparó una forma de TCO llamada "orden de tratamiento comunitario" con el alta supervisada.
Resultados
Los resultados de los ensayos mostraron que el TCO general no tenía más probabilidades de resultar en un mejor uso de los servicios, funcionamiento social, estado mental o calidad de vida en comparación con la atención"voluntaria" estándar. Los pacientes en el ensayo que recibían TCO eran menos propensos a ser víctimas de delitos violentos o no violentos. Los períodos cortos de licencia condicional pueden ser tan efectivos (o no) como el tratamiento obligatorio en la comunidad.
Conclusiones
Hubo información muy limitada disponible, todos los resultados se basaron en tres ensayos relativamente pequeños de calidad baja a media, lo que dificulta el establecimiento de conclusiones firmes, por lo que es muy necesario realizar más investigaciones sobre los efectos de los diferentes tipos de TCO.
Authors' conclusions
Summary of findings
| COMPULSORY COMMUNITY AND INVOLUNTARY OUTPATIENT TREATMENT FOR PEOPLE WITH SEVERE MENTAL DISORDERS | ||||||
| Patient or population: people with severe mental disorders Settings: patients in community settings Intervention: COURT ORDERED OUTPATIENT COMMITMENT Comparison: ENTIRELY VOLUNTARY CARE | ||||||
| Outcomes | Illustrative comparative risks* (95% CI) | Relative effect | No of participants | Quality of the evidence | Comments | |
| Assumed risk | Corresponding risk | |||||
| VOLUNTARY CARE | COURT ORDERED OUTPATIENT COMMITMENT | |||||
| Health service outcomes: 1. Readmission to hospital by 11 to 12 months | Study population | RR 0.98 | 416 | ⊕⊕⊝⊝ | ‐ | |
| 460 per 1000 | 451 per 1000 | |||||
| Medium risk population | ||||||
| 446 per 1000 | 437 per 1000 | |||||
| Health service outcomes: 4. Compliance with medication by 11 to 12 months | Study population | RR 0.99 | 416 | ⊕⊕⊝⊝ | ‐ | |
| 505 per 1000 | 500 per 1000 | |||||
| Medium risk population | ||||||
| 554 per 1000 | 548 per 1000 | |||||
| Participant level outcomes: 2. Social functioning: trouble with police by 11 to 12 months, at least 1 arrest | Study population | RR 0.97 | 416 | ⊕⊕⊝⊝ | ‐ | |
| 158 per 1000 | 153 per 1000 | |||||
| Medium risk population | ||||||
| 156 per 1000 | 151 per 1000 | |||||
| Participant level outcomes: 2. Social functioning: trouble with police by 11 to 12 months, ever arrested/picked up by police for violence against a person | Study population | RR 0.82 | 416 | ⊕⊕⊝⊝ | ‐ | |
| 208 per 1000 | 171 per 1000 | |||||
| Medium risk population | ||||||
| 156 per 1000 | 128 per 1000 | |||||
| Participant level outcomes: 3. Social functioning: homeless by 11 to 12 months | Study population | RR 0.67 | 416 | ⊕⊕⊝⊝ | ‐ | |
| 134 per 1000 | 90 per 1000 | |||||
| Medium risk population | ||||||
| 145 per 1000 | 97 per 1000 | |||||
| Participant level outcomes: 5. Quality of life: victimisation by 11 to 12 months | Study population | RR 0.5 | 264 | ⊕⊕⊝⊝ | ‐ | |
| 311 per 1000 | 156 per 1000 | |||||
| Medium risk population | ||||||
| 311 per 1000 | 156 per 1000 | |||||
| Participant level outcomes: 6. Satisfaction with care/adverse events: perceived coercion by 11 to 12 months | Study population | RR 1.36 | 416 | ⊕⊕⊝⊝ | ‐ | |
| 218 per 1000 | 296 per 1000 | |||||
| Medium risk population | ||||||
| 227 per 1000 | 309 per 1000 | |||||
| *The basis for the assumed risk (e.g. the median control group risk across studies) is provided in footnotes. The corresponding risk (and its 95% confidence interval) is based on the assumed risk in the comparison group and the relative effect of the intervention (and its 95% CI). | ||||||
| GRADE Working Group grades of evidence | ||||||
| 1 Allocation concealment and blinding unclear: serious risk of bias, downgraded by one level. 2 Only 2 studies, both from the USA: serious imprecision, downgraded by one level. 3 Only 1 study: serious imprecision, downgraded by one level. | ||||||
| COMPULSORY COMMUNITY AND INVOLUNTARY OUTPATIENT TREATMENT FOR PEOPLE WITH SEVERE MENTAL DISORDERS | ||||||
| Patient or population: people with severe mental disorders Settings: community Intervention: COMMUNITY TREATMENT ORDERS Comparison: SUPERVISED DISCHARGE (Section 17) | ||||||
| Outcomes | Illustrative comparative risks* (95% CI) | Relative effect | No of participants | Quality of the evidence | Comments | |
| Assumed risk | Corresponding risk | |||||
| SECTION 17 | COMMUNITY TREATMENT ORDERS | |||||
| Health service outcomes: 1. Readmission to hospital by 12 months | Study population | RR 0.99 | 333 | ⊕⊕⊕⊝ | ‐ | |
| 359 per 1000 | 356 per 1000 | |||||
| Moderate risk population | ||||||
| 359 per 1000 | 355 per 1000 | |||||
| Health service outcomes: 2. Hospital bed‐days by 12 months | ‐ | The mean health service outcomes: 2. total duration of psychiatric hospital stays over 12 months in the intervention groups was | ‐ | 333 | ⊕⊕⊕⊝ | ‐ |
| Health service outcomes: 3. Number of readmissions by 12 months | ‐ | The mean health service outcomes: 3. number of readmissions by 12 months in the intervention groups was | ‐ | 119 | ⊕⊕⊕⊝ | ‐ |
| Health service outcomes: 4. Number with multiple readmissions by 12 months | Study population | RR 0.56 | 333 | ⊕⊕⊕⊝ | ‐ | |
| 108 per 1000 | 60 per 1000 | |||||
| Moderate risk population | ||||||
| 108 per 1000 | 60 per 1000 | |||||
| Health service outcomes: 5. Days in community to first admission by 12 months | ‐ | The mean days in community to 1st admission in the intervention groups was | ‐ | 333 | ⊕⊕⊕⊝ | ‐ |
| Participant level outcomes: 1. Mental state ‐ psychiatric symptoms at 12 months (BPRS) | ‐ | The mean patierticipant level outcomes: BPRS in the intervention groups was | ‐ | 234 | ⊕⊕⊕⊝ | |
| Participant level outcomes: 3. Satisfaction with care: perceived coercion at 11 ‐ 12 months | ‐ | The mean participant level outcomes: Satisfaction with care: perceived coercion intervention groups was | ‐ | 182 | ⊕⊕⊕⊝ | |
| Other pre‐stated participant level outcomes of interest: Social functioning: trouble with police, homeless; Quality of life: victimisation; not reported | ||||||
| *The basis for the assumed risk (e.g. the median control group risk across studies) is provided in footnotes. The corresponding risk (and its 95% confidence interval) is based on the assumed risk in the comparison group and the relative effect of the intervention (and its 95% CI). | ||||||
| GRADE Working Group grades of evidence | ||||||
| 1 Forty people (25%) allocated to Section 17 were subsequently placed on a CTO during the study. 2 35 people randomised to CTOs (22%) did not actually receive the intervention. 3 No adverse events reported. | ||||||
| COMPULSORY COMMUNITY AND INVOLUNTARY OUTPATIENT TREATMENT FOR PEOPLE WITH SEVERE MENTAL DISORDERS | ||||||
| Patient or population: people with severe mental disorders Settings: community Intervention: COMPULSORY COMMUNITY TREATMENT Comparison: STANDARD CARE | ||||||
| Outcomes | Illustrative comparative risks* (95% CI) | Relative effect | No of participants | Quality of the evidence | Comments | |
| Assumed risk | Corresponding risk | |||||
| STANDARD CARE | COMPULSORY COMMUNITY TREATMENT | |||||
| Health service outcomes: 1. Readmission to hospital by 11 to 12 months | Study population | RR 0.98 | 749 | ⊕⊕⊕⊝ | ‐ | |
| 415 per 1000 | 406 per 1000 | |||||
| Moderate | ||||||
| 403 per 1000 | 395 per 1000 | |||||
| Health service outcomes: 2. Hospital bed‐days | ‐ | The mean health service outcomes: 2. hospital bed‐days in the intervention groups was | ‐ | 597 | ⊕⊕⊕⊝ | ‐ |
| Health service outcomes: 3. Number with multiple readmissions by 12 months | Study population | RR 1.0 | 485 | ⊕⊕⊕⊝ | ‐ | |
| 111 per 1000 | 111 per 1000 | |||||
| Moderate | ||||||
| 114 per 1000 | 114 per 1000 | |||||
| Participant level outcomes: 1. Global state: GAF at 12 months | ‐ | The mean participant level outcomes: global state: GAF at 12 months in the intervention groups was | ‐ | 335 | ⊕⊕⊕⊝ | |
| Participant level outcomes: 2. Satisfaction with care: perceived coercion or leverage at 11 to 12 months | Study population | RR 1.3 | 645 | ⊕⊕⊕⊝ | ‐ | |
| 212 per 1000 | 275 per 1000 | |||||
| Moderate | ||||||
| 200 per 1000 | 260 per 1000 | |||||
| Other pre‐stated participant level outcomes of interest: Social functioning: trouble with police, homeless; Quality of life: victimisation; not reported | ||||||
| *The basis for the assumed risk (e.g. the median control group risk across studies) is provided in footnotes. The corresponding risk (and its 95% confidence interval) is based on the assumed risk in the comparison group and the relative effect of the intervention (and its 95% CI). | ||||||
| GRADE Working Group grades of evidence | ||||||
| 1 Forty people (25%) allocated to Section 17 were subsequently placed on a CTO during the study. 2 35 people randomised to compulsory community treatments (22%) did not actually receive the intervention. 3 No adverse events reported. | ||||||
Background
Description of the condition
Compulsory treatment for people with severe mental disorders in the community is used in many countries, including Australia, Canada, Israel, New Zealand, the UK, and the USA (Kanter 1995; Torrey 1995; Light 2012; Gray 2016). In the USA, the majority of states have some form of compulsory community treatment (CTT) (Torrey 1995), and there are similar provisions in Australia, Canada and New Zealand (Dedman 1990; Mulvany 1993; Torrey 1995; Gray 2016). Early initiatives in the UK included extended leave for people leaving hospital and a 'supervision register' (Sensky 1991; Holloway 1996), with the more recent implementation of legislation for CCT in Scotland, England and Wales (Lawton‐Smith 2008; Woolley 2010).
Supporters of this approach suggest that it is less restrictive to compulsorily treat someone in the community than to subject them to repeated hospital admissions (Pinfold 2001a). They also argue that it is effective in bringing stability to the lives of people with severe mental illness (SMI) (O'Reilly 2000). Opponents of CCT fear treatment and support will be replaced by a greater emphasis on control, restraint and threat (Pinfold 2001a). They argue that compulsion may be used as an alternative to intensive case management or assertive community treatment, which may be all that is needed (Swartz 1995). Opponents also argue that CCT may adversely affect the therapeutic alliance between healthcare professionals and patients and drive people with SMIs away from services (Pinfold 2001a), although the available evidence suggests that this does not happen (O'Reilly 2005; Kisely 2013a ).
Description of the intervention
Extended leave or supervised discharge is applied at the time of discharge from compulsory inpatient treatment. These forms of CCT are used in Canada (Gray 2016), the UK (Sensky 1991), and New Hampshire, USA (Torrey 1995). They give mental health professionals the right to return a person to hospital against their wishes if they do not comply with treatment.
Community treatment orders (CTOs) are used in Australia (Vaughan 2000; Light 2012), Canada (Gray 2016), and other international jurisdictions that give mental health professionals the ability to place a person on an order, whether they are in hospital or not (Gray 2010). This is in contrast to extended leave or supervised discharge, which only applies to people who are being discharged from inpatient care (Gray 2016). CTOs are designed to divert people from possibly having to be admitted as inpatients. In addition, unlike leave, the person may not have to meet the same criteria for treatment as an inpatient (Gray 2016). Involuntary outpatient treatment or commitment is the preferred term in the USA and covers court‐ordered community treatment. In this case, a judge, not a healthcare professional, decides on the appropriateness of the order.
The range of different interventions and ways of reporting frequency of use make it difficult to estimate how often CCT is used. The situation is complicated by the fact that in some jurisdictions, different forms of community treatment such as extended release and involuntary outpatient treatment exist in parallel. Use varies widely across jurisdictions with the highest rates being recorded in the Australian state of Victoria with a prevalence of 98.8 per 100,000 population. New Zealand also has a high rate of CTO at 84 per 100,000 (O'Brien 2014). By contrast, in the USA, involuntary outpatient treatment was only used in approximately three per 100,000 of the general population, 9.8% of new outpatient admissions and 7.1% of continuing outpatients (Ridgely 2001). However, even within the USA, the use of involuntary outpatient treatment varied. For instance, survey data from respondents in 13 states and the District of Columbia indicated they used it commonly or very commonly, while in a further 21 states, use was rare or very rare. Some of this variation may be explained by using alternative provisions such as extended release (Torrey 1995).
How the intervention might work
Many clinicians believe that CCT works by ensuring that people are adherent to their medication regimens for sufficient time to allow stability to develop in their lives (Manning 2011). It has also been suggested that CCT works by "persuading the persuadable" (Pinfold 2001b). A person may agree to follow‐up with clinicians and take the recommended treatment when these requirements have legal imprimatur. It has been suggested that such compliance is particularly likely when a person is brought to court and the order comes directly from a judge: the so‐called "black robe effect" (Tsai 2017). Other clinicians suggest that CCT commits the clinicians as much as it does patients (Manning 2011). They propose that much of the improvement on CCT is the result of increased expectations on clinicians to try to engage people and ensue that they follow the legal treatment order. Furthermore, clinical services may feel obliged to prioritise people on CCT because of the legal order. Clearly, CCT is a complex intervention. The form of CCT is determined by legal statutes that vary among jurisdictions on key issues such as the type of person deemed eligible and the options available to clinicians to ensure treatment adherence. CCT requires the cooperation of not only patients but of multiple other participants including: clinicians; substitute decision makers; community agencies; police and courts or review boards. The success or failure of CCT depends on the interaction of these participants each of whom must appropriately implement their part of the process.
Importantly, there are also variations between jurisdictions in how CCT is implemented. Involuntary outpatient treatment in many US states does not include the power to give medication forcibly in a community setting, but CTOs in Australasia do.
Why it is important to do this review
Mirror‐image studies use people as their own controls and consistently report reduced use of admission and other improved outcomes after placement on a CTO. Many of these have been large studies (Swartz 2010), and some have included all people on CTOs within a jurisdiction (Fernandez 1990a; Taylor 2016). Because mirror‐image studies do not use a control group, they do not take into account the possibility that participants were recruited when particularly disturbed and that subsequent reductions in hospital use may simply reflect regression to the mean. Studies that used matched controls have reported more mixed results (Maughan 2014). This may in part reflect the difficulty in retrospectively matching important characteristics, such as insight or refusal to accept treatment voluntarily, that often determine a clinician's decision to use a CTO. However, even when studies have used control groups, it is difficult to know whether to attribute any improvement to CCT, or to the non‐specific effects of increased contact with healthcare professionals (Swartz 1995; Torrey 1995; Geller 1998).
In summary, it remains unclear whether CCT can improve participant outcome or reduce health service use. Given the widespread use of such powers in Australasia, Israel, North America and the UK, it is important to assess the benefit and potential harms of this type of legislation.
Objectives
To examine the effectiveness of compulsory community treatment (CCT) for people with severe mental illness (SMI)
-
To compare compulsory community treatment of any form with standard voluntary care.
-
To compare different types of compulsory treatment (see Types of Compulsory community treatment 1.1 in Types of interventions).
Methods
Criteria for considering studies for this review
Types of studies
We considered all relevant randomised controlled trials (RCTs). We excluded quasi‐randomised studies, such as those allocating by using alternate days of the week.
Types of participants
We included trials of adults with SMIs (mainly schizophrenia and schizophrenia‐like disorders, bipolar disorder or depression with psychotic features), however diagnosed, who were managed in a community setting. Substance abuse was not considered to be a severe mental disorder in its own right. However, studies were eligible if they dealt with people with both diagnoses (i.e. people with SMI plus substance abuse).
Types of interventions
1. Comparison I: compulsory community treatment versus entirely voluntary care
1.1. Compulsory community treatment
For an intervention to be accepted as CCT, it had to be described in the trial using the following terms: CTO, involuntary outpatient treatment, involuntary outpatient commitment (OPC), supervised community treatment, extended leave, extended release or supervised discharge.
1.2. entirely voluntary care
The care that a person would normally receive had they not been included in the research trial, as long as it did not involve CCT in any form.
2. Comparison II: community treatment orders versus supervised discharge
Two different types of compulsory treatment, CTOs and supervised discharge, however brief (see Types of interventions).
3. Comparison III: community treatment orders versus standard care (encompassing both voluntary care and supervised discharge)
In pragmatic clinical trials, it may not be possible to make a clear determination on whether standard care bore a closer resemblance to comparison I (CCT versus entirely voluntary care) or II (CTOs versus supervised discharge). In line with previous work, we therefore combined studies from both comparisons if there was uncertainty about the exact nature of the control condition (Kisely 2014a).
Types of outcome measures
We did not plan to report highly specific outcomes (e.g. 'sense of safety') because multiple testing of sub‐components of outcome scales carries a risk of type I errors (finding a difference when none was present). Outcomes relating to the process of the interventions themselves, such as number of outpatient visits, were not reported (Wagner 2003).
In the original protocol for this study we stated we would group outcomes into short term (within 12 weeks of the start of therapy), medium term (between 13 and 24 weeks after the beginning of therapy) and long term (more than 24 weeks after the start of therapy). Only the Swartz 1999 study reported results of intermediate periods of follow‐up, and these were not from their RCT. We have therefore only been able to report outcomes in the medium term (11 to 12 months of follow‐up). Only one study reported on outcomes at 36 months' follow‐up (Burns 2013)
Primary outcomes
1. Health service contact and utilisation.
1.1. Admission/readmission to hospital.
1.2. Bed‐days spent in hospital.
2. Social functioning.
2.1. Specific ‐ imprisonment, police contact and arrests.
Secondary outcomes
1. Health service contact and utilisation.
1.1. Remaining in contact with psychiatric services ‐ leaving the study early.
1.2. Number with multiple readmissions ‐ see Differences between protocol and review
1.3. Compliance with medication
2. Social functioning.
2.1. General.
2.2. Specific ‐ employment.
2.3. Specific ‐ accommodation status.
5. Quality of life.
5.1. General.
5.2. Self‐esteem.
6. Satisfaction.
6.1. Number of needs for care.
6.2. Patierticipant satisfaction.
6.3. Carer satisfaction.
6.4. Perceived coercion.
7. Adverse events.
7.1. Mortality.
8. Economic outcomes.
'Summary of findings' table
We used the GRADE approach to interpret findings (Schünemann 2008) and used the GRADE profiler to import data from Review Manager 5 (RevMan) to create 'Summary of findings' tables. These tables provide outcome‐specific information concerning the overall quality of evidence from each included study in the comparison, the magnitude of effect of the interventions examined and the sum of available data on all outcomes we rated as important to patient care and decision making. We have been able to add more outcomes to the table and selected the following main outcomes for inclusion in the 'Summary of findings' tables.
1. Health service outcomes.
1.1. Admission/readmission to hospital.
1.2. Bed‐days in hospital.
1.3. Compliance with treatment.
1.4. Number with multiple readmissions by 12 months.
1.5. Days in community before first admission.
2. Participant level outcomes.
2.1. Mental state
2.2. Global state
2.3. Social functioning: trouble with police, homeless.
2.4. Quality of life: victimisation.
2.5. Satisfaction with care; perceived coercion.
Search methods for identification of studies
Electronic searches
Cochrane Schizophrenia Group's Study‐Based Register of Trials
On 3 June 2016, the Information Specialist searched the register using the following search strategy which has been developed based on literature review and consultation with the authors of the review:
(*Involuntary* OR *Treatment Order* OR *Outpatient Commitment*) in Intervention Field of STUDY
In such study‐based register, searching the major concept retrieves all the synonyms and relevant studies because all the studies have already been organised based on their interventions and linked to the relevant topics.
This register is compiled by systematic searches of major resources (including MEDLINE, Embase, AMED, BIOSIS, 95% CINAHL, PsycINFO, PubMed, and registries of clinical trials) and their monthly updates, handsearches, grey literature and conference proceedings (see Group's Module). There is no language, date, document type, or publication status limitations for inclusion of records into the register.
For previous searches, see Appendix 1.
Searching other resources
1. Reference searching
We also inspected the references of all identified studies (including those rejected from the review).
2. Personal contact
We contacted the first author of each included study and known experts who had published reviews in the field for information regarding unpublished trials and extra data on the published trials.
Data collection and analysis
For previous data collection and analysis, see Appendix 2.
Selection of studies
Two review authors (SK, LAC) independently inspected the citations identified from the search. They identified potentially relevant abstracts, ordered full papers, and reassessed these for inclusion and methodological quality. They discussed and reported any disagreement. Where the two reviewers disagreed about the inclusion of a study, we resolved by consensus, and consultation with a third reviewer if a dispute could not be resolved. Where resolution was not possible we contacted the author to obtain more information and clarification. In order to restrict selection bias, we printed out a list of all titles and abstracts excluding the author's names, institutions, and journal titles. We rejected the article if the title and abstract contained sufficient information to determine that the article did not meet the inclusion criteria. We kept a record of all rejected papers and the reasons for rejection.
For the 2013 and 2016 updates only a few citations were found during the searches, one review author (SK) independently inspected these citations from the electronic search and identified relevant abstracts. SK also inspected full articles of the abstracts meeting inclusion criteria.
Data extraction and management
1. Extraction
Two review authors (SK and LAC) independently extracted data from included studies. Again, we discussed any disagreement, documented our decisions and, if necessary, we contacted the authors of studies for clarification. Whenever possible we extracted data presented in graphs and figures but we only included such data if two review authors independently had the same result. We made attempts to contact authors through an open‐ended request in order to obtain any missing information or for clarification whenever necessary. Where possible, we extracted data relevant to each component centre of multi‐centre studies separately.
2. Management
2.1. Forms
We extracted data onto standard, simple forms.
2.2. Scale‐derived data
We included continuous data from rating scales only if:
-
the psychometric properties of the measuring instrument had been described in a peer‐reviewed journal (Marshall 2000); and
-
the measuring instrument had not been written or modified by one of the trialists for that particular trial.
Ideally, the measuring instrument should have either been a self‐report or completed by an independent rater or relative (not the therapist). We realise that this is not often reported clearly; we have noted whether or not this is the case in Description of studies.
2.3. Endpoint versus change data
There are advantages of both endpoint and change data. Change data can remove a component of between‐person variability from the analysis. However, calculation of change needs two assessments (baseline and endpoint), which can be difficult in unstable and difficult to measure conditions such as schizophrenia. We decided primarily to use endpoint data, and only use change data if endpoint data were not available. We combined endpoint and change data in the analysis as we used mean differences (MD) rather than standardised mean differences (SMD) throughout (Higgins 2011, Section 9.4.5.2).
2.4. Skewed data
Continuous data on clinical and social outcomes are often not normally distributed. To avoid the problem of applying parametric tests to non‐parametric data, we aimed to apply the following standards to all data before inclusion:
-
standard deviations (SDs) and means were reported in the paper or obtainable from the authors;
-
when a scale starts from the finite number zero, the SD, when multiplied by two, is less than the mean (as otherwise the mean is unlikely to be an appropriate measure of the centre of the distribution (Altman 1996));
-
if a scale started from a positive value (such as the Positive and Negative Syndrome Scale (PANSS, Kay 1986), which can have values from 30 to 210), we planned to modify the calculation described above to take the scale starting point into account. In these cases, skew is present if 2 SD > (S ‐ Smin), where S is the mean score and Smin is the minimum score.
Endpoint scores on scales often have a finite start and endpoint and these rules can be applied. We planned to enter skewed endpoint data from studies of fewer than 200 participants in additional tables rather than into an analysis. Skewed data pose less of a problem when looking at means if the sample size is large; we entered such endpoint data into syntheses.
When continuous data are presented on a scale that includes a possibility of negative values (such as change data), it is difficult to determine whether data are skewed or not. Therefore, we entered skewed change data into analyses regardless of size of study.
2.5. Common measure
To facilitate comparison between trials, we intended to convert variables that can be reported in different metrics, such as days in hospital (mean days per year, per week or per month) to a common metric (e.g. mean days per month).
2.6. Conversion of continuous to binary
Where possible, we converted outcome measures to binary data. This can be done by identifying cut‐off points on rating scales and dividing participants accordingly into 'clinically improved' or 'not clinically improved'. It is generally assumed that if there is a 50% reduction in a scale‐derived score such as the BPRS (Overall 1962) or the PANSS (Kay 1986), this could be considered as a clinically significant response (Leucht 2005a; Leucht 2005b). If data based on these thresholds were not available, we used the primary cut‐off presented by the original authors.
2.7. Direction of graphs
Where possible, we entered data in such a way that the area to the left of the line of no effect indicated a favourable outcome for compulsory community and involuntary outpatient treatment. Where keeping to this made it impossible to avoid outcome titles with clumsy double‐negatives (e.g. 'Not worsened'), we reported data where the left of the line indicates an unfavourable outcome. This was noted in the relevant graphs.
Assessment of risk of bias in included studies
Two review authors (SK and LAC) independently assessed risk of bias using the tool described in the Cochrane Handbook for Systematic Reviews of Interventions (Higgins 2008). This tool encourages consideration of how the sequence was generated, how allocation was concealed, the integrity of blinding at outcome, the completeness of outcome data, selective reporting and other biases. We would have excluded studies where allocation was clearly not concealed.
For the updates one review author (SK) worked independently to update the risk of bias using criteria described in the Cochrane Handbook for Systematic Reviews of Interventions (Higgins 2011). This new set of criteria is based on evidence of associations between overestimate of effect and high risk of bias of the article such as sequence generation, allocation concealment, blinding, incomplete outcome data and selective reporting.
Where inadequate details of randomisation and other characteristics of trials were provided, we contacted authors of the studies in order to obtain additional information.
We have noted the level of risk of bias in both the text of the review and in summary of findings Table for the main comparison.
Measures of treatment effect
1. Binary data
For binary outcomes, we calculated a standard estimation of the risk ratio (RR) and its 95% confidence interval (CI). It has been shown that RR is more intuitive (Boissel 1999) than odds ratios (OR) and that ORs tend to be interpreted as RR by clinicians (Deeks 2000). The number needed to treat for an additional beneficial outcome (NNTB) or harmful outcome (NNTH) is intuitively attractive to clinicians but needs to be interpreted with caution (Hutton 2009). For binary data presented in the 'Summary of findings' tables, where possible, we calculated illustrative comparative risks.
2. Continuous data
For continuous outcomes, we estimated MD between groups. We preferred not to calculate effect size measures (standardised mean difference). However, if scales of very considerable similarity were used, we presumed there was a small difference in measurement, calculated effect size, and transformed the effect back to the units of one or more of the specific instruments.
Unit of analysis issues
1. Cluster trials
Studies increasingly employ 'cluster randomisation' (such as randomisation by clinician or practice), but analysis and pooling of clustered data poses problems. Authors often fail to account for intraclass correlation in clustered studies, leading to a unit of analysis error (Divine 1992) whereby P values are spuriously low, CIs unduly narrow and statistical significance overestimated. This causes type I errors (Bland 1997; Gulliford 1999).
Cluster trials were eligible for inclusion; however, the three studies identified in our review were randomised by participant, not by clinician or practice. Had we included cluster trials, where clustering was not accounted for in primary studies, we planned to present data in a table, indicating the presence of a probable unit of analysis error. In subsequent versions of this review, and if relevant, we will seek to contact first authors of studies to obtain intraclass correlation coefficients (ICCs) for their clustered data and to adjust for this by using accepted methods (Gulliford 1999). Where clustering had been incorporated into the analysis of primary studies, we planned to present these data as if from a non‐cluster randomised study, but adjust for the clustering effect.
We have sought statistical advice and have been advised that if the binary data are presented in a report, they should be divided by a 'design effect'. This is calculated using the mean number of participants per cluster (m) and the ICC (design effect = 1 + (m ‐ 1) × ICC) (Donner 2002). If the ICC is not reported, we willassume it to be 0.1 (Ukoumunne 1999).
If cluster studies are appropriately analysed taking into account ICCs and relevant data documented in the report, data can be synthesised with other studies using the generic inverse variance technique.
2. Cross‐over trials
A major concern of cross‐over trials is the carry‐over effect. It occurs if an effect (e.g. pharmacological, physiological or psychological) of the treatment in the first phase is carried over to the second phase. As a consequence, on entry to the second phase, the participants can differ systematically from their initial state despite a washout phase. For the same reason, cross‐over trials are not appropriate if the condition of interest is unstable (Elbourne 2002). As both effects are very likely in SMI, had we included cross‐over trials, we planned to use only the data of the first phase of any cross‐over studies.
3. Studies with multiple treatment groups
If we had included any studies that involved more than two treatment arms, if relevant, we planned to present the additional treatment arms in comparisons. If data were binary, we would have added these and combined them within the two‐by‐two table. If data were continuous, we would have combined data following the formula in Section 7.7.3.8 (Combining groups) of the Cochrane Handbook for Systemic Reviews of Interventions (Higgins 2011). Where additional treatment arms were not relevant, we would not have presented these data.
Dealing with missing data
1. Overall loss of credibility
At some degree of loss of follow‐up, data must lose credibility (Xia 2009). We chose that, for any particular outcome, should more than 50% of data be unaccounted for, we would not reproduce these data or use them within analyses. However, if more than 50% of participants in one arm of a study were lost, but the total loss was less than 50%, we addressed this within the 'Summary of findings' tables by downgrading quality. Finally, we also downgraded quality within the 'Summary of findings' tables should loss be 25% to 50% in total.
2. Binary
In the case where attrition for a binary outcome was between 0% and 50% and where these data were not clearly described, we presented data on a 'once‐randomised‐always‐analyse' basis (an intention‐to‐treat analysis). Participants leaving the study early were all assumed to have the same rates of negative outcome as participants who completed, with the exception of the outcome of death and adverse effects. For these outcomes, the rate of participants who stay in the study ‐ in that particular arm of the trial ‐ were used for those who did not. We undertook a sensitivity analysis to test how prone the primary outcomes were to change when data only from people who completed the study to that point were compared to the intention‐to‐treat analysis using the above assumptions.
3. Continuous
3.1. Attrition
In the case where attrition for a continuous outcome was between 0% and 50%, and data only from people who completed the study to that point were reported, we presented and used these data.
3.2. Standard deviations
If SDs were not reported, we first tried to obtain the missing values from the authors. If not available, where there were missing measures of variance for continuous data, but an exact standard error (SE) and CIs available for group means, and either a P value or T value available for differences in mean, we calculated them according to the rules described in the Cochrane Handbook for Systemic Reviews of Interventions (Higgins 2011): when only the SE was reported, we calculated SDs by the formula SD = SE × square root (n). Sections 7.7.3 and 16.1.3 of the Cochrane Handbook for Systemic Reviews of Interventions present detailed formulae for estimating SDs from P values, T or F values, CIs, ranges or other statistics (Higgins 2011). If these formulae did not apply, we calculated the SDs according to a validated imputation method which is based on the SDs of the other included studies (Furukawa 2006). If the number of studies was very low, we imputed a missing SD from an alternative study with similar results. Although some of these imputation strategies can introduce error, the alternative was to exclude a given study's outcome and thus to lose information. We nevertheless examined the validity of the imputations in a sensitivity analysis excluding imputed values.
3.3. Last observation carried forward
We anticipated that some studies would employ the method of last observation carried forward (LOCF). As with all methods of imputation to deal with missing data, LOCF introduces uncertainty about the reliability of the results (Leucht 2007). Therefore, where LOCF data were used in the trial, if less than 50% of the data had been assumed, we intended to reproduce these data and indicate that they were the product of LOCF assumptions.
Assessment of heterogeneity
1. Clinical heterogeneity
We considered all included studies initially, without seeing comparison data, to judge clinical heterogeneity. We simply inspected all studies for clearly outlying people or situations which we had not predicted would arise. When such situations or participant groups arose, we fully discussed these.
2. Methodological heterogeneity
We considered all included studies initially, without seeing comparison data, to judge methodological heterogeneity. We simply inspected all studies for clearly outlying methods which we had not predicted would arise. When such methodological outliers arose, we fully discussed these.
3. Statistical heterogeneity
3.1. Visual inspection
We visually inspected graphs to investigate the possibility of statistical heterogeneity.
3.2. Employing the I2 statistic
We investigated heterogeneity between studies by considering the I2 statistic alongside the P value of the Chi2 test. The I2 statistic provides an estimate of the percentage of inconsistency thought to be due to chance (Higgins 2003). The importance of the observed value of the I2 statistic depends on the magnitude and direction of effects and on the strength of evidence for heterogeneity (e.g. P value from Chi2 test, or a CI for the I2 statistic). An I2 statistic estimate of around 50% or greater accompanied by a statistically significant Chi2 statistic was interpreted as evidence of substantial levels of heterogeneity (Higgins 2011). When there were substantial levels of heterogeneity in the primary outcomes, we explored reasons for heterogeneity (Subgroup analysis and investigation of heterogeneity).
Assessment of reporting biases
Reporting biases arise when the dissemination of research findings is influenced by the nature and direction of results (Egger 1997). These are described in Section 10 of the Cochrane Handbook for Systemic Reviews of Interventions (Higgins 2011). We are aware that funnel plots may be useful in investigating reporting biases but are of limited power to detect small‐study effects. Only three trials were included in this version of the review. We planned to use funnel plots for outcomes where there were 10 or more studies, or where all studies were of similar sizes. In other cases, where funnel plots are possible, we would have sought statistical advice in their interpretation.
Data synthesis
We understand that there is no closed argument for preference for use of fixed‐effect or random‐effects models. The random‐effects method incorporates an assumption that the different studies are estimating different, yet related, intervention effects. This often seems to be true to us and the random‐effects model takes into account differences between studies even if there is no statistically significant heterogeneity. However, there is a disadvantage to the random‐effects model: it puts added weight onto small studies which often are the most biased ones. Depending on the direction of effect, these studies can either inflate or deflate the effect size. We chose the fixed‐effect model for all but one of the analyses given the similarity of participants and interventions in each comparison. The exception was for quality of life in Comparison I (CCT versus entirely voluntary care) and multiple readmissions in Comparison III (CTOs versus standard care encompassing both voluntary care and supervised discharge) (see below) where we used the random‐effects model. However, the reader is able to choose to inspect the data using the random‐effects model.
Subgroup analysis and investigation of heterogeneity
1. Subgroup analyses ‐ only primary outcomes
1.1. Clinical state, stage or problem
We investigated the effect of different types of intervention (e.g. CTOs, involuntary outpatient treatment, involuntary OPC or supervised discharge).
2. Investigation of heterogeneity
If inconsistency was high, we reported this. First, we investigated whether data had been entered correctly. Second, if data were correct, we visually inspected the graph and successively removed outlying studies to see if homogeneity was restored. For this review, we had decided that should this occur with data contributing to the summary finding of no more than around 10% of the total weighting, we would present data. If not, then we would not pool data but would discuss issues. We know of no supporting research for this 10% cut‐off, but we used prediction intervals as an alternative to this unsatisfactory state.
Sensitivity analysis
We applied all sensitivity analyses to the primary outcomes of this review.
1. Implication of randomisation
We aimed to include trials in a sensitivity analysis if they were described in some way so as to imply randomisation. For the primary outcomes, we included these studies and if there was no substantive difference when the implied randomised studies were added to those with a better description of randomisation, we entered all data from these studies.
2. Assumptions for lost binary data
Where assumptions had to be made regarding people lost to follow‐up (see Dealing with missing data), we compared the findings of the primary outcomes when we used our assumption/s and when we used data only from people who completed the study to that point. If there was a substantial difference, we reported results and discussed them but continued to employ our assumption.
Where assumptions had to be made regarding missing SDs data (see Dealing with missing data), we compared the findings of the primary outcomes when we used our assumption/s and when we used data only from people who completed the study to that point. We undertook a sensitivity analysis to test how prone results were to change when completer‐only data were compared to the imputed data using the above assumption. If there was a substantial difference, we reported results and discussed them but continued to employ our assumption
3. Risk of bias
We analysed the effects of excluding trials that were at high risk of bias across one or more of the domains of randomisation (see also Assessment of risk of bias in included studies) for the meta‐analysis of the primary outcome. If the exclusion of trials at high risk of bias did not substantially alter the direction of effect or the precision of the effect estimates, then we included data from these trials in the analysis.
4. Imputed values
We also planned to undertake a sensitivity analysis to assess the effects of including data from trials where we used imputed values for ICC in calculating the design effect in cluster randomised trials but this was not required for the current version of the review.
If we noted substantial differences in the direction or precision of effect estimates in any of the sensitivity analyses listed above, we did not pool data from the excluded trials with the other trials contributing to the outcome, but presented them separately.
Results
Description of studies
See Characteristics of included studies and Characteristics of excluded studies tables.
Results of the search
Figure 1 gives details of our search results. We found 74 papers that were potentially relevant in our original 2003 search. Later searches in 2013, 2014 and 2016 identified nine further possible publications. Of these, we excluded 66 articles because they did not meet our inclusion criteria, lacked relevant data or were evaluating different types of treatment such as joint crisis plans. This left 18 articles covering three studies (Figure 1). Two of the studies were identified in the original search of 2003 (Swartz 1999; Steadman 2001) and the third in the 2014 search (Burns 2013).
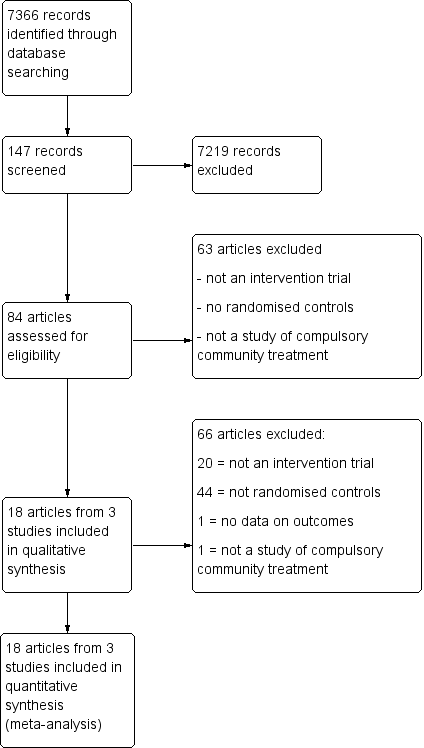
Study flow diagram.
Included studies
We included three studies involving 749 participants: two studies from the USA comparing OPC with entirely voluntary treatment (Swartz 1999; Steadman 2001), and one UK study, the Oxford Community Treatment Order Evaluation Trial (OCTET), comparing two types of CCT interspaced with voluntary care (Burns 2013). OCTET randomised participants discharged from hospital to an experimental group (CTO) or a control group (extended leave under section 17 of the Mental Health Act) and compared their outcomes at 12 months (Burns 2013). "Leave of absence" under Section 17 of the Act allows an involuntarily detained person to leave hospital for a period of days to weeks while remaining subject to the inpatient committal order. The person can be returned to hospital if he or she does not follow the treatment plan or shows signs of significant deterioration.
Excluded studies
We excluded 66 articles. All but two were excluded as they were not RCTs, did not contain primary data or were reviews of intervention studies. Of the two excluded RCTs, one trial reported outcomes inherent to the process of OPC, namely the number of outpatient visits for medication review, counselling and case management (Wagner 2003). The other RCT was a study of joint crisis plans (Thornicroft 2013).
Risk of bias in included studies
We assessed risk of bias using the Cochrane assessment of 'Risk of bias' tool.
Allocation
Steadman 2001, the New York study, used a random number list to identify assignment to either the intervention or control group. The random number list was generated by computer, which then split 200 numbers between the groups. The printed list was maintained in the research team's office in a locked file. When the treatment team had completed their treatment plan, they called the research team who checked the computer list to see whether the client was to be assigned to the intervention or control group.
In the OCTET study, consenting participants were randomly assigned (ratio 1:1) by an independent statistician to be discharged from hospital either on CTO or Section 17 leave (Burns 2013). Randomisation used random permuted blocks with lengths of two, four and six, and stratified for sex (male or female), diagnosis of schizophrenia (yes or no) and duration of illness (less than two years or two years or greater). Assignments were enclosed in sequentially numbered, opaque, sealed envelopes and stored by a researcher independent to the trial team. The details of the sequence remained unknown to all members of the trial team until completion of recruitment, data collection and analyses. Randomisation took place after consent was obtained and the baseline interview was done. The envelope was opened on the day of the interview by the independent researcher after recording the participant's trial identification number on the envelope. She then communicated the randomised allocation to the recruiting researcher by telephone.
Swartz 1999 stated it was randomised but did not provide a description of the randomisation method.
We rated Steadman 2001 and Burns 2013 at low risk and Swartz 1999 at unclear risk of bias (Figure 2; Figure 3).

'Risk of bias' graph: review authors' judgements about each risk of bias item presented as percentages across all included studies.

'Risk of bias' summary: review authors' judgements about each risk of bias item for each included study.
Blinding
Two studies did not mentioned blinding (Swartz 1999; Steadman 2001). Although all three studies used some self‐report measures, it is unlikely participants, clinicians or assessors were blind to treatment status. Therefore, we rated the risk of bias as high. Burns 2013 involved allocation to two different types of legal status. Therefore, it was both impossible and unlawful to mask research assistants, treating clinicians or participants, thus we rated this as high risk.
Incomplete outcome data
Attrition rates for Steadman 2001 were 45%. In the case of OCTET, follow‐up for the main outcomes reached 100% although data on psychiatric symptoms, the Global Assessment of Functioning Scale (GAF) and measures of participant satisfaction were only available on 70% of the sample. Reporting on numbers leaving the Swartz 1999 study early was sometimes unclear. We attempted to undertake an intention‐to‐treat analysis of all the main outcomes including health service use and psychiatric symptoms. We rated Steadman 2001 at high risk and Swartz 1999 and Burns 2013 at low risk of attrition bias.
Selective reporting
We could not use continuous data for several outcomes, as no variance was reported. In Swartz 1999, data from randomised and non‐randomised analyses were sometimes amalgamated and reported percentages rather than absolute numbers of people who had been followed up. We contacted the authors who confirmed that, at follow‐up, there were 114 people in the control group, 102 in the court‐ordered OPC group and 46 who were not randomised. Similarly, the authors of the Steadman 2001 study supplied the additional data for an intention‐to‐treat analysis of their paper (67 people in the controls, 85 in the OPC group). Our overall rating was unclear risk of reporting bias.
Other potential sources of bias
None of the studies reported conflicts of interest.
One potential source of bias in the OCTET study was that participants were only included if they were thought to be equally suitable for a relatively short Section 17 or CTO (Burns 2013). The authors acknowledged that clinicians held back participants who they felt needed a CTO. The number of such excluded participants was unknown and this may have excluded particularly suitable people.
A second potential source of bias in the OCTET study was allowing clinicians to make decisions independent of initial randomisation whereby 40 participants (25%) allocated to Section 17 were subsequently placed on a CTO during the study and 35 participants randomised to CTOs (22%) did not actually receive the intervention (Burns 2013). A sensitivity analysis to remove these protocol violations may, in turn, have left the study underpowered. Furthermore, removing these participants in a sensitivity analysis does not resolve the possibility that participants in the Section 17 group swapped to a CTO might have been more severely ill than those remaining on Section 17 as per the protocol. For instance, they may have been more difficult to manage or refusing to comply with follow‐up when discharged from hospital. In the case of the 22% of people on CTOs who received no CTO, there is the possibility that these were good prognosis cases who were doing well and who clinicians predicted would adhere to follow‐up. Removing them in a sensitivity analysis potentially excluded the participants with the best‐outcome from the CTO group. All these factors may have reduced any differences in outcomes between the Section 17 and CTO participants.
A third potential source of bias in the OCTET study was that clinicians could keep participants on Section 17 for a variable period of time (Burns 2013). It is possible that participants who were most likely to default on treatment were maintained on Section 17 and that for these participants it acted more like a CTO thus reducing the chance of the study finding an effect of CTOs.
There was also uncertainty concerning the control condition within OCTET (Burns 2013). Although the length of initial compulsory outpatient treatment differed widely between the two groups (medians of 183 days versus eight days), Section 17 patients reported spending a mean of four months on some form of compulsory treatment during the 12 months. This comprised the mean of eight days of Section 17 on discharge plus periods of compulsory care during follow‐up (outcome) ‐ overall half the time in compulsory care as the people allocated to CTOs. An interpretation of this finding is that the participants in the control group still spent the majority of the study in voluntary treatment.
In addition, around 20% of the participants were ineligible or refused to take part in OCTET (Burns 2013). These people may have been the most ill, uncooperative or lacking in insight, and therefore, the ones most likely to benefit from CTOs.
Finally, the intervention was not manualised, or fidelity checked. it is possible that in any of the three studies, participating clinicians had varying levels of commitment to, or familiarity with, the use of CCT and thus may have not used the intervention optimally.
Effects of interventions
See: Summary of findings for the main comparison COURT ORDERED OUTPATIENT COMMITMENT compared with ENTIRELY VOLUNTARY CARE for people with severe mental disorders; Summary of findings 2 COMMUNITY TREATMENT ORDERS compared with SUPERVISED DISCHARGE (SECTION 17) for people with severe mental disorders; Summary of findings 3 COMPULSORY COMMUNITY TREATMENT compared with STANDARD CARE for people with severe mental disorders
Comparison 1. Court ordered outpatient commitment compared with entirely voluntary care
Attrition rates for Steadman 2001 were 45%. As we included only two studies in this comparison, we decided that, rather than excluding data from this study, we would carry out a sensitivity analysis and, if the high attrition data substantially changed the estimate of effect, we would present them separately. However, the inclusion of data from Steadman 2001 did not alter the overall effect and so we added them to data from Swartz 1999. Results are presented as fixed‐effect RRs with 95% CIs or fixed‐effect MD with 95% CIs with the exception of quality of life on the Lehman Quality of Life Scale where there was evidence of heterogeneity. In this case, we used the random‐effects model.
Health service outcomes by 11 to 12 months
1.1. Readmission to hospital
Readmission rates were similar. By 11 to 12 months, the trials found no clear difference between groups (RR 0.98, 95% CI 0.79 to 1.2, Analysis 1.1).
Steadman 2001 reported readmissions to acute facilities and state hospitals separately but it was unclear if participants could have been admitted to both during the follow‐up period. Therefore, to avoid the possibility of double‐counting, we used readmissions to acute facilities for our primary outcome. However, we also conducted a sensitivity analysis of the effect of including state hospital admissions ‐ see 'Subgroup and sensitivity analyses' section.
1.2. Bed‐days spent in hospital
Only one study reported means and SDs (Swartz 1999). There was no difference in bed‐days spent in hospital by the end of follow‐up (MD ‐1.24, 95% CI ‐15.16 to 12.68, Analysis 1.2). The other study reported medians. Although there was a large difference between people allocated to CTOs and controls (median: 43 days to CTO versus 101 days to control), this did not reach statistical significance.
1.3. Number with multiple readmissions
Steadman 2001 reported the number of participants with multiple admissions. There was no clear difference between people allocated to CTOs and controls (RR 1.87, 95% CI 0.87 to 4.01, Analysis 1.3).
1.4. Compliance with treatment
At 12‐month follow‐up, there was no difference between groups for compliance with medication (RR 0.99, 95% CI 0.83 to 1.19, Analysis 1.4).
Participant level outcomes at 11 to 12 months
1.5. Psychiatric symptoms and global state at 11 to 12 months
Steadman 2001 provided data on symptoms using the BPRS and GAF. In both cases, there was no clear difference between allocation to CTO and controls at follow‐up. It was only possible to impute SDs for the GAF scores (MD ‐3.00, 95% CI ‐8.08 to 2.08, Analysis 1.5).
1.6. Social functioning: trouble with police
People receiving CCT were no more likely to be arrested than people receiving standard care (RR outcome 'arrested at least once' 0.97, 95% CI 0.62 to 1.52, Analysis 1.6). Results also showed people allocated CCT were no more likely to commit a violent act than people in standard care (RR 0.82, 95% CI 0.56 to 1.21, Analysis 1.6).
1.7. Social functioning: accommodation status
Although the results appeared to favour the CCT group, we found no clear difference in the risk of being homeless between groups (RR 0.67, 95% CI 0.39 to 1.15, Analysis 1.7).
1.8. Quality of life: Lehman Quality of Life Scale
Both studies provided information on quality of life although only one gave SDs (Swartz 1999). However, given the similarity of results from both studies, we imputed the missing SD from one study to the other. At follow‐up, there was no difference between people allocated to CTOs and controls (RR ‐0.22, 95% CI‐0.95 to 0.50, Analysis 1.8).
1.9. Quality of life: victimisation
Swartz 1999 provided data for victimisation. Participants receiving CCT were significantly less likely to have been victimised (been a victim once or more of either violent or non‐violent crime) than participants in the standard care group (RR 0.50, 95% CI 0.31 to 0.8, Analysis 1.9).
1.10. Satisfaction with care: perceived coercion
For this review, we defined perceived coercion as a participant feeling lack of autonomy in seeking outpatient care or negative pressures (or both), captured threats or force pertaining to treatment (or both). Process exclusion consisted of participants' feelings of lack of involvement and validation in treatment decisions. We found no clear difference in the perception of being coerced between the two groups (RR 1.36, 95% CI 0.97 to 1.89, Analysis 1.10).
1.11. Additional analyses
All the papers from Swartz 1999 reported the results of a non‐random post hoc analysis of the intervention group based on duration of involuntary outpatient treatment. In two papers, this was supplemented with a follow‐up of an additional non‐randomised group of participants with a recent history of violence who were placed on CCT (Swartz 2001; Hiday 2002). These papers suggested that an OPC of greater than 180 days' duration was associated with improved outcomes in terms of readmission rate, compliance with medication, homelessness and contacts with the criminal justice system. However, such analyses are subject to the bias that randomised trials are designed to minimise. For instance, an analysis of people who have been not randomly assigned to OPC groups of less than, and more than, 180 days may reflect a bias where OPC was selectively extended when it seemed to be helping the participant (Szmukler 2001) despite assurances from the Swartz and colleagues that participants who had OPC extended were less tractable than participants who did not (Swartz 1999).
Comparison 2. Community treatment orders versus supervised discharge (Section 17)
We found one relevant trial comparing CCT versus supervised discharge (Section 17) (n = 333) (Burns 2013).
Health service outcomes by 12‐month follow‐up
2.1. Readmission to hospital by 12‐month follow‐up
There was no clear difference between CTOs and Section 17 by 12‐month follow‐up in readmission to hospital by 12‐month follow‐up (RR 0.99, 95% CI 0.74 to 1.32, Analysis 2.1).
2.2. Bed‐days spent in hospital by 12 months
There was no clear difference between CTOs and Section 17 in hospital bed‐days by 12‐month follow‐up (MD ‐8.70, 95% CI ‐30.88 to 13.48, Analysis 2.3).
2.3. Number of readmissions by 12 months
There was no clear difference between CTOs and Section 17 in number of readmissions by 12‐month follow‐up (MD ‐0.20, 95% CI ‐0.45 to 0.05, Analysis 2.4).
2.4. Number with multiple readmissions by 12 months
There was no clear difference between CTOs and Section 17 in number with multiple readmissions by 12 months (RR 0.56, 95% CI 0.27 to 1.17, Analysis 2.5).
2.5. Days in community to first admission at 12‐month follow‐up
There was no clear difference between CTOs and Section 17 in days in the community to first admission at 12‐month follow‐up (MD 5.00, 95% CI ‐21.74 to 31.74, Analysis 2.6).
Health service outcomes by 36 months
2.2. Health service outcomes: 1b. Readmission to hospital by 36 months
2.7 Health service outcomes: 5b. Days in community till first admission and mean duration of bed‐days at 36 months
The authors were able to follow‐up all but three people who had been included in their original intention‐to‐treat analysis (total n = 330). There were no clear differences between participants originally randomised to CTO or Section 17 in terms of readmission to hospital (RR 0.71, 95% CI 0.45 to 1.11, Analysis 2.2), numbers with multiple readmissions (RR 1.07, 95% CI 0.62 to 1.85, Analysis 2.2), days in community to first admission (MD 60.00, 95% CI ‐27.62 to 147.62, Analysis 2.7) or bed‐days (MD ‐15.10, 95% CI ‐89.39 to 59.19, Analysis 2.7).
Participant level outcomes by 12‐month follow‐up
2.6. Brief Psychiatric Rating Scale at 12‐month follow‐up
There was no clear difference between CTOs and Section 17 in BPRS scores at 12‐month follow‐up (MD ‐0.10, 95% CI ‐3.17 to 2.97, Analysis 2.8).
2.7. Global Assessment of Functioning Scale at 12‐month follow‐up
There was no clear difference between CTOs and Section 17 in terms of GAF scores at 12‐month follow‐up (MD ‐0.70 95% CI ‐3.91 to 2.51, Analysis 2.9).
2.8. Satisfaction with care: perceived coercion at 11 to 12 month follow‐up
We used the Perceived Coercion Scale from the Admission Experience Schedule. There was no statistical difference between participants randomised to CTOs or Section 17 at 12‐month follow‐up (MD ‐0.50, 95% CI ‐1.71, to 0.71, Analysis 2.10).
2.9. Satisfaction with care: leverage at 11 to 12 months
Another measure of coercion is the experience of leverage in terms of pressure to have treatment. There was no statistical difference between the two treatment groups (OR 1.23 95% CI 0.66 to 2.31).
2.10. Social Outcomes Index at 12 months
Finally, there was no difference between groups in terms of alcohol or substance use, insight, psychotropic medication, experience of services and participant satisfaction as measured by standardised questionnaires. For example, the scores on the Objective Social Outcomes Index were almost identical (MD‐0.10 95% CI ‐0.40 to 0.20, Analysis 2.12).
Additional analyses
At 36‐month follow‐up, Burns 2013 also compared anyone in the trial who had experienced a CTO (n = 198) and those who had not (n = 132) irrespective of their original randomisation. The study authors used negative binomial regression to calculate incident density ratios (IDRs). People who had experienced a CTO had significantly more readmissions than those who had not (IDR 1.39, 95% CI 1.07 to 1.79) but otherwise there were no clear differences between groups in readmission rates, duration of readmission or time to first readmission. In addition, they did not identify a linear relationship between readmission outcomes and duration of CTO although participants who were on CTOs for between six and 12 months did better than participants with other durations of CTOs (less than six months, 12 to 24 months and 24 to 36 months). However, the major drawback of these analyses was that they were not adjusted for potential confounders given that participants in these two groups were not randomly allocated.
Comparison 3. Community Treatment Orders versus standard care (encompassing both voluntary care and supervised discharge)
Results are presented as fixed‐effect RR with 95% CIs or fixed‐effect MD with 95% CIs with the exception of bed‐days where there was evidence of heterogeneity. In this case, we used the random‐effects model.
Health service outcomes
3.1. Readmission to hospital by 11 to 12 months
All three studies contributed to this outcome (n = 749) (Swartz 1999; Steadman 2001; Burns 2013). There was no clear difference between participants on CTOs and controls in readmission to hospital by 12 months (RR 0.98, 95% CI 0.83 to 1.17, Analysis 3.1). In terms of NNTB, it would take 142 orders to prevent one readmission.
3.2. Bed‐days spent in hospital by 12 months
Two studies contributed to this meta‐analysis (Swartz 1999; Burns 2013). There was no clear difference between participants on CTOs and controls in bed‐days by 12 months (MD ‐3.35, 95% CI ‐15.14 to 8.44, Analysis 3.2).
3.3. Number with multiple readmissions by 12 months
Two studies contributed to this meta‐analysis (Steadman 2001; Burns 2013). There was no clear (statistical) difference in the number of people who required more than one readmission by 12 months (RR 1.02, 95% CI 0.31 to 3.33, Analysis 3.3).
Participant level outcomes
3.4. Global Assessment of Functioning Scale at 12 months
Only one study gave SDs (Burns 2013). However, given the similarity of results from the other study that reported this outcome (Steadman 2001), we imputed the missing SDs from one study to the other. At follow‐up, there was no difference between people allocated to CTOs and controls in global state (GAF) (MD ‐1.36 95% CI ‐4.07 to 1.35, Analysis 3.4).
3.5. Satisfaction with care: perceived coercion or leverage at 11 to 12 months
We combined the relevant dichotomous variables from all three studies (Swartz 1999; Steadman 2001; Burns 2013). This showed that participants on CCT did not feel more coerced that participants in the control group at 11 to 12 months (RR 1.30, 95% CI 0.98 to 1.71, Analysis 3.5).
Subgroup and sensitivity analyses
There were no differences in outcome between types of CCT as comparison I was restricted to court‐ordered OPC in the USS while comparison II was of clinician‐initiated CTOs in the UK. Similarly, the sensitivity analyses outlined in the Methods section did not change any of the results. The authors of the Burns 2013 study stated they used an intention‐to‐treat analysis in 166 CTO cases and 167 controls. However, immediately after randomisation two participants were found to be ineligible and one withdrew. These participants were not included in the intention‐to‐treat analysis. As a precaution, we undertook sensitivity analyses of the effect of including the 167 CTO cases and 169 controls who were randomised and, again, this did not alter the results. Finally, we studied the effect of including admissions to both acute facilities and state hospitals for people allocated to CTOs (49/85) and controls (42/67) in the New York study (Steadman 2001). This made no difference to the results (3 RCTs, n = 749, RR 0.93, 95% CI 0.80 to 1.09).
Missing outcomes
There were no data available for adverse effects or economic costs.
Discussion
Despite of the widespread use of CCT and the continued controversy as to its effectiveness, we were struck by the limited number of studies that have been conducted. This is possibly due to the difficulties of conducting RCTs in this area. Therefore, we attempted to draw modest conclusions, based on available evidence, and to highlight areas requiring further study, rather than draw firm conclusions that may not be based on evidence of high quality.
This review revealed little evidence for the effectiveness of CCT in any of the main outcome indices: health service use, costs, social functioning, mental state, quality of life or satisfaction with care. We were only able to establish a clear and statistically significant effect for one outcome, social functioning (victimisation).
Although we identified 15 papers, these represented only three trials. Two of these were of court‐ordered 'outpatient commitment' (OPC) in the USA with limited generalisability to jurisdictions where CCT is ordered by clinicians. The third trial, from the UK, was a study of clinician‐initiated, rather than court‐ordered, treatment as in the US RCTs and thus, more relevant to other jurisdictions such as Australia, Canada and New Zealand. However, this was a comparison of two different types of compulsory intervention of different durations rather than a comparison of compulsory intervention with entirely voluntary treatment. Problems common to all three studies included relatively small numbers of participants and questions concerning bias. This illustrates the difficult, but not impossible, task of using trial methods to study the effect of such legislation.
In the case of the North Carolina study (Swartz 1999), the study was supplemented by follow‐up of an additional non‐randomised group of participants with a recent history of violence who were also placed on OPC. It was sometimes difficult to separate the results of the randomised trials from the non‐randomised study. In the case of the New York study (Steadman 2001), there was a relatively small number of participants and the suggestion that members of the control group and their case managers thought that they were actually on OPC (NASMHPD 2001). These factors would minimise any effect of the intervention. In addition to the question around the voluntary or compulsory nature of the controls in the OCTET study, the other major issue was that a quarter of participants did not receive the intervention to which they were initially randomised. This was because treating physicians were able to make clinical decisions irrespective of initial randomisation, a requirement for the trial to be lawful.
Summary of main results
All three studies were of people in community settings who were followed up over 11 to 12 months. One study included 36‐month follow‐up data (Burns 2013). Two trials from the USA were of court‐ordered OPC compared with voluntary community treatment. The third study compared clinician‐initiated CTOs with another type of supervised discharge in England.
Comparison 1. Court ordered outpatient commitment compared with entirely voluntary care
1.1. Health service outcomes
Only data for two health service outcomes (readmission to hospital and compliance with medication) were usable. In both cases there were no differences between groups. By 12 months, people were no more likely to be readmitted to hospital if they were placed on OPC than if they had received standard care. They were also just as likely to comply with medication. However, it should be noted that these results were based on two studies only and in one attrition rates were 45% (Steadman 2001), so no firm conclusions can be made.
1.2. Participant level outcomes
Four participant level outcomes (trouble with the police, homelessness, coercion and victimisation) were presented.
By 12 months, the number of arrests by police were similar for both groups and people in the CCT group did not commit any more acts of violence than people in standard care. A problem with the data in this area was a possibility of selection bias as people with a history of violence were explicitly excluded from both trials. This limits their applicability as recent dangerousness, particularly violence against others, is often the reason for compulsory treatment in hospital or the community (Sensky 1991; Lansing 1997; DeRidder 2016). There is also a risk of bias when outcome data are not assessed blind to group status and the results of people who were not randomised or post hoc analyses are included in papers.
The numbers of people who were homeless by 12 months were similar in both groups.
The only significant benefit from CCT was for victimisation. People on CCT were less likely to be victims of a violent or non‐violent crime by 12 months in the North Carolina study (Swartz 1999).
In terms of possible adverse effects of CCT, perceived coercion was higher in the North Carolina study (Swartz 1999), but not in the New York study (Steadman 2001). The lack of any difference of perceived coercion in the New York study may have been due to the reported confusion that many case managers and community agencies had in distinguishing a person being in the study and being assigned to CCT (NASMHPD 2001). Further, the police in New York refused to bring to hospital for assessment people who breached their treatment orders. Combining the findings for perceived coercion from both studies in a meta‐analysis gave a non‐significant result.
Comparison 2. Compulsory community treatment versus supervised discharge (Section 17)
2.1. Health service outcomes
There were no differences between participants on CTO and supervised discharge in terms of readmissions, bed‐days or survival in the community.
2.2. Participant‐level outcomes
There were no differences between the two groups in terms of psychiatric symptoms or social functioning as measured by standardised instruments.
Comparison 3. Community Treatment Orders versus standard care (encompassing both voluntary care and supervised discharge)
Entering the relevant data from all three studies did not affect the non‐significant results for both health service and participant‐level outcomes. In terms of NNTBs, it would take 142 orders to prevent one readmission.
Overall completeness and applicability of evidence
Two trials were of OPC in the USA. This is a court‐ordered compulsory treatment plan and the findings may not be applicable to other jurisdictions where CCT is initiated by clinicians. In addition, both trials explicitly excluded people with a history of violence. Although understandable from an ethical and legal standpoint, this limits applicability, as recent dangerousness, particularly violence against others, is often the reason for compulsory treatment in hospital or the community.
The OCTET study was a comparison of two types of clinician‐ordered community treatment, CTOs and intermittent supervised discharge in England. This may be more applicable to other jurisdictions. However, around 20% of the sample were ineligible or refused to take part. These people may have been the most unwell or particularly lacking in insight, and therefore the ones most likely to benefit from CTOs.
Other important issues to be considered when applying the findings from all three studies to other jurisdictions include whether there are differing criteria for inpatient or outpatient committal, whether CCT can be imposed on people who are capable of making treatment decisions, powers conferred by CCT and if there is a requirement for prior hospitalisation.
Quality of the evidence
This is a difficult area to research using RCTs and so all three studies contained a number of potential biases. OCTET met three out of the seven criteria of Cochrane's tool for assessing risk of bias, the others only one, the majority being rated as unclear. There was no difference in these ratings by outcome. One issue in all three RCTs was selection and blindness bias and consequent applicability to everyday care. Depending on the study, people with a history of dangerousness were excluded and around 20% of eligible people lacked capacity to consent to the study, or refused to take part. This limits their applicability as recent dangerousness, particularly violence against others, is often the reason for compulsory treatment in hospital or the community (Sensky 1991; Lansing 1997; DeRidder 2016). Only two of the three studies described the process of randomisation in detail (Steadman 2001; Burns 2013). There is also a risk of bias when outcome data are not assessed blind to group status and the results of people who were not randomised or post hoc analyses are included in papers. All three studies used intention‐to‐treat analyses for all (Swartz 1999; Burns 2013), or at least some (Steadman 2001), of the outcomes of interest.
In the case of the North Carolina study (Swartz 1999), it was sometimes difficult to separate the results of the randomised trial from those of the follow‐up of an additional non‐randomised group of participants with a recent history of violence who were also placed on OPC. In the case of the New York study (Steadman 2001), there was a relatively small number of participants and the suggestion that members of the control group and their case managers thought that they were actually on OPC (NASMHPD 2001). These factors would minimise any effect of the intervention.
There were also fewer data on psychosocial outcomes as measured by standardised instruments.
All these issues illustrate the difficult, but not impossible, task of using trial methods to study the effect of such legislation. Nevertheless, RCTs may not always give a complete picture as some important or rare outcomes, such as mortality, cannot easily be assessed by a clinical trial (Kisely 2015). For instance, epidemiological studies have suggested that people on CTOs have reduced mortality compared with people receiving control interventions even after adjusting for confounders (Segal 2006a; Kisely 2013a). This is possibly by improving physical care through increased contact with community psychiatric services (Kisely 2013a). In addition, none of the studies in this review included the views of carers and families who are often supportive of CCT (O'Reilly 2006).
Potential biases in the review process
1. Post hoc decisions
We changed the level of acceptable loss to follow‐up. We felt that, in retrospect, the cut‐off of 35% was too restricting and changed this to 50%. We also added an additional comparison of two different types of CCT. We took both decisions since we found only three studies. We have tried to present data in a way as to allow the reader to evaluate the effects of doing this.
2. Authors' area of interest
Two authors of this review were also authors of some of the papers considered for inclusion (Preston 2002; Kisely 2004; Kisely 2005; Kisely 2006a; Kisely 2007a). We excluded all these papers because none of them were RCTs. It is possible that we, through detailed knowledge of these studies, excluded them, but for others, where our knowledge is not first hand, we allowed inclusion.
Agreements and disagreements with other studies or reviews
Our findings of limited effectiveness of CCT based on the three RCTs are consistent with several other independent reviews of CCT, which have concluded that CCT has little positive effect on outcomes such as hospital admissions, length of stay or compliance with medication (Ridgely 2001; Churchill 2007; Maughan 2014). Our finding that CCT does not cause an increase in perceived coercion is not compatible with one review of quantitative and qualitative studies (Pridham 2015).
'Risk of bias' graph: review authors' judgements about each risk of bias item presented as percentages across all included studies.
'Risk of bias' summary: review authors' judgements about each risk of bias item for each included study.
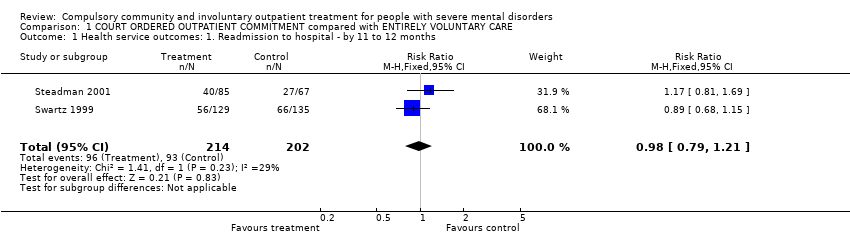
Comparison 1 COURT ORDERED OUTPATIENT COMMITMENT compared with ENTIRELY VOLUNTARY CARE, Outcome 1 Health service outcomes: 1. Readmission to hospital ‐ by 11 to 12 months.
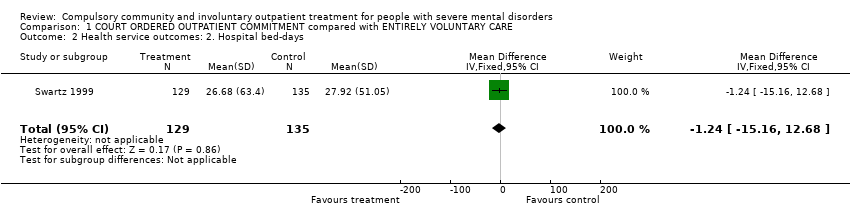
Comparison 1 COURT ORDERED OUTPATIENT COMMITMENT compared with ENTIRELY VOLUNTARY CARE, Outcome 2 Health service outcomes: 2. Hospital bed‐days.
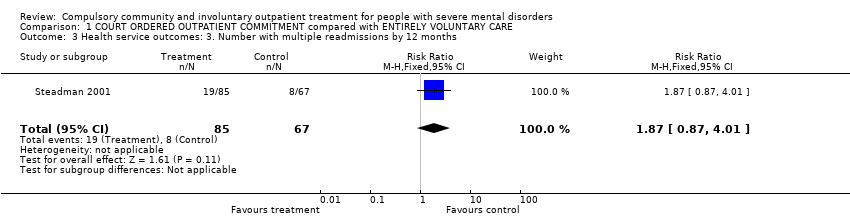
Comparison 1 COURT ORDERED OUTPATIENT COMMITMENT compared with ENTIRELY VOLUNTARY CARE, Outcome 3 Health service outcomes: 3. Number with multiple readmissions by 12 months.

Comparison 1 COURT ORDERED OUTPATIENT COMMITMENT compared with ENTIRELY VOLUNTARY CARE, Outcome 4 Health service outcomes: 4. Compliance with medication by 11 to 12 months.
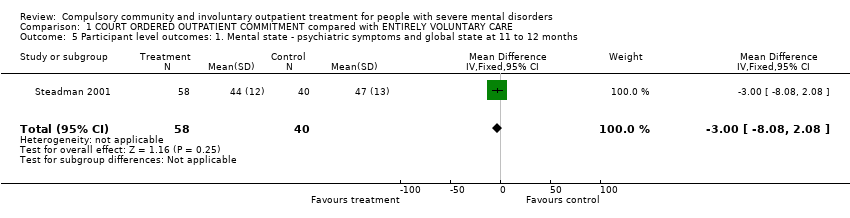
Comparison 1 COURT ORDERED OUTPATIENT COMMITMENT compared with ENTIRELY VOLUNTARY CARE, Outcome 5 Participant level outcomes: 1. Mental state ‐ psychiatric symptoms and global state at 11 to 12 months.
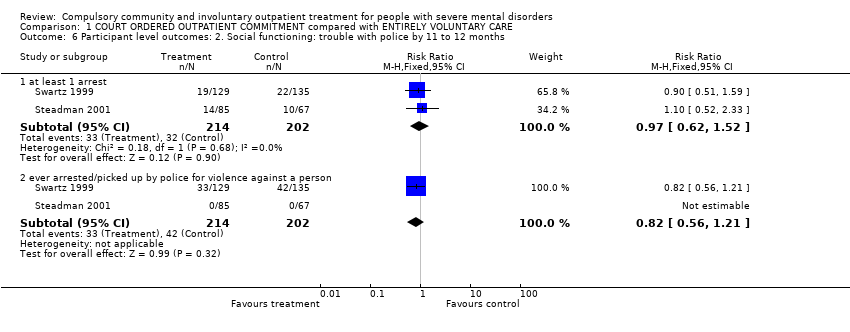
Comparison 1 COURT ORDERED OUTPATIENT COMMITMENT compared with ENTIRELY VOLUNTARY CARE, Outcome 6 Participant level outcomes: 2. Social functioning: trouble with police by 11 to 12 months.
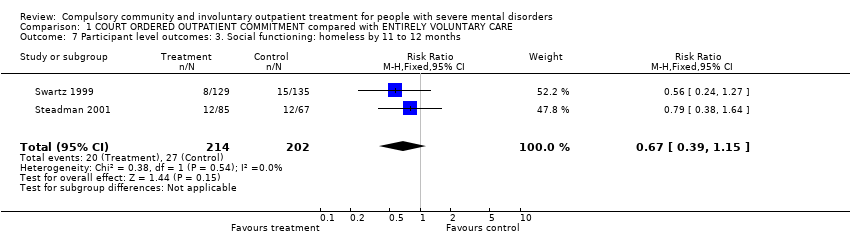
Comparison 1 COURT ORDERED OUTPATIENT COMMITMENT compared with ENTIRELY VOLUNTARY CARE, Outcome 7 Participant level outcomes: 3. Social functioning: homeless by 11 to 12 months.
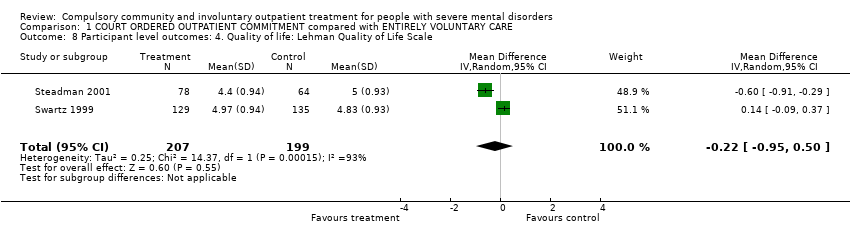
Comparison 1 COURT ORDERED OUTPATIENT COMMITMENT compared with ENTIRELY VOLUNTARY CARE, Outcome 8 Participant level outcomes: 4. Quality of life: Lehman Quality of Life Scale.

Comparison 1 COURT ORDERED OUTPATIENT COMMITMENT compared with ENTIRELY VOLUNTARY CARE, Outcome 9 Participant level outcomes: 5. Quality of life: victimisation by 11 to 12 months.

Comparison 1 COURT ORDERED OUTPATIENT COMMITMENT compared with ENTIRELY VOLUNTARY CARE, Outcome 10 Participant level outcomes: 6. Satisfaction with care: perceived coercion by 11 to 12 months.

Comparison 2 COMMUNITY TREATMENT ORDERS compared with SUPERVISED DISCHARGE (SECTION 17), Outcome 1 Health service outcomes: 1a. Readmission to hospital ‐ by 12 months.

Comparison 2 COMMUNITY TREATMENT ORDERS compared with SUPERVISED DISCHARGE (SECTION 17), Outcome 2 Health service outcomes. 1b. Readmission to hospital by 36 months.

Comparison 2 COMMUNITY TREATMENT ORDERS compared with SUPERVISED DISCHARGE (SECTION 17), Outcome 3 Health service outcomes: 2. Hospital bed‐days by 12 months.

Comparison 2 COMMUNITY TREATMENT ORDERS compared with SUPERVISED DISCHARGE (SECTION 17), Outcome 4 Health service outcomes: 3. Number of readmissions by 12 months.

Comparison 2 COMMUNITY TREATMENT ORDERS compared with SUPERVISED DISCHARGE (SECTION 17), Outcome 5 Health service outcomes: 4. Number with multiple readmissions by 12 months.

Comparison 2 COMMUNITY TREATMENT ORDERS compared with SUPERVISED DISCHARGE (SECTION 17), Outcome 6 Health service outcomes: 5a. Days in community till first admission by 12 months.

Comparison 2 COMMUNITY TREATMENT ORDERS compared with SUPERVISED DISCHARGE (SECTION 17), Outcome 7 Health service outcomes: 5b. Days in community till first admission and mean duration of bed‐days by 36 months.
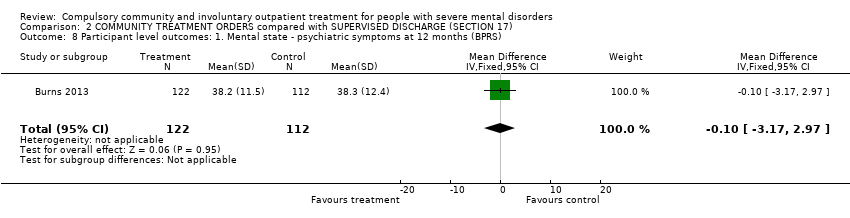
Comparison 2 COMMUNITY TREATMENT ORDERS compared with SUPERVISED DISCHARGE (SECTION 17), Outcome 8 Participant level outcomes: 1. Mental state ‐ psychiatric symptoms at 12 months (BPRS).

Comparison 2 COMMUNITY TREATMENT ORDERS compared with SUPERVISED DISCHARGE (SECTION 17), Outcome 9 Participant level outcomes: 2. Global state: GAF at 12 months.
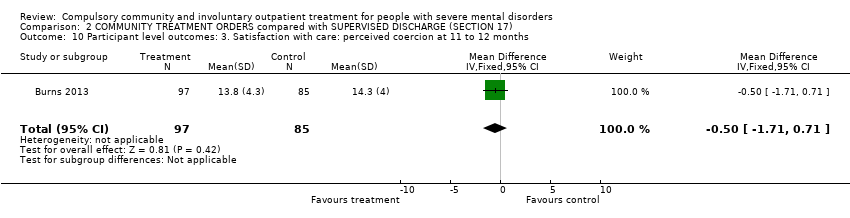
Comparison 2 COMMUNITY TREATMENT ORDERS compared with SUPERVISED DISCHARGE (SECTION 17), Outcome 10 Participant level outcomes: 3. Satisfaction with care: perceived coercion at 11 to 12 months.

Comparison 2 COMMUNITY TREATMENT ORDERS compared with SUPERVISED DISCHARGE (SECTION 17), Outcome 11 Participant level outcomes: 4. Satisfaction with care: leverage at 11 to 12 months.
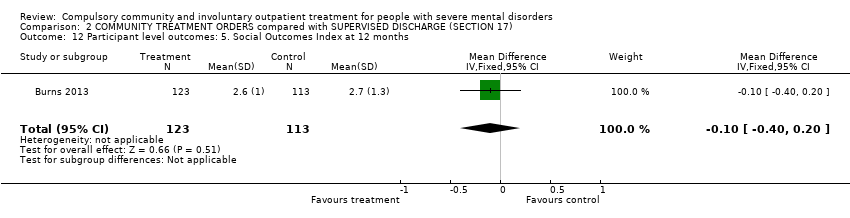
Comparison 2 COMMUNITY TREATMENT ORDERS compared with SUPERVISED DISCHARGE (SECTION 17), Outcome 12 Participant level outcomes: 5. Social Outcomes Index at 12 months.
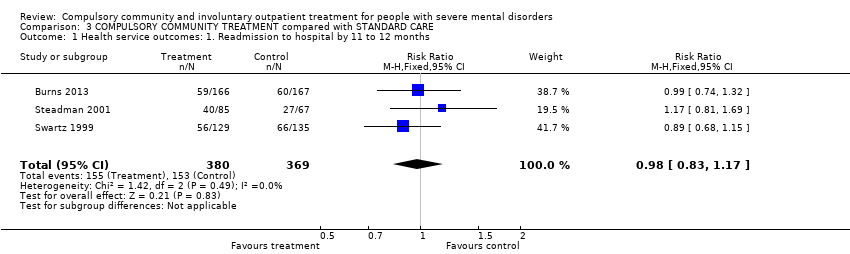
Comparison 3 COMPULSORY COMMUNITY TREATMENT compared with STANDARD CARE, Outcome 1 Health service outcomes: 1. Readmission to hospital by 11 to 12 months.
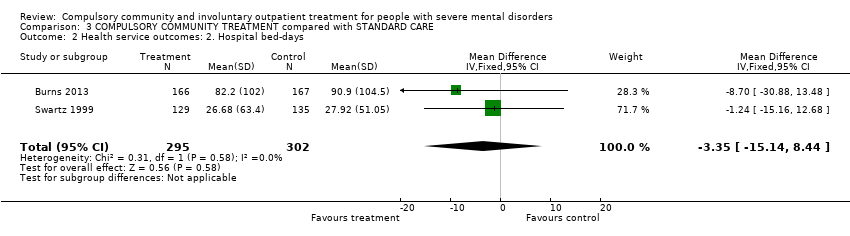
Comparison 3 COMPULSORY COMMUNITY TREATMENT compared with STANDARD CARE, Outcome 2 Health service outcomes: 2. Hospital bed‐days.
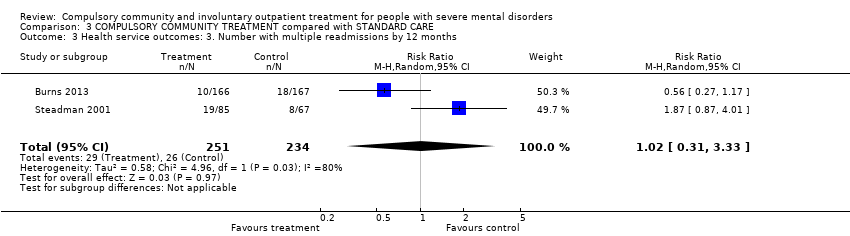
Comparison 3 COMPULSORY COMMUNITY TREATMENT compared with STANDARD CARE, Outcome 3 Health service outcomes: 3. Number with multiple readmissions by 12 months.
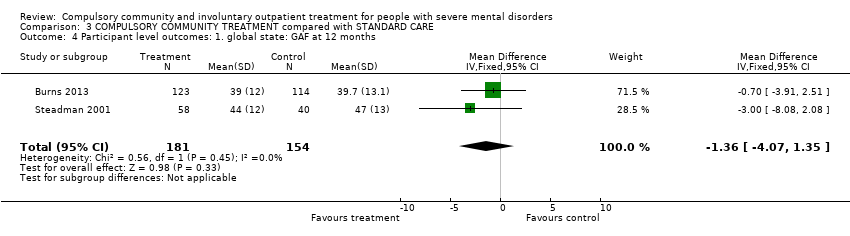
Comparison 3 COMPULSORY COMMUNITY TREATMENT compared with STANDARD CARE, Outcome 4 Participant level outcomes: 1. global state: GAF at 12 months.

Comparison 3 COMPULSORY COMMUNITY TREATMENT compared with STANDARD CARE, Outcome 5 Participant level outcomes: 2. Satisfaction with care: perceived coercion or leverage at 11 to 12 months.
| COMPULSORY COMMUNITY AND INVOLUNTARY OUTPATIENT TREATMENT FOR PEOPLE WITH SEVERE MENTAL DISORDERS | ||||||
| Patient or population: people with severe mental disorders Settings: patients in community settings Intervention: COURT ORDERED OUTPATIENT COMMITMENT Comparison: ENTIRELY VOLUNTARY CARE | ||||||
| Outcomes | Illustrative comparative risks* (95% CI) | Relative effect | No of participants | Quality of the evidence | Comments | |
| Assumed risk | Corresponding risk | |||||
| VOLUNTARY CARE | COURT ORDERED OUTPATIENT COMMITMENT | |||||
| Health service outcomes: 1. Readmission to hospital by 11 to 12 months | Study population | RR 0.98 | 416 | ⊕⊕⊝⊝ | ‐ | |
| 460 per 1000 | 451 per 1000 | |||||
| Medium risk population | ||||||
| 446 per 1000 | 437 per 1000 | |||||
| Health service outcomes: 4. Compliance with medication by 11 to 12 months | Study population | RR 0.99 | 416 | ⊕⊕⊝⊝ | ‐ | |
| 505 per 1000 | 500 per 1000 | |||||
| Medium risk population | ||||||
| 554 per 1000 | 548 per 1000 | |||||
| Participant level outcomes: 2. Social functioning: trouble with police by 11 to 12 months, at least 1 arrest | Study population | RR 0.97 | 416 | ⊕⊕⊝⊝ | ‐ | |
| 158 per 1000 | 153 per 1000 | |||||
| Medium risk population | ||||||
| 156 per 1000 | 151 per 1000 | |||||
| Participant level outcomes: 2. Social functioning: trouble with police by 11 to 12 months, ever arrested/picked up by police for violence against a person | Study population | RR 0.82 | 416 | ⊕⊕⊝⊝ | ‐ | |
| 208 per 1000 | 171 per 1000 | |||||
| Medium risk population | ||||||
| 156 per 1000 | 128 per 1000 | |||||
| Participant level outcomes: 3. Social functioning: homeless by 11 to 12 months | Study population | RR 0.67 | 416 | ⊕⊕⊝⊝ | ‐ | |
| 134 per 1000 | 90 per 1000 | |||||
| Medium risk population | ||||||
| 145 per 1000 | 97 per 1000 | |||||
| Participant level outcomes: 5. Quality of life: victimisation by 11 to 12 months | Study population | RR 0.5 | 264 | ⊕⊕⊝⊝ | ‐ | |
| 311 per 1000 | 156 per 1000 | |||||
| Medium risk population | ||||||
| 311 per 1000 | 156 per 1000 | |||||
| Participant level outcomes: 6. Satisfaction with care/adverse events: perceived coercion by 11 to 12 months | Study population | RR 1.36 | 416 | ⊕⊕⊝⊝ | ‐ | |
| 218 per 1000 | 296 per 1000 | |||||
| Medium risk population | ||||||
| 227 per 1000 | 309 per 1000 | |||||
| *The basis for the assumed risk (e.g. the median control group risk across studies) is provided in footnotes. The corresponding risk (and its 95% confidence interval) is based on the assumed risk in the comparison group and the relative effect of the intervention (and its 95% CI). | ||||||
| GRADE Working Group grades of evidence | ||||||
| 1 Allocation concealment and blinding unclear: serious risk of bias, downgraded by one level. 2 Only 2 studies, both from the USA: serious imprecision, downgraded by one level. 3 Only 1 study: serious imprecision, downgraded by one level. | ||||||
| COMPULSORY COMMUNITY AND INVOLUNTARY OUTPATIENT TREATMENT FOR PEOPLE WITH SEVERE MENTAL DISORDERS | ||||||
| Patient or population: people with severe mental disorders Settings: community Intervention: COMMUNITY TREATMENT ORDERS Comparison: SUPERVISED DISCHARGE (Section 17) | ||||||
| Outcomes | Illustrative comparative risks* (95% CI) | Relative effect | No of participants | Quality of the evidence | Comments | |
| Assumed risk | Corresponding risk | |||||
| SECTION 17 | COMMUNITY TREATMENT ORDERS | |||||
| Health service outcomes: 1. Readmission to hospital by 12 months | Study population | RR 0.99 | 333 | ⊕⊕⊕⊝ | ‐ | |
| 359 per 1000 | 356 per 1000 | |||||
| Moderate risk population | ||||||
| 359 per 1000 | 355 per 1000 | |||||
| Health service outcomes: 2. Hospital bed‐days by 12 months | ‐ | The mean health service outcomes: 2. total duration of psychiatric hospital stays over 12 months in the intervention groups was | ‐ | 333 | ⊕⊕⊕⊝ | ‐ |
| Health service outcomes: 3. Number of readmissions by 12 months | ‐ | The mean health service outcomes: 3. number of readmissions by 12 months in the intervention groups was | ‐ | 119 | ⊕⊕⊕⊝ | ‐ |
| Health service outcomes: 4. Number with multiple readmissions by 12 months | Study population | RR 0.56 | 333 | ⊕⊕⊕⊝ | ‐ | |
| 108 per 1000 | 60 per 1000 | |||||
| Moderate risk population | ||||||
| 108 per 1000 | 60 per 1000 | |||||
| Health service outcomes: 5. Days in community to first admission by 12 months | ‐ | The mean days in community to 1st admission in the intervention groups was | ‐ | 333 | ⊕⊕⊕⊝ | ‐ |
| Participant level outcomes: 1. Mental state ‐ psychiatric symptoms at 12 months (BPRS) | ‐ | The mean patierticipant level outcomes: BPRS in the intervention groups was | ‐ | 234 | ⊕⊕⊕⊝ | |
| Participant level outcomes: 3. Satisfaction with care: perceived coercion at 11 ‐ 12 months | ‐ | The mean participant level outcomes: Satisfaction with care: perceived coercion intervention groups was | ‐ | 182 | ⊕⊕⊕⊝ | |
| Other pre‐stated participant level outcomes of interest: Social functioning: trouble with police, homeless; Quality of life: victimisation; not reported | ||||||
| *The basis for the assumed risk (e.g. the median control group risk across studies) is provided in footnotes. The corresponding risk (and its 95% confidence interval) is based on the assumed risk in the comparison group and the relative effect of the intervention (and its 95% CI). | ||||||
| GRADE Working Group grades of evidence | ||||||
| 1 Forty people (25%) allocated to Section 17 were subsequently placed on a CTO during the study. 2 35 people randomised to CTOs (22%) did not actually receive the intervention. 3 No adverse events reported. | ||||||
| COMPULSORY COMMUNITY AND INVOLUNTARY OUTPATIENT TREATMENT FOR PEOPLE WITH SEVERE MENTAL DISORDERS | ||||||
| Patient or population: people with severe mental disorders Settings: community Intervention: COMPULSORY COMMUNITY TREATMENT Comparison: STANDARD CARE | ||||||
| Outcomes | Illustrative comparative risks* (95% CI) | Relative effect | No of participants | Quality of the evidence | Comments | |
| Assumed risk | Corresponding risk | |||||
| STANDARD CARE | COMPULSORY COMMUNITY TREATMENT | |||||
| Health service outcomes: 1. Readmission to hospital by 11 to 12 months | Study population | RR 0.98 | 749 | ⊕⊕⊕⊝ | ‐ | |
| 415 per 1000 | 406 per 1000 | |||||
| Moderate | ||||||
| 403 per 1000 | 395 per 1000 | |||||
| Health service outcomes: 2. Hospital bed‐days | ‐ | The mean health service outcomes: 2. hospital bed‐days in the intervention groups was | ‐ | 597 | ⊕⊕⊕⊝ | ‐ |
| Health service outcomes: 3. Number with multiple readmissions by 12 months | Study population | RR 1.0 | 485 | ⊕⊕⊕⊝ | ‐ | |
| 111 per 1000 | 111 per 1000 | |||||
| Moderate | ||||||
| 114 per 1000 | 114 per 1000 | |||||
| Participant level outcomes: 1. Global state: GAF at 12 months | ‐ | The mean participant level outcomes: global state: GAF at 12 months in the intervention groups was | ‐ | 335 | ⊕⊕⊕⊝ | |
| Participant level outcomes: 2. Satisfaction with care: perceived coercion or leverage at 11 to 12 months | Study population | RR 1.3 | 645 | ⊕⊕⊕⊝ | ‐ | |
| 212 per 1000 | 275 per 1000 | |||||
| Moderate | ||||||
| 200 per 1000 | 260 per 1000 | |||||
| Other pre‐stated participant level outcomes of interest: Social functioning: trouble with police, homeless; Quality of life: victimisation; not reported | ||||||
| *The basis for the assumed risk (e.g. the median control group risk across studies) is provided in footnotes. The corresponding risk (and its 95% confidence interval) is based on the assumed risk in the comparison group and the relative effect of the intervention (and its 95% CI). | ||||||
| GRADE Working Group grades of evidence | ||||||
| 1 Forty people (25%) allocated to Section 17 were subsequently placed on a CTO during the study. 2 35 people randomised to compulsory community treatments (22%) did not actually receive the intervention. 3 No adverse events reported. | ||||||
| Outcome or subgroup title | No. of studies | No. of participants | Statistical method | Effect size |
| 1 Health service outcomes: 1. Readmission to hospital ‐ by 11 to 12 months Show forest plot | 2 | 416 | Risk Ratio (M‐H, Fixed, 95% CI) | 0.98 [0.79, 1.21] |
| 2 Health service outcomes: 2. Hospital bed‐days Show forest plot | 1 | 264 | Mean Difference (IV, Fixed, 95% CI) | ‐1.24 [‐15.16, 12.68] |
| 3 Health service outcomes: 3. Number with multiple readmissions by 12 months Show forest plot | 1 | 152 | Risk Ratio (M‐H, Fixed, 95% CI) | 1.87 [0.87, 4.01] |
| 4 Health service outcomes: 4. Compliance with medication by 11 to 12 months Show forest plot | 2 | 416 | Risk Ratio (M‐H, Fixed, 95% CI) | 0.99 [0.83, 1.19] |
| 5 Participant level outcomes: 1. Mental state ‐ psychiatric symptoms and global state at 11 to 12 months Show forest plot | 1 | 98 | Mean Difference (IV, Fixed, 95% CI) | ‐3.0 [‐8.08, 2.08] |
| 6 Participant level outcomes: 2. Social functioning: trouble with police by 11 to 12 months Show forest plot | 2 | Risk Ratio (M‐H, Fixed, 95% CI) | Subtotals only | |
| 6.1 at least 1 arrest | 2 | 416 | Risk Ratio (M‐H, Fixed, 95% CI) | 0.97 [0.62, 1.52] |
| 6.2 ever arrested/picked up by police for violence against a person | 2 | 416 | Risk Ratio (M‐H, Fixed, 95% CI) | 0.82 [0.56, 1.21] |
| 7 Participant level outcomes: 3. Social functioning: homeless by 11 to 12 months Show forest plot | 2 | 416 | Risk Ratio (M‐H, Fixed, 95% CI) | 0.67 [0.39, 1.15] |
| 8 Participant level outcomes: 4. Quality of life: Lehman Quality of Life Scale Show forest plot | 2 | 406 | Mean Difference (IV, Random, 95% CI) | ‐0.22 [‐0.95, 0.50] |
| 9 Participant level outcomes: 5. Quality of life: victimisation by 11 to 12 months Show forest plot | 1 | 264 | Risk Ratio (M‐H, Fixed, 95% CI) | 0.50 [0.31, 0.80] |
| 10 Participant level outcomes: 6. Satisfaction with care: perceived coercion by 11 to 12 months Show forest plot | 2 | 416 | Risk Ratio (M‐H, Fixed, 95% CI) | 1.36 [0.97, 1.89] |
| Outcome or subgroup title | No. of studies | No. of participants | Statistical method | Effect size |
| 1 Health service outcomes: 1a. Readmission to hospital ‐ by 12 months Show forest plot | 1 | 333 | Risk Ratio (M‐H, Fixed, 95% CI) | 0.99 [0.74, 1.32] |
| 2 Health service outcomes. 1b. Readmission to hospital by 36 months Show forest plot | 1 | Odds Ratio (M‐H, Fixed, 95% CI) | Subtotals only | |
| 2.1 Readmission | 1 | 330 | Odds Ratio (M‐H, Fixed, 95% CI) | 0.71 [0.45, 1.11] |
| 2.2 > 1 readmission | 1 | 213 | Odds Ratio (M‐H, Fixed, 95% CI) | 1.07 [0.62, 1.85] |
| 3 Health service outcomes: 2. Hospital bed‐days by 12 months Show forest plot | 1 | 333 | Mean Difference (IV, Fixed, 95% CI) | ‐8.70 [‐30.88, 13.48] |
| 4 Health service outcomes: 3. Number of readmissions by 12 months Show forest plot | 1 | 119 | Mean Difference (IV, Fixed, 95% CI) | ‐0.20 [‐0.45, 0.05] |
| 5 Health service outcomes: 4. Number with multiple readmissions by 12 months Show forest plot | 1 | 333 | Risk Ratio (M‐H, Fixed, 95% CI) | 0.56 [0.27, 1.17] |
| 6 Health service outcomes: 5a. Days in community till first admission by 12 months Show forest plot | 1 | 333 | Mean Difference (IV, Fixed, 95% CI) | 5.0 [‐21.74, 31.74] |
| 7 Health service outcomes: 5b. Days in community till first admission and mean duration of bed‐days by 36 months Show forest plot | 1 | Mean Difference (IV, Fixed, 95% CI) | Subtotals only | |
| 7.1 Time to 1st readmission in days | 1 | 330 | Mean Difference (IV, Fixed, 95% CI) | 60.0 [‐27.62, 147.62] |
| 7.2 Mean duration of bed‐days | 1 | 212 | Mean Difference (IV, Fixed, 95% CI) | ‐15.10 [‐89.39, 59.19] |
| 8 Participant level outcomes: 1. Mental state ‐ psychiatric symptoms at 12 months (BPRS) Show forest plot | 1 | 234 | Mean Difference (IV, Fixed, 95% CI) | ‐0.10 [‐3.17, 2.97] |
| 9 Participant level outcomes: 2. Global state: GAF at 12 months Show forest plot | 1 | 237 | Mean Difference (IV, Fixed, 95% CI) | ‐0.70 [‐3.91, 2.51] |
| 10 Participant level outcomes: 3. Satisfaction with care: perceived coercion at 11 to 12 months Show forest plot | 1 | 182 | Mean Difference (IV, Fixed, 95% CI) | ‐0.5 [‐1.71, 0.71] |
| 11 Participant level outcomes: 4. Satisfaction with care: leverage at 11 to 12 months Show forest plot | 1 | 229 | Odds Ratio (M‐H, Fixed, 95% CI) | 1.23 [0.66, 2.31] |
| 12 Participant level outcomes: 5. Social Outcomes Index at 12 months Show forest plot | 1 | 236 | Mean Difference (IV, Fixed, 95% CI) | ‐0.10 [‐0.40, 0.20] |
| Outcome or subgroup title | No. of studies | No. of participants | Statistical method | Effect size |
| 1 Health service outcomes: 1. Readmission to hospital by 11 to 12 months Show forest plot | 3 | 749 | Risk Ratio (M‐H, Fixed, 95% CI) | 0.98 [0.83, 1.17] |
| 2 Health service outcomes: 2. Hospital bed‐days Show forest plot | 2 | 597 | Mean Difference (IV, Fixed, 95% CI) | ‐3.35 [‐15.14, 8.44] |
| 3 Health service outcomes: 3. Number with multiple readmissions by 12 months Show forest plot | 2 | 485 | Risk Ratio (M‐H, Random, 95% CI) | 1.02 [0.31, 3.33] |
| 4 Participant level outcomes: 1. global state: GAF at 12 months Show forest plot | 2 | 335 | Mean Difference (IV, Fixed, 95% CI) | ‐1.36 [‐4.07, 1.35] |
| 5 Participant level outcomes: 2. Satisfaction with care: perceived coercion or leverage at 11 to 12 months Show forest plot | 3 | 645 | Risk Ratio (M‐H, Fixed, 95% CI) | 1.30 [0.98, 1.71] |