Contenido relacionado
Revisiones y protocolos relacionados
Christian R Osadnik, Vanessa S Tee, Kristin V Carson‐Chahhoud, Joanna Picot, Jadwiga A Wedzicha, Brian J Smith | 13 julio 2017
Annemarie L Lee, Angela T Burge, Anne E Holland | 27 septiembre 2017
Michael Greenstone, Toby J Lasserson | 22 julio 2002
Naomi R Winfield, Nicki J Barker, Esme R Turner, Gemma L Quin | 19 octubre 2014
Rachel Knightly, Stephen J Milan, Rodney Hughes, Jennifer A Knopp‐Sihota, Brian H Rowe, Rebecca Normansell, Colin Powell | 28 noviembre 2017
Simon S Craig, Stuart R Dalziel, Colin VE Powell, Andis Graudins, Franz E Babl, Carole Lunny | 5 agosto 2020
Tim Raveling, Judith Vonk, Fransien M Struik, Roger Goldstein, Huib AM Kerstjens, Peter J Wijkstra, Marieke L Duiverman | 9 agosto 2021
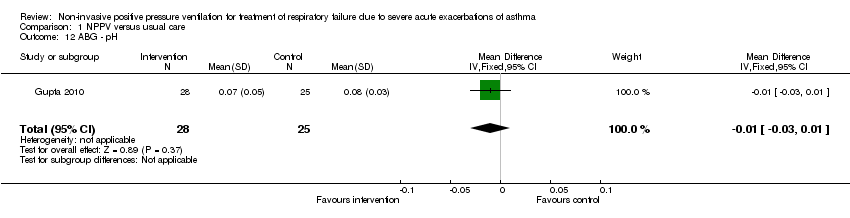
Kana R Jat, Deepak Chawla | 14 noviembre 2012
Kerry K Hall, Helen L Petsky, Anne B Chang, KerryAnn F O'Grady | 2 noviembre 2018
Elisabeth Jeppesen, Kjetil G Brurberg, Gunn E Vist, Jadwiga A Wedzicha, John J Wright, Michael Greenstone, Julia AE Walters | 16 mayo 2012