Tratamiento con toxina botulínica tipo B para la distonía cervical
Referencias
Referencias de los estudios incluidos en esta revisión
Referencias de los estudios excluidos de esta revisión
Referencias adicionales
Characteristics of studies
Characteristics of included studies [ordered by study ID]
Ir a:
| Methods | Randomised, multicentre, double‐blind, 3 arms, parallel, phase III study.Method of randomisation: master randomisation tables generated by an independent organization.Data analysed on intention‐to‐treat basis.Location: multiple centers in the USA.Duration: 16 weeks. | |
| Participants | 109 patients were enrolled.Placebo arm: 36 patients (2 withdrawals: 5.5%), 21 patients were female and 15 were male, mean age was 54.3±12.2 (sd) years, ethnicity: 32 white and 4 black, mean duration of symptoms not stated, mean TWSTRS‐Total score at baseline: 43.6±9(sd).BoNT/B 5000U arm: 36 patients (1 withdrawals: 2.7%), 18 patients were female and 18 were male, mean age was 57.6±12.3 (sd) years, ethnicity: 35 white and 1 black, mean duration of symptoms not stated, mean TWSTRS‐Total score at baseline: 46.4± 10.4 (sd).BoNT/B 10.000U arm: 37 patients (1 withdrawals: 2.7%), 28 patients were female and 9 were male, mean age was 56.2 ±11.8 (sd), ethnicity: 33 white and 4 black, mean duration of symptoms not stated, mean TWSTRS‐Total score at baseline: 46.9 ± 9.6 (sd).Inclusion criteria: Cervical Dystonia (CD) for at least 1 year with involvement of 2 or more neck muscles and responsive to BoNT/A treatment; TWSTRS‐Total score at baseline of at least 20 with at least a TWSTRS‐Severity score of at least 10, a TWRTRS‐Disability score of at least 3, and a TWSTRS‐Pain score of at least 1; Age more than 17 years‐old; Weight more than 45 Kg; Physical and neurological examinations and laboratory tests acceptable clinically; Informed consent.Exclusion criteria: BoNT injections in the previous 4 months for CD; Previous participation in BoNT/B trial; Neck contractures or cervical spine disease; Pure retrocollis or anterocollis; Use of drugs that could interfere with efficacy and security evaluations (e.g., narcotics, benzodiazepines); Acute or chronic medical condition or known drug hypersensitivity to the study drug; History of myotomy or denervation surgery of the neck; Previous tetanus toxoid in the last 4 months; History of clinically persistent neurological or neuromuscular disorder; and women of child‐bearing potential who were pregnant or breast‐feeding. | |
| Interventions | The study drug (BoNT/B) was provided by Athenas Neurociences, Inc in vials that contained placebo or 5000U in a 1 ml sterile solution, buffered to a pH of 5.5, and refrigerated. Each patient was randomly assigned to one of the 3 groups: placebo, 5000U of BoNT/B or 10,000U BoNT/B. A total of 2 ml of the study drug was injected into 2 to 4 involved CD muscles selected by the investigator criteria with or without the use of electromyography. Based on the investigator judgement, the proportionate volume per muscle was divided and injected into one to five sites. Each patient received only one treatment. | |
| Outcomes | The primary efficacy outcome was the change in TWSTRS‐Total score at week 4. Secondary efficacy outcomes included changes in 2 visual analog scales (Patient Global Assessment of Change and Principal investigator Global Assessment of Change) at week 4, and change in TWRTRS‐Total score at week 8 and 12. Tertiary efficacy outcomes included change in visual analog scale Patient Analog Pain Assessment at week 4, and changes in the TWRTRS subscales scores at week 4 and 16.For all outcomes data were collected at treatment visit (day 1), and at weeks 2, 4, 8, 12, and 16 (termination).Adverse events data were collected at each visit. | |
| Notes | Reasons for withdrawal: in the placebo group 1 discontinued the study because of lack of effect and 1 patient due to request related with a new job; in the 5000U group 1 patient discontinued because of lack of effect; in the 10.000U group 1 patient discontinued because of a serious adverse effect (death following coronary artery bypass surgery).Results are presented as variance of the means of the various outcome scales scores without individual data.An estimation of duration of treatment effect was made based on time to return to baseline TWRTRS‐Total score. | |
| Risk of bias | ||
| Bias | Authors' judgement | Support for judgement |
| Allocation concealment? | Low risk | A ‐ Adequate |
| Methods | Randomised, multicenter, placebo‐controlled, double‐blind, 2 arm, parallel, phase III study.Method of randomisation: master randomisation tables generated by an independent organization.Data analysed on an intention‐to‐treat basis.Location: seven centers in the USA.Duration: 16 weeks. | |
| Participants | 77 patients were enrolled.Placebo arm: 38 patients (1 withdrawals: 2.6%); 26 patients were female and 12 were male; mean age was 52.6±13.3 (sd) years; ethnicity: all patients were Caucasian; mean duration of symptoms not stated; mean TWSTRS‐Total score at baseline: 51.2±9.5 (sd).BoNT/B 10.000U arm: 39 patients (0 withdrawals); 27 patients were female and 12 were male; mean age was 56.6 ±11.7 (sd); ethnicity: all patients were Caucasian; mean duration of symptoms not stated; mean TWSTRS‐Total score at baseline: 52.8 ± 8.6 (sd).Inclusion criteria: Cervical Dystonia (CD) for at least 1 year of duration with involvement of 2 or more neck muscles, and considered clinically resistant to BoNT/A treatment with an appropriate frontalis‐type A test result; TWSTRS‐Total score at baseline of at least 20 with at least a TWSTRS‐Severity score of at least 10, a TWRTRS‐Disability score of of at least 3, and a TWSTRS‐Pain score of at least 1; Age more than 17 years‐old; Weight more than 45 Kg; Physical and neurological examinations and laboratory tests acceptable clinically; Informed consent.Exclusion criteria: BoNT injections in the previous 4 months for CD; previous participation in a BoNT/B trial; Neck contractures or cervical spine disease that limit range of motion; Pure retrocollis or anterocollis; Use of drugs that could interfere with efficacy and security evaluations (e.g., narcotics, benzodiazepines); Previous tetanus toxoid in the last 4 months; Use of any investigational drug or device within 30 days of entry into the study; Current acute or chronic medical condition or known drug hypersensitivity to the study drug that would preclude BoNT injections; History of myotomy or denervation surgery of the neck; History of clinically persistent neurological or neuromuscular disorder; and women of child‐bearing potential who were pregnant or breast‐feeding. | |
| Interventions | The study drug (BoNT/B) was provided by Athenas Neurociences, Inc in vials that contained placebo or 5000U of BoNT/B in a 1 ml sterile solution. Each patient was randomly assigned to one of the 2 groups: placebo or 10,000U BoNT/B. A total of 2 ml of the study drug was injected into 2 to 4 involved CD muscles selected by the investigator criteria with or without the use of electromyography. Based on the investigator judgement, the proportionate volume per muscle was divided and injected into one to five sites. Each patient received only one treatment. | |
| Outcomes | The primary efficacy outcome was the change in TWSTRS‐Total score at week 4. Secondary efficacy outcomes included changes in 2 visual analog scales (Patient Global Assessment of Change and Principal investigator Global Assessment of Change) at week 4, and change in TWRTRS‐Total score at week 8 and 12. Tertiary efficacy outcomes included change in visual analog scale Patient Analog Pain Assessment at week 4, changes in the TWRTRS subscales scores at week 4, and change in TWRTRS‐Total score at week 16.All outcomes data were collected at treatment visit (day 1), and at weeks 2, 4, 8, 12, and 16 (termination). The results of the primary outcome were used to assess the duration of clinical benefit.Adverse events data were collected at each visit. | |
| Notes | Reasons for withdrawal: in the placebo group 1 discontinued the study because of an adverse effect. Results are presented as variance of the means of the various outcome scales scores without individual data.An estimation of duration of treatment effect was made based on time to return to baseline TWRTRS‐Total score. | |
| Risk of bias | ||
| Bias | Authors' judgement | Support for judgement |
| Allocation concealment? | Low risk | A ‐ Adequate |
| Methods | Randomised, multicenter, placebo‐controlled, double‐blind, 4 arm, parallel, phase II study.Method of randomisation: not described.Data analysed on an intention‐to‐treat basis.Location: multiple centers in the USA.Duration: 16 weeks. | |
| Participants | 122 patients age 19 to 81 years were enrolled. 67% of the patients were female. 97% were Caucasian, 1.6% were Hispanic and 1.6% were Afro‐American. 79% were responsive to BoNT/A treatment and 21% were BoNt/A resistant.Placebo arm: 30 patients, mean duration of symptoms not stated, mean TWSTRS‐Total score was 45.5.BoNT/B 2500U arm: 31 patients, mean duration of symptoms not stated, mean TWSTRS‐Total score at baseline was 45.6.BoNT/B 5000U arm: 31 patients, mean duration of symptoms not stated, mean TWSTRS‐Total score at baseline was 45.2.BoNT/B 10,000U arm: 30 patients, mean duration of symptoms not stated, mean TWSTRS‐Total score at baseline was 47.5.Inclusion criteria: Idiopathic Cervical Dystonia (CD) of 1 to 10 years duration with involvement of 2 or more neck muscles, either responsive or resistance to BoNT/A treatment; TWSTRS‐Total score at baseline of at least 20 with at least a TWSTRS‐Severity score of at least 10, a TWRTRS‐Disability score of of at least 3, and a TWSTRS‐Pain score of at least 1; Age more than 17 years‐old; Weight more than 45 Kg; Physical and neurological examinations and laboratory tests acceptable clinically; Informed consent.Exclusion criteria: Primary nonresponder to BoNT/A injection; BoNT injections in the previous 4 months for CD; No return to intertreatment baseline clinical dystonia status; Neck contractures or cervical spine disease that limit range of motion; Pure retrocollis or anterocollis; Use of drugs that could interfere with efficacy and security evaluations (e.g., narcotics, benzodiazepines); Use of aminoglycosides or any investigational drug or device within 30 days of entry into the study; Current acute or chronic medical condition or known drug hypersensitivity to the study drug that would preclude BoNT injections; History of myotomy or denervation surgery of the neck; History of clinically persistent neurological or neuromuscular disorder; and women pregnant or nursing. | |
| Interventions | The study drug (BoNT/B) was provided by Athenas Neurociences, Inc in vials that contained placebo, 2500U or 5000U of BoNT/B in a 1 ml sterile solution. Each patient was randomly assigned to one of the 4 groups: placebo, 2500U, 5000U or 10,000U BoNT/B. A total of 2 ml of the study drug was injected into 2 to 4 involved CD muscles selected by the investigator criteria with or without the use of electromyography. The study drug (in a volume of 2 ml) could be further diluted by adding 0.9% sterile normal saline without preservative up to a maximal final volume of 5 ml. Each patient received only one treatment. | |
| Outcomes | The primary efficacy outcome was the change in TWSTRS‐Total score at week 4. Secondary efficacy outcomes included changes in 3 visual analog scales (Patient Global Assessment of Change, Patient Analog Pain Assessment, and Principal investigator Global Assessment of Change) at week 4, changes in the TWRTRS subscales scores at week 4, change in TWRTRS‐Total score at week 8, 12 and 16, and change in Sickness Impact Profile (SIP) at week 4.With the exception of SIP all outcomes data were collected at treatment visit (day 1), and at weeks 2, 4, 8, 12, and 16 (termination). The results of the primary outcome were used to assess the duration of clinical benefit.Adverse events data were collected through spontaneously report and investigator‐elicited at each visit.BoNT/B antibodies were determined by ELISA at baseline and week 4. | |
| Notes | All patients completed the study per the protocol. | |
| Risk of bias | ||
| Bias | Authors' judgement | Support for judgement |
| Allocation concealment? | Low risk | A ‐ Adequate |
Characteristics of excluded studies [ordered by study ID]
Ir a:
| Study | Reason for exclusion |
| This is a randomised, multicentre (USA), double‐blind, placebo‐controlled, single dose, 4‐arm, dose‐finding parallel group design study. The follow‐up was 16 weeks. 85 patients were enrolled. Mean age was 53.2 years (18‐80). 38% of the patients were male and 62% were female. 95% were of white ethnicity. The study included both BNT/A responsive and resistant patients. The study drug (BoNT/B) was provided by Athenas Neurociences, Inc. Each patient was randomly assigned to one of the 4 groups: placebo, 400U, 1200U or 2400U of BoNT/B. the study drug was injected into 2 to 4 superficial neck and/or shoulder muscle groups. Each patient received only one treatment. The primary efficacy outcome was the change in TWSTRS‐Total score (range 0 to 87). One patient in the placebo group withdrew because of an adverse effect.This study was excluded because data was not available. | |
| 145 patients were enrolled. The study was open‐label and compared 3 different doses of BNT/B without a placebo group. | |
| 12 patients were enrolled. The study was open‐label and compared different doses of BNT/B without a placebo group. |
Data and analyses
| Outcome or subgroup title | No. of studies | No. of participants | Statistical method | Effect size |
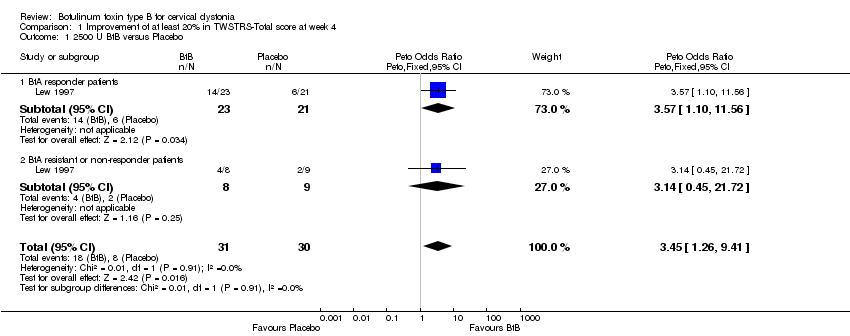
| 1 2500 U BtB versus Placebo Show forest plot | 1 | 61 | Peto Odds Ratio (Peto, Fixed, 95% CI) | 3.45 [1.26, 9.41] |
| Analysis 1.1  Comparison 1 Improvement of at least 20% in TWSTRS‐Total score at week 4, Outcome 1 2500 U BtB versus Placebo. | ||||
| 1.1 BtA responder patients | 1 | 44 | Peto Odds Ratio (Peto, Fixed, 95% CI) | 3.57 [1.10, 11.56] |
| 1.2 BtA resistant or non‐responder patients | 1 | 17 | Peto Odds Ratio (Peto, Fixed, 95% CI) | 3.14 [0.45, 21.72] |
| 2 5000 U BtB versus Placebo Show forest plot | 1 | 61 | Peto Odds Ratio (Peto, Fixed, 95% CI) | 4.03 [1.48, 10.97] |
| Analysis 1.2  Comparison 1 Improvement of at least 20% in TWSTRS‐Total score at week 4, Outcome 2 5000 U BtB versus Placebo. | ||||
| 2.1 BtA responder patients | 1 | 46 | Peto Odds Ratio (Peto, Fixed, 95% CI) | 2.98 [0.94, 9.48] |
| 2.2 BtA resistant or non‐responder patients | 1 | 15 | Peto Odds Ratio (Peto, Fixed, 95% CI) | 9.89 [1.34, 73.12] |
| 3 10,000 U BtB versus Placebo Show forest plot | 1 | 60 | Peto Odds Ratio (Peto, Fixed, 95% CI) | 6.93 [2.55, 18.83] |
| Analysis 1.3  Comparison 1 Improvement of at least 20% in TWSTRS‐Total score at week 4, Outcome 3 10,000 U BtB versus Placebo. | ||||
| 3.1 BtA responder patients | 1 | 40 | Peto Odds Ratio (Peto, Fixed, 95% CI) | 5.81 [1.71, 19.79] |
| 3.2 BtA resistant or non‐responder patients | 1 | 20 | Peto Odds Ratio (Peto, Fixed, 95% CI) | 9.85 [1.75, 55.34] |
| 4 BtB (2500‐10,000U) versus Placebo Show forest plot | 1 | 122 | Peto Odds Ratio (Peto, Fixed, 95% CI) | 4.69 [2.06, 10.69] |
| Analysis 1.4  Comparison 1 Improvement of at least 20% in TWSTRS‐Total score at week 4, Outcome 4 BtB (2500‐10,000U) versus Placebo. | ||||
| 4.1 BtA responder patients | 1 | 88 | Peto Odds Ratio (Peto, Fixed, 95% CI) | 3.90 [1.46, 10.37] |
| 4.2 BtA resistant or non‐responder patients | 1 | 34 | Peto Odds Ratio (Peto, Fixed, 95% CI) | 7.35 [1.60, 33.78] |
| 5 BtB (2500‐5000 U) versus BNT/B (10,000 U) Show forest plot | 1 | 92 | Peto Odds Ratio (Peto, Fixed, 95% CI) | 0.50 [0.20, 1.25] |
| Analysis 1.5  Comparison 1 Improvement of at least 20% in TWSTRS‐Total score at week 4, Outcome 5 BtB (2500‐5000 U) versus BNT/B (10,000 U). | ||||
| 5.1 BtA responder patients | 1 | 67 | Peto Odds Ratio (Peto, Fixed, 95% CI) | 0.52 [0.18, 1.56] |
| 5.2 BtA resistant or non‐responder patients | 1 | 25 | Peto Odds Ratio (Peto, Fixed, 95% CI) | 0.43 [0.08, 2.43] |
| Outcome or subgroup title | No. of studies | No. of participants | Statistical method | Effect size |
| 1 2500 U BtB versus Placebo Show forest plot | 1 | 61 | Peto Odds Ratio (Peto, Fixed, 95% CI) | 2.60 [0.84, 8.07] |
| Analysis 2.1  Comparison 2 Improvement of at least 20% in TWSTRS‐Total score at week 8, Outcome 1 2500 U BtB versus Placebo. | ||||
| 2 5000 U BtB versus Placebo Show forest plot | 1 | 61 | Peto Odds Ratio (Peto, Fixed, 95% CI) | 3.30 [1.11, 9.84] |
| Analysis 2.2  Comparison 2 Improvement of at least 20% in TWSTRS‐Total score at week 8, Outcome 2 5000 U BtB versus Placebo. | ||||
| 3 10,000 U BtB versus Placebo Show forest plot | 1 | 60 | Peto Odds Ratio (Peto, Fixed, 95% CI) | 4.88 [1.70, 13.97] |
| Analysis 2.3  Comparison 2 Improvement of at least 20% in TWSTRS‐Total score at week 8, Outcome 3 10,000 U BtB versus Placebo. | ||||
| 4 BtB (2500‐10,000 U) versus Placebo Show forest plot | 1 | 122 | Peto Odds Ratio (Peto, Fixed, 95% CI) | 3.13 [1.34, 7.34] |
| Analysis 2.4  Comparison 2 Improvement of at least 20% in TWSTRS‐Total score at week 8, Outcome 4 BtB (2500‐10,000 U) versus Placebo. | ||||
| 5 BtB (2500‐5000 U) versus BtB (10,000 U) Show forest plot | 1 | 92 | Peto Odds Ratio (Peto, Fixed, 95% CI) | 0.56 [0.23, 1.33] |
| Analysis 2.5  Comparison 2 Improvement of at least 20% in TWSTRS‐Total score at week 8, Outcome 5 BtB (2500‐5000 U) versus BtB (10,000 U). | ||||
| Outcome or subgroup title | No. of studies | No. of participants | Statistical method | Effect size |
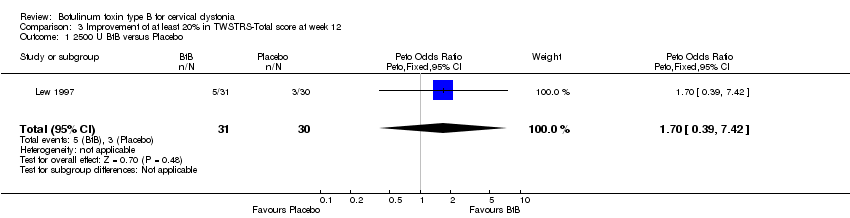
| 1 2500 U BtB versus Placebo Show forest plot | 1 | 61 | Peto Odds Ratio (Peto, Fixed, 95% CI) | 1.70 [0.39, 7.42] |
| Analysis 3.1  Comparison 3 Improvement of at least 20% in TWSTRS‐Total score at week 12, Outcome 1 2500 U BtB versus Placebo. | ||||
| 2 5000 U BtB versus Placebo Show forest plot | 1 | 61 | Peto Odds Ratio (Peto, Fixed, 95% CI) | 3.27 [0.93, 11.44] |
| Analysis 3.2  Comparison 3 Improvement of at least 20% in TWSTRS‐Total score at week 12, Outcome 2 5000 U BtB versus Placebo. | ||||
| 3 10,000 U BtB vs Placebo Show forest plot | 1 | 60 | Peto Odds Ratio (Peto, Fixed, 95% CI) | 3.42 [0.97, 11.99] |
| Analysis 3.3  Comparison 3 Improvement of at least 20% in TWSTRS‐Total score at week 12, Outcome 3 10,000 U BtB vs Placebo. | ||||
| 4 BtB (2500‐10,000U) versus Placebo Show forest plot | 1 | 122 | Peto Odds Ratio (Peto, Fixed, 95% CI) | 2.43 [0.89, 6.61] |
| Analysis 3.4  Comparison 3 Improvement of at least 20% in TWSTRS‐Total score at week 12, Outcome 4 BtB (2500‐10,000U) versus Placebo. | ||||
| 5 BtB (2500‐5000 U) versus BtB (10,000 U) Show forest plot | 1 | 92 | Peto Odds Ratio (Peto, Fixed, 95% CI) | 0.68 [0.25, 1.84] |
| Analysis 3.5  Comparison 3 Improvement of at least 20% in TWSTRS‐Total score at week 12, Outcome 5 BtB (2500‐5000 U) versus BtB (10,000 U). | ||||
| Outcome or subgroup title | No. of studies | No. of participants | Statistical method | Effect size |
| 1 2500 U BtB versus Placebo Show forest plot | 1 | 61 | Peto Odds Ratio (Peto, Fixed, 95% CI) | 0.48 [0.05, 4.85] |
| Analysis 4.1  Comparison 4 Improvement of at least 20% in TWSTRS‐Total score at week 16, Outcome 1 2500 U BtB versus Placebo. | ||||
| 2 5000 U BtB versus Placebo Show forest plot | 1 | 61 | Peto Odds Ratio (Peto, Fixed, 95% CI) | 2.99 [0.68, 13.07] |
| Analysis 4.2  Comparison 4 Improvement of at least 20% in TWSTRS‐Total score at week 16, Outcome 2 5000 U BtB versus Placebo. | ||||
| 3 10,000 U BtB versus Placebo Show forest plot | 1 | 60 | Peto Odds Ratio (Peto, Fixed, 95% CI) | 2.60 [0.54, 12.40] |
| Analysis 4.3  Comparison 4 Improvement of at least 20% in TWSTRS‐Total score at week 16, Outcome 3 10,000 U BtB versus Placebo. | ||||
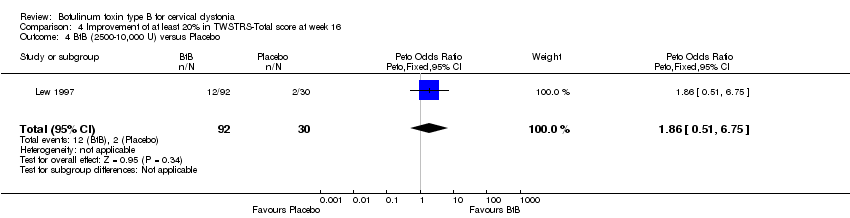
| 4 BtB (2500‐10,000 U) versus Placebo Show forest plot | 1 | 122 | Peto Odds Ratio (Peto, Fixed, 95% CI) | 1.86 [0.51, 6.75] |
| Analysis 4.4  Comparison 4 Improvement of at least 20% in TWSTRS‐Total score at week 16, Outcome 4 BtB (2500‐10,000 U) versus Placebo. | ||||
| 5 BtB (2500‐5000 U) versus BtB (10,000 U) Show forest plot | 1 | 92 | Peto Odds Ratio (Peto, Fixed, 95% CI) | 0.63 [0.17, 2.27] |
| Analysis 4.5  Comparison 4 Improvement of at least 20% in TWSTRS‐Total score at week 16, Outcome 5 BtB (2500‐5000 U) versus BtB (10,000 U). | ||||
| Outcome or subgroup title | No. of studies | No. of participants | Statistical method | Effect size |
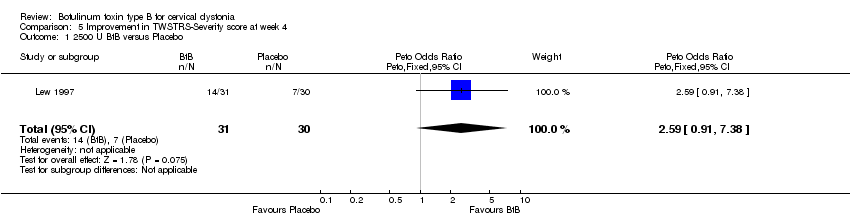
| 1 2500 U BtB versus Placebo Show forest plot | 1 | 61 | Peto Odds Ratio (Peto, Fixed, 95% CI) | 2.59 [0.91, 7.38] |
| Analysis 5.1  Comparison 5 Improvement in TWSTRS‐Severity score at week 4, Outcome 1 2500 U BtB versus Placebo. | ||||
| 2 5000 U BtB versus Placebo Show forest plot | 1 | 61 | Peto Odds Ratio (Peto, Fixed, 95% CI) | 4.60 [1.68, 12.60] |
| Analysis 5.2  Comparison 5 Improvement in TWSTRS‐Severity score at week 4, Outcome 2 5000 U BtB versus Placebo. | ||||
| 3 10,000 U BtB versus Placebo Show forest plot | 1 | 60 | Peto Odds Ratio (Peto, Fixed, 95% CI) | 3.09 [1.09, 8.76] |
| Analysis 5.3  Comparison 5 Improvement in TWSTRS‐Severity score at week 4, Outcome 3 10,000 U BtB versus Placebo. | ||||
| 4 BtB (2500‐10,000 U) versus Placebo Show forest plot | 1 | 122 | Peto Odds Ratio (Peto, Fixed, 95% CI) | 3.18 [1.39, 7.24] |
| Analysis 5.4  Comparison 5 Improvement in TWSTRS‐Severity score at week 4, Outcome 4 BtB (2500‐10,000 U) versus Placebo. | ||||
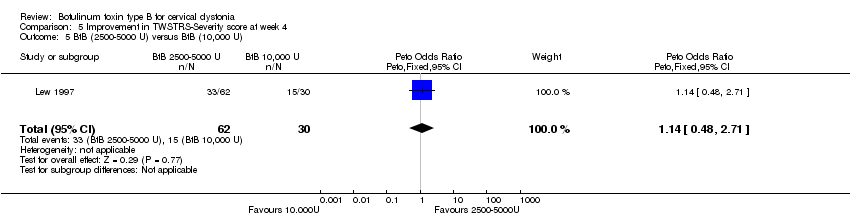
| 5 BtB (2500‐5000 U) versus BtB (10,000 U) Show forest plot | 1 | 92 | Peto Odds Ratio (Peto, Fixed, 95% CI) | 1.14 [0.48, 2.71] |
| Analysis 5.5  Comparison 5 Improvement in TWSTRS‐Severity score at week 4, Outcome 5 BtB (2500‐5000 U) versus BtB (10,000 U). | ||||
| Outcome or subgroup title | No. of studies | No. of participants | Statistical method | Effect size |
| 1 2500 U BtB versus Placebo Show forest plot | 1 | 61 | Peto Odds Ratio (Peto, Fixed, 95% CI) | 4.30 [1.54, 12.01] |
| Analysis 6.1  Comparison 6 Improvement in TWSTRS‐Disability score at week 4, Outcome 1 2500 U BtB versus Placebo. | ||||
| 2 5000 U BtB versuss Placebo Show forest plot | 1 | 61 | Peto Odds Ratio (Peto, Fixed, 95% CI) | 3.07 [1.06, 8.88] |
| Analysis 6.2  Comparison 6 Improvement in TWSTRS‐Disability score at week 4, Outcome 2 5000 U BtB versuss Placebo. | ||||
| 3 10,000 U BtB versus Placebo Show forest plot | 1 | 60 | Peto Odds Ratio (Peto, Fixed, 95% CI) | 6.48 [2.35, 17.84] |
| Analysis 6.3  Comparison 6 Improvement in TWSTRS‐Disability score at week 4, Outcome 3 10,000 U BtB versus Placebo. | ||||
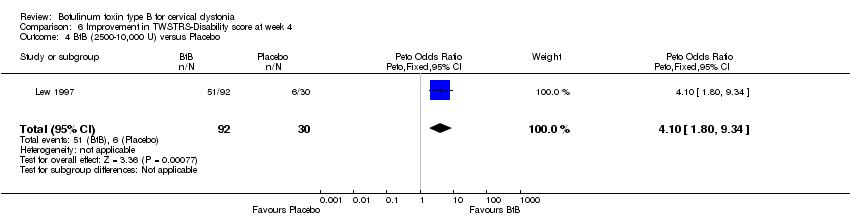
| 4 BtB (2500‐10,000 U) versus Placebo Show forest plot | 1 | 122 | Peto Odds Ratio (Peto, Fixed, 95% CI) | 4.10 [1.80, 9.34] |
| Analysis 6.4  Comparison 6 Improvement in TWSTRS‐Disability score at week 4, Outcome 4 BtB (2500‐10,000 U) versus Placebo. | ||||
| 5 BtB (2500‐5000 U) versus BtB (10,000 U) Show forest plot | 1 | 92 | Peto Odds Ratio (Peto, Fixed, 95% CI) | 0.51 [0.21, 1.23] |
| Analysis 6.5  Comparison 6 Improvement in TWSTRS‐Disability score at week 4, Outcome 5 BtB (2500‐5000 U) versus BtB (10,000 U). | ||||
| Outcome or subgroup title | No. of studies | No. of participants | Statistical method | Effect size |
| 1 2500 U BtB versus Placebo Show forest plot | 1 | 61 | Peto Odds Ratio (Peto, Fixed, 95% CI) | 2.31 [0.85, 6.26] |
| Analysis 7.1  Comparison 7 Improvement in TWSTRS‐Pain score at week 4, Outcome 1 2500 U BtB versus Placebo. | ||||
| 2 5000 U BtB versus Placebo Show forest plot | 1 | 61 | Peto Odds Ratio (Peto, Fixed, 95% CI) | 2.63 [0.97, 7.13] |
| Analysis 7.2  Comparison 7 Improvement in TWSTRS‐Pain score at week 4, Outcome 2 5000 U BtB versus Placebo. | ||||
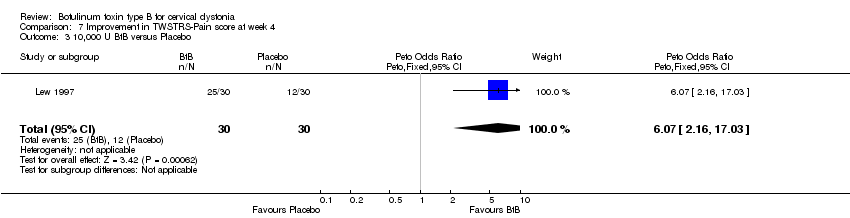
| 3 10,000 U BtB versus Placebo Show forest plot | 1 | 60 | Peto Odds Ratio (Peto, Fixed, 95% CI) | 6.07 [2.16, 17.03] |
| Analysis 7.3  Comparison 7 Improvement in TWSTRS‐Pain score at week 4, Outcome 3 10,000 U BtB versus Placebo. | ||||
| 4 BtB (2500‐10,000U) versus Placebo Show forest plot | 1 | 122 | Peto Odds Ratio (Peto, Fixed, 95% CI) | 3.48 [1.49, 8.13] |
| Analysis 7.4  Comparison 7 Improvement in TWSTRS‐Pain score at week 4, Outcome 4 BtB (2500‐10,000U) versus Placebo. | ||||
| 5 BtB (2500‐5000 U) versus BtB (10,000 U) Show forest plot | 1 | 92 | Peto Odds Ratio (Peto, Fixed, 95% CI) | 0.39 [0.15, 0.99] |
| Analysis 7.5  Comparison 7 Improvement in TWSTRS‐Pain score at week 4, Outcome 5 BtB (2500‐5000 U) versus BtB (10,000 U). | ||||
| Outcome or subgroup title | No. of studies | No. of participants | Statistical method | Effect size |
| 1 10,000U BtB versus Placebo Show forest plot | 2 | 150 | Mean Difference (IV, Fixed, 95% CI) | ‐5.92 [‐9.61, ‐2.23] |
| Analysis 8.1  Comparison 8 TWSTRS‐Total score at week 4, Outcome 1 10,000U BtB versus Placebo. | ||||
| 1.1 BtA resistant patients | 1 | 77 | Mean Difference (IV, Fixed, 95% CI) | ‐7.40 [‐12.38, ‐2.42] |
| 1.2 BtA responder patients | 1 | 73 | Mean Difference (IV, Fixed, 95% CI) | ‐4.10 [‐9.61, 1.41] |
| 2 5000 U BtB versus Placebo Show forest plot | 1 | 72 | Mean Difference (IV, Fixed, 95% CI) | ‐2.20 [‐8.44, 4.04] |
| Analysis 8.2  Comparison 8 TWSTRS‐Total score at week 4, Outcome 2 5000 U BtB versus Placebo. | ||||
| 2.1 BtA responder patients | 1 | 72 | Mean Difference (IV, Fixed, 95% CI) | ‐2.20 [‐8.44, 4.04] |
| 3 10,000U BtB versus 5000 U BoNT/B Show forest plot | 1 | 73 | Mean Difference (IV, Fixed, 95% CI) | ‐1.90 [‐8.23, 4.43] |
| Analysis 8.3  Comparison 8 TWSTRS‐Total score at week 4, Outcome 3 10,000U BtB versus 5000 U BoNT/B. | ||||
| 3.1 BtA responder patients | 1 | 73 | Mean Difference (IV, Fixed, 95% CI) | ‐1.90 [‐8.23, 4.43] |
| Outcome or subgroup title | No. of studies | No. of participants | Statistical method | Effect size |
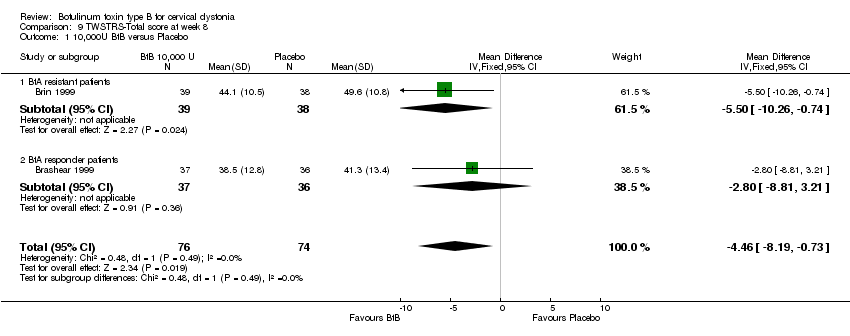
| 1 10,000U BtB versus Placebo Show forest plot | 2 | 150 | Mean Difference (IV, Fixed, 95% CI) | ‐4.46 [‐8.19, ‐0.73] |
| Analysis 9.1  Comparison 9 TWSTRS‐Total score at week 8, Outcome 1 10,000U BtB versus Placebo. | ||||
| 1.1 BtA resistant patients | 1 | 77 | Mean Difference (IV, Fixed, 95% CI) | ‐5.5 [‐10.26, ‐0.74] |
| 1.2 BtA responder patients | 1 | 73 | Mean Difference (IV, Fixed, 95% CI) | ‐2.80 [‐8.81, 3.21] |
| 2 5000 U BtB versus Placebo Show forest plot | 1 | 72 | Mean Difference (IV, Fixed, 95% CI) | ‐1.90 [‐8.30, 4.50] |
| Analysis 9.2  Comparison 9 TWSTRS‐Total score at week 8, Outcome 2 5000 U BtB versus Placebo. | ||||
| 2.1 BtA responder patients | 1 | 72 | Mean Difference (IV, Fixed, 95% CI) | ‐1.90 [‐8.30, 4.50] |
| 3 10,000 U BtB versus 5000 U BtB Show forest plot | 1 | 73 | Mean Difference (IV, Fixed, 95% CI) | ‐0.90 [‐7.13, 5.33] |
| Analysis 9.3  Comparison 9 TWSTRS‐Total score at week 8, Outcome 3 10,000 U BtB versus 5000 U BtB. | ||||
| 3.1 BtA responder patients | 1 | 73 | Mean Difference (IV, Fixed, 95% CI) | ‐0.90 [‐7.13, 5.33] |
| Outcome or subgroup title | No. of studies | No. of participants | Statistical method | Effect size |
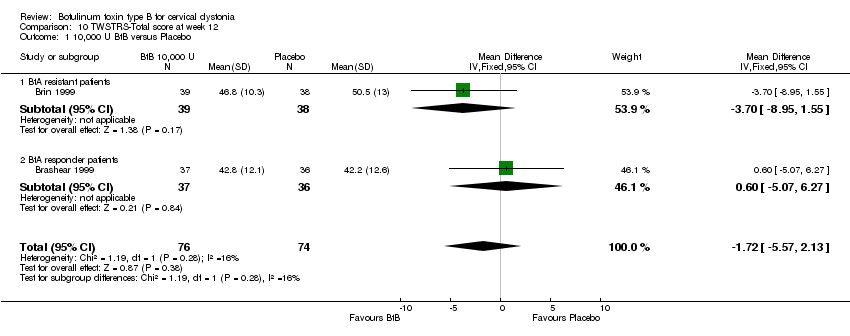
| 1 10,000 U BtB versus Placebo Show forest plot | 2 | 150 | Mean Difference (IV, Fixed, 95% CI) | ‐1.72 [‐5.57, 2.13] |
| Analysis 10.1  Comparison 10 TWSTRS‐Total score at week 12, Outcome 1 10,000 U BtB versus Placebo. | ||||
| 1.1 BtA resistant patients | 1 | 77 | Mean Difference (IV, Fixed, 95% CI) | ‐3.70 [‐8.95, 1.55] |
| 1.2 BtA responder patients | 1 | 73 | Mean Difference (IV, Fixed, 95% CI) | 0.60 [‐5.07, 6.27] |
| 2 5000 U BtB versus Placebo Show forest plot | 1 | 72 | Mean Difference (IV, Fixed, 95% CI) | 0.70 [‐5.10, 6.50] |
| Analysis 10.2  Comparison 10 TWSTRS‐Total score at week 12, Outcome 2 5000 U BtB versus Placebo. | ||||
| 2.1 BtA responder patients | 1 | 72 | Mean Difference (IV, Fixed, 95% CI) | 0.70 [‐5.10, 6.50] |
| 3 10,000U BtB versus 5000 U BtB Show forest plot | 1 | 73 | Mean Difference (IV, Fixed, 95% CI) | ‐0.10 [‐5.75, 5.55] |
| Analysis 10.3  Comparison 10 TWSTRS‐Total score at week 12, Outcome 3 10,000U BtB versus 5000 U BtB. | ||||
| 3.1 BtA responder patients | 1 | 73 | Mean Difference (IV, Fixed, 95% CI) | ‐0.10 [‐5.75, 5.55] |
| Outcome or subgroup title | No. of studies | No. of participants | Statistical method | Effect size |
| 1 10,000U BtB versus Placebo Show forest plot | 2 | 150 | Mean Difference (IV, Fixed, 95% CI) | 1.54 [‐2.21, 5.30] |
| Analysis 11.1  Comparison 11 TWSTRS‐Total score at week 16, Outcome 1 10,000U BtB versus Placebo. | ||||
| 1.1 BtA resistant patients | 1 | 77 | Mean Difference (IV, Fixed, 95% CI) | ‐1.30 [‐6.40, 3.80] |
| 1.2 BtA responder patients | 1 | 73 | Mean Difference (IV, Fixed, 95% CI) | 4.90 [‐0.65, 10.45] |
| 2 5000 U BtB versus Placebo Show forest plot | 1 | 72 | Mean Difference (IV, Fixed, 95% CI) | 2.20 [‐3.77, 8.17] |
| Analysis 11.2  Comparison 11 TWSTRS‐Total score at week 16, Outcome 2 5000 U BtB versus Placebo. | ||||
| 2.1 BtA responder patients | 1 | 72 | Mean Difference (IV, Fixed, 95% CI) | 2.20 [‐3.77, 8.17] |
| 3 10,000 U BtB versus 5000 U BtB Show forest plot | 1 | 73 | Mean Difference (IV, Fixed, 95% CI) | 2.80 [‐2.39, 7.99] |
| Analysis 11.3  Comparison 11 TWSTRS‐Total score at week 16, Outcome 3 10,000 U BtB versus 5000 U BtB. | ||||
| 3.1 BtA responder patients | 1 | 73 | Mean Difference (IV, Fixed, 95% CI) | 2.80 [‐2.39, 7.99] |
| Outcome or subgroup title | No. of studies | No. of participants | Statistical method | Effect size |
| 1 10,000 U BtB versus Placebo Show forest plot | 1 | 77 | Mean Difference (IV, Fixed, 95% CI) | ‐2.10 [‐4.39, 0.19] |
| Analysis 12.1  Comparison 12 TWSTRS‐Severity score at week 4, Outcome 1 10,000 U BtB versus Placebo. | ||||
| 1.1 BtA resistant patients | 1 | 77 | Mean Difference (IV, Fixed, 95% CI) | ‐2.10 [‐4.39, 0.19] |
| Outcome or subgroup title | No. of studies | No. of participants | Statistical method | Effect size |
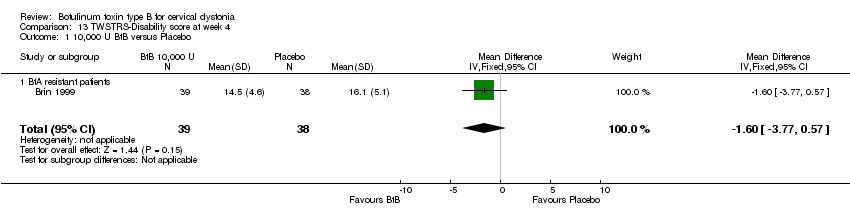
| 1 10,000 U BtB versus Placebo Show forest plot | 1 | 77 | Mean Difference (IV, Fixed, 95% CI) | ‐1.60 [‐3.77, 0.57] |
| Analysis 13.1  Comparison 13 TWSTRS‐Disability score at week 4, Outcome 1 10,000 U BtB versus Placebo. | ||||
| 1.1 BtA resistant patients | 1 | 77 | Mean Difference (IV, Fixed, 95% CI) | ‐1.60 [‐3.77, 0.57] |
| Outcome or subgroup title | No. of studies | No. of participants | Statistical method | Effect size |
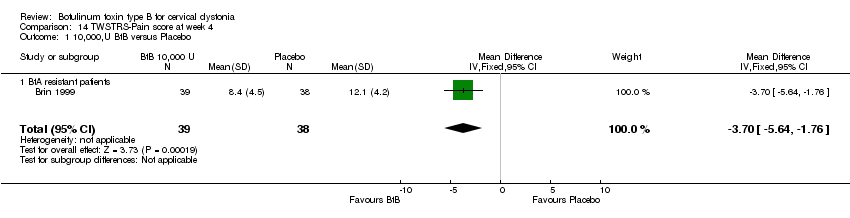
| 1 10,000,U BtB versus Placebo Show forest plot | 1 | 77 | Mean Difference (IV, Fixed, 95% CI) | ‐3.70 [‐5.64, ‐1.76] |
| Analysis 14.1  Comparison 14 TWSTRS‐Pain score at week 4, Outcome 1 10,000,U BtB versus Placebo. | ||||
| 1.1 BtA resistant patients | 1 | 77 | Mean Difference (IV, Fixed, 95% CI) | ‐3.70 [‐5.64, ‐1.76] |
| Outcome or subgroup title | No. of studies | No. of participants | Statistical method | Effect size |
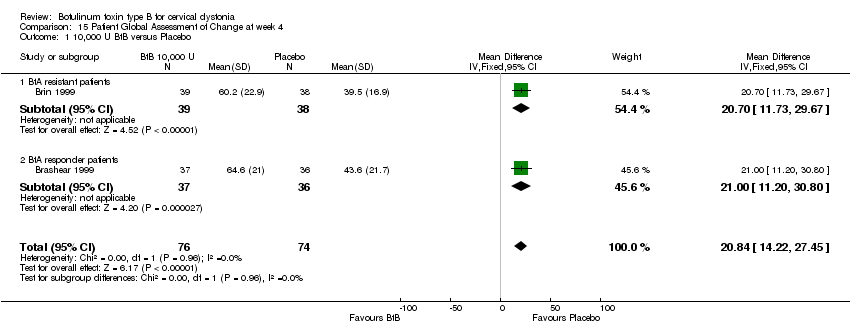
| 1 10,000 U BtB versus Placebo Show forest plot | 2 | 150 | Mean Difference (IV, Fixed, 95% CI) | 20.84 [14.22, 27.45] |
| Analysis 15.1  Comparison 15 Patient Global Assessment of Change at week 4, Outcome 1 10,000 U BtB versus Placebo. | ||||
| 1.1 BtA resistant patients | 1 | 77 | Mean Difference (IV, Fixed, 95% CI) | 20.70 [11.73, 29.67] |
| 1.2 BtA responder patients | 1 | 73 | Mean Difference (IV, Fixed, 95% CI) | 21.00 [11.20, 30.80] |
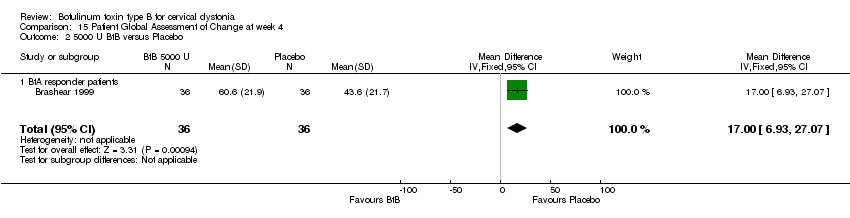
| 2 5000 U BtB versus Placebo Show forest plot | 1 | 72 | Mean Difference (IV, Fixed, 95% CI) | 17.0 [6.93, 27.07] |
| Analysis 15.2  Comparison 15 Patient Global Assessment of Change at week 4, Outcome 2 5000 U BtB versus Placebo. | ||||
| 2.1 BtA responder patients | 1 | 72 | Mean Difference (IV, Fixed, 95% CI) | 17.0 [6.93, 27.07] |
| 3 10,000U BtB versus 5000 U BtB Show forest plot | 1 | 73 | Mean Difference (IV, Fixed, 95% CI) | 4.00 [‐5.85, 13.85] |
| Analysis 15.3  Comparison 15 Patient Global Assessment of Change at week 4, Outcome 3 10,000U BtB versus 5000 U BtB. | ||||
| 3.1 BtA responder patients | 1 | 73 | Mean Difference (IV, Fixed, 95% CI) | 4.00 [‐5.85, 13.85] |
| Outcome or subgroup title | No. of studies | No. of participants | Statistical method | Effect size |
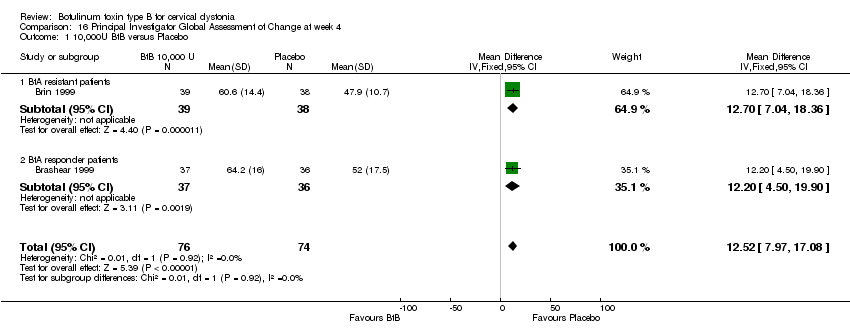
| 1 10,000U BtB versus Placebo Show forest plot | 2 | 150 | Mean Difference (IV, Fixed, 95% CI) | 12.52 [7.97, 17.08] |
| Analysis 16.1  Comparison 16 Principal Investigator Global Assessment of Change at week 4, Outcome 1 10,000U BtB versus Placebo. | ||||
| 1.1 BtA resistant patients | 1 | 77 | Mean Difference (IV, Fixed, 95% CI) | 12.70 [7.04, 18.36] |
| 1.2 BtA responder patients | 1 | 73 | Mean Difference (IV, Fixed, 95% CI) | 12.20 [4.50, 19.90] |
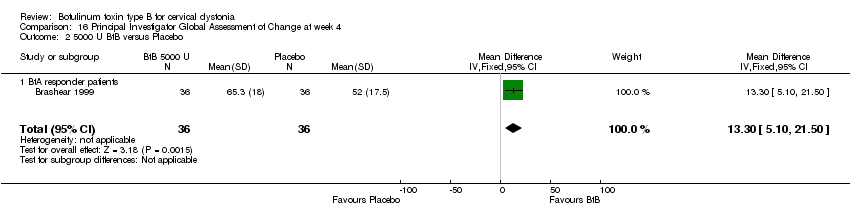
| 2 5000 U BtB versus Placebo Show forest plot | 1 | 72 | Mean Difference (IV, Fixed, 95% CI) | 13.30 [5.10, 21.50] |
| Analysis 16.2  Comparison 16 Principal Investigator Global Assessment of Change at week 4, Outcome 2 5000 U BtB versus Placebo. | ||||
| 2.1 BtA responder patients | 1 | 72 | Mean Difference (IV, Fixed, 95% CI) | 13.30 [5.10, 21.50] |
| 3 10,000 U BtB versus 5000 U BtB Show forest plot | 1 | 73 | Mean Difference (IV, Fixed, 95% CI) | ‐1.10 [‐8.92, 6.72] |
| Analysis 16.3  Comparison 16 Principal Investigator Global Assessment of Change at week 4, Outcome 3 10,000 U BtB versus 5000 U BtB. | ||||
| 3.1 BtA responder patients | 1 | 73 | Mean Difference (IV, Fixed, 95% CI) | ‐1.10 [‐8.92, 6.72] |
| Outcome or subgroup title | No. of studies | No. of participants | Statistical method | Effect size |
| 1 10,000U BtB versus Placebo Show forest plot | 2 | 150 | Mean Difference (IV, Fixed, 95% CI) | 19.63 [11.69, 27.56] |
| Analysis 17.1  Comparison 17 Patient Analog Pain Assessment at week 4, Outcome 1 10,000U BtB versus Placebo. | ||||
| 1.1 BtA resistant patients | 1 | 77 | Mean Difference (IV, Fixed, 95% CI) | 20.40 [9.90, 30.90] |
| 1.2 BtA responder patients | 1 | 73 | Mean Difference (IV, Fixed, 95% CI) | 18.60 [6.50, 30.70] |
| 2 5000 U BtB versus Placebo Show forest plot | 1 | 72 | Mean Difference (IV, Fixed, 95% CI) | 18.0 [5.69, 30.31] |
| Analysis 17.2  Comparison 17 Patient Analog Pain Assessment at week 4, Outcome 2 5000 U BtB versus Placebo. | ||||
| 2.1 BtA responder patients | 1 | 72 | Mean Difference (IV, Fixed, 95% CI) | 18.0 [5.69, 30.31] |
| 3 10,000 U BtB versus 5000 U BtB Show forest plot | 1 | 73 | Mean Difference (IV, Fixed, 95% CI) | 0.60 [‐11.33, 12.53] |
| Analysis 17.3  Comparison 17 Patient Analog Pain Assessment at week 4, Outcome 3 10,000 U BtB versus 5000 U BtB. | ||||
| 3.1 BtA responder patients | 1 | 73 | Mean Difference (IV, Fixed, 95% CI) | 0.60 [‐11.33, 12.53] |
| Outcome or subgroup title | No. of studies | No. of participants | Statistical method | Effect size |
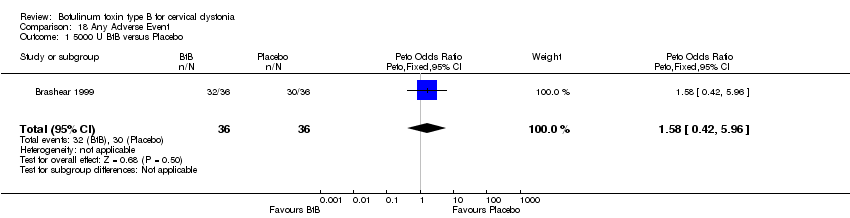
| 1 5000 U BtB versus Placebo Show forest plot | 1 | 72 | Peto Odds Ratio (Peto, Fixed, 95% CI) | 1.58 [0.42, 5.96] |
| Analysis 18.1  Comparison 18 Any Adverse Event, Outcome 1 5000 U BtB versus Placebo. | ||||
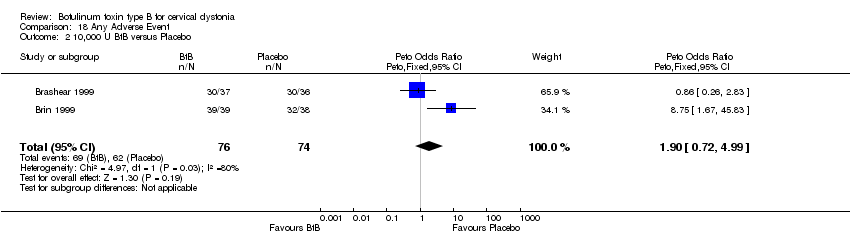
| 2 10,000 U BtB versus Placebo Show forest plot | 2 | 150 | Peto Odds Ratio (Peto, Fixed, 95% CI) | 1.90 [0.72, 4.99] |
| Analysis 18.2  Comparison 18 Any Adverse Event, Outcome 2 10,000 U BtB versus Placebo. | ||||
| 3 BtB (5000‐10,000 U) vs Placebo Show forest plot | 2 | 186 | Peto Odds Ratio (Peto, Fixed, 95% CI) | 2.10 [0.84, 5.24] |
| Analysis 18.3  Comparison 18 Any Adverse Event, Outcome 3 BtB (5000‐10,000 U) vs Placebo. | ||||
| 4 BtB (5000 U) versus BtB (10,000 U) Show forest plot | 1 | 73 | Peto Odds Ratio (Peto, Fixed, 95% CI) | 1.83 [0.51, 6.52] |
| Analysis 18.4  Comparison 18 Any Adverse Event, Outcome 4 BtB (5000 U) versus BtB (10,000 U). | ||||
| Outcome or subgroup title | No. of studies | No. of participants | Statistical method | Effect size |
| 1 2500 U BtB versus Placebo Show forest plot | 1 | 61 | Peto Odds Ratio (Peto, Fixed, 95% CI) | 0.97 [0.06, 15.84] |
| Analysis 19.1  Comparison 19 Dry Mouth Adverse Event, Outcome 1 2500 U BtB versus Placebo. | ||||
| 2 5000 U BtB versus Placebo Show forest plot | 2 | 133 | Peto Odds Ratio (Peto, Fixed, 95% CI) | 3.55 [0.99, 12.76] |
| Analysis 19.2  Comparison 19 Dry Mouth Adverse Event, Outcome 2 5000 U BtB versus Placebo. | ||||
| 3 10,000 U BtB versus Placebo Show forest plot | 3 | 210 | Peto Odds Ratio (Peto, Fixed, 95% CI) | 7.76 [3.87, 15.54] |
| Analysis 19.3  Comparison 19 Dry Mouth Adverse Event, Outcome 3 10,000 U BtB versus Placebo. | ||||
| 4 BtB (2500‐10,000 U) vs Placebo Show forest plot | 3 | 307 | Peto Odds Ratio (Peto, Fixed, 95% CI) | 5.19 [2.69, 10.03] |
| Analysis 19.4  Comparison 19 Dry Mouth Adverse Event, Outcome 4 BtB (2500‐10,000 U) vs Placebo. | ||||
| 5 BtB (2500‐5000 U) versus BtB (10,000 U) Show forest plot | 2 | 167 | Peto Odds Ratio (Peto, Fixed, 95% CI) | 0.19 [0.09, 0.40] |
| Analysis 19.5  Comparison 19 Dry Mouth Adverse Event, Outcome 5 BtB (2500‐5000 U) versus BtB (10,000 U). | ||||
| Outcome or subgroup title | No. of studies | No. of participants | Statistical method | Effect size |
| 1 2500 U BtB versus Placebo Show forest plot | 1 | 61 | Peto Odds Ratio (Peto, Fixed, 95% CI) | 8.23 [1.34, 50.56] |
| Analysis 20.1  Comparison 20 Dysphagia Adverse Event, Outcome 1 2500 U BtB versus Placebo. | ||||
| 2 5000 U BtB versus Placebo Show forest plot | 2 | 133 | Peto Odds Ratio (Peto, Fixed, 95% CI) | 4.77 [1.15, 19.74] |
| Analysis 20.2  Comparison 20 Dysphagia Adverse Event, Outcome 2 5000 U BtB versus Placebo. | ||||
| 3 10,000 U BtB versus Placebo Show forest plot | 3 | 210 | Peto Odds Ratio (Peto, Fixed, 95% CI) | 6.20 [2.87, 13.37] |
| Analysis 20.3  Comparison 20 Dysphagia Adverse Event, Outcome 3 10,000 U BtB versus Placebo. | ||||
| 4 BtB (2500‐10,000 U) versus Placebo Show forest plot | 3 | 308 | Peto Odds Ratio (Peto, Fixed, 95% CI) | 4.37 [2.18, 8.79] |
| Analysis 20.4  Comparison 20 Dysphagia Adverse Event, Outcome 4 BtB (2500‐10,000 U) versus Placebo. | ||||
| 5 BtB (2500‐5000 U) versus BtB (10,000 U) Show forest plot | 2 | 165 | Peto Odds Ratio (Peto, Fixed, 95% CI) | 0.42 [0.18, 0.98] |
| Analysis 20.5  Comparison 20 Dysphagia Adverse Event, Outcome 5 BtB (2500‐5000 U) versus BtB (10,000 U). | ||||
| Outcome or subgroup title | No. of studies | No. of participants | Statistical method | Effect size |
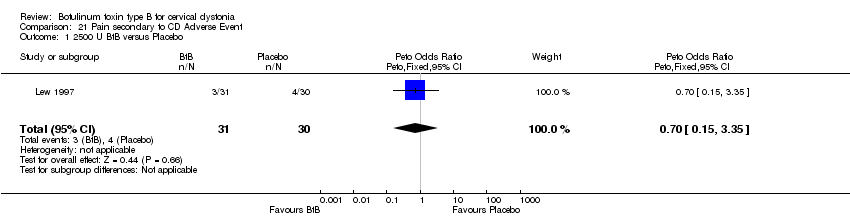
| 1 2500 U BtB versus Placebo Show forest plot | 1 | 61 | Peto Odds Ratio (Peto, Fixed, 95% CI) | 0.70 [0.15, 3.35] |
| Analysis 21.1  Comparison 21 Pain secondary to CD Adverse Event, Outcome 1 2500 U BtB versus Placebo. | ||||
| 2 5000 U BtB versus Placebo Show forest plot | 2 | 133 | Peto Odds Ratio (Peto, Fixed, 95% CI) | 1.09 [0.46, 2.56] |
| Analysis 21.2  Comparison 21 Pain secondary to CD Adverse Event, Outcome 2 5000 U BtB versus Placebo. | ||||
| 3 10,000 U BtB versus Placebo Show forest plot | 3 | 210 | Peto Odds Ratio (Peto, Fixed, 95% CI) | 1.22 [0.63, 2.33] |
| Analysis 21.3  Comparison 21 Pain secondary to CD Adverse Event, Outcome 3 10,000 U BtB versus Placebo. | ||||
| 4 BtB (2500‐10,000 U) versus Placebo Show forest plot | 3 | 308 | Peto Odds Ratio (Peto, Fixed, 95% CI) | 1.10 [0.60, 1.99] |
| Analysis 21.4  Comparison 21 Pain secondary to CD Adverse Event, Outcome 4 BtB (2500‐10,000 U) versus Placebo. | ||||
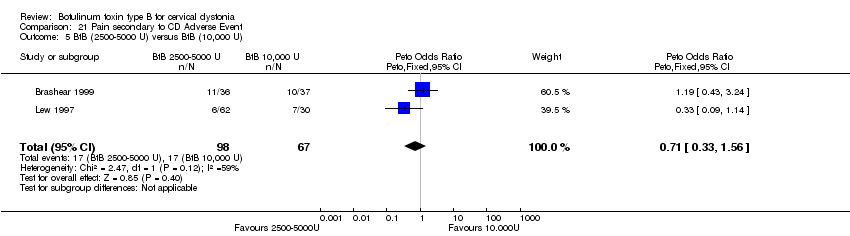
| 5 BtB (2500‐5000 U) versus BtB (10,000 U) Show forest plot | 2 | 165 | Peto Odds Ratio (Peto, Fixed, 95% CI) | 0.71 [0.33, 1.56] |
| Analysis 21.5  Comparison 21 Pain secondary to CD Adverse Event, Outcome 5 BtB (2500‐5000 U) versus BtB (10,000 U). | ||||
| Outcome or subgroup title | No. of studies | No. of participants | Statistical method | Effect size |
| 1 2500 U BtB versus Placebo Show forest plot | 1 | 61 | Peto Odds Ratio (Peto, Fixed, 95% CI) | 7.94 [1.06, 59.29] |
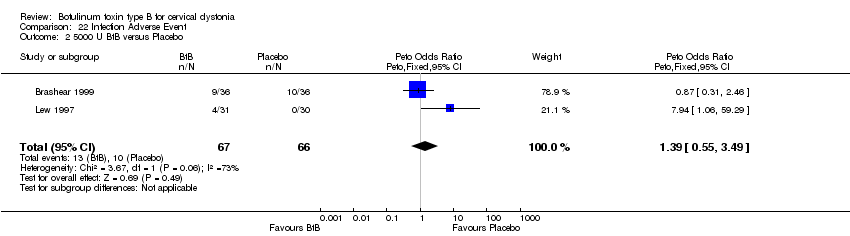
| Analysis 22.1  Comparison 22 Infection Adverse Event, Outcome 1 2500 U BtB versus Placebo. | ||||
| 2 5000 U BtB versus Placebo Show forest plot | 2 | 133 | Peto Odds Ratio (Peto, Fixed, 95% CI) | 1.39 [0.55, 3.49] |
| Analysis 22.2  Comparison 22 Infection Adverse Event, Outcome 2 5000 U BtB versus Placebo. | ||||
| 3 10,000 U BtB versus Placebo Show forest plot | 3 | 210 | Peto Odds Ratio (Peto, Fixed, 95% CI) | 0.97 [0.46, 2.07] |
| Analysis 22.3  Comparison 22 Infection Adverse Event, Outcome 3 10,000 U BtB versus Placebo. | ||||
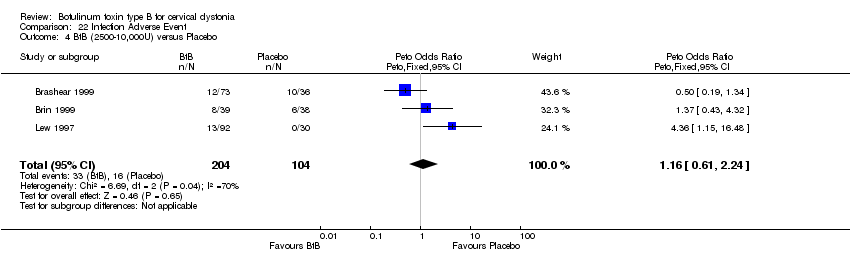
| 4 BtB (2500‐10,000U) versus Placebo Show forest plot | 3 | 308 | Peto Odds Ratio (Peto, Fixed, 95% CI) | 1.16 [0.61, 2.24] |
| Analysis 22.4  Comparison 22 Infection Adverse Event, Outcome 4 BtB (2500‐10,000U) versus Placebo. | ||||
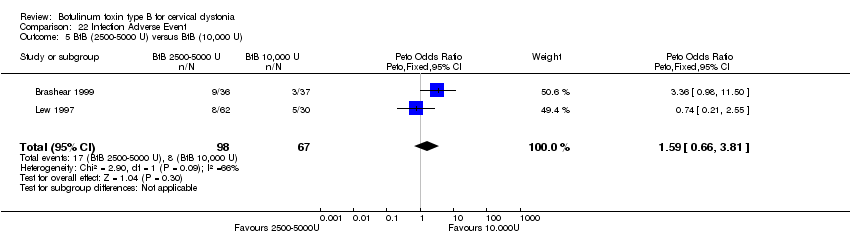
| 5 BtB (2500‐5000 U) versus BtB (10,000 U) Show forest plot | 2 | 165 | Peto Odds Ratio (Peto, Fixed, 95% CI) | 1.59 [0.66, 3.81] |
| Analysis 22.5  Comparison 22 Infection Adverse Event, Outcome 5 BtB (2500‐5000 U) versus BtB (10,000 U). | ||||
| Outcome or subgroup title | No. of studies | No. of participants | Statistical method | Effect size |
| 1 2500 U BtB versus Placebo Show forest plot | 1 | 61 | Peto Odds Ratio (Peto, Fixed, 95% CI) | 1.70 [0.39, 7.42] |
| Analysis 23.1  Comparison 23 Injection site pain Adverse Event, Outcome 1 2500 U BtB versus Placebo. | ||||
| 2 5000 U BtB versus Placebo Show forest plot | 2 | 133 | Peto Odds Ratio (Peto, Fixed, 95% CI) | 1.34 [0.44, 4.07] |
| Analysis 23.2  Comparison 23 Injection site pain Adverse Event, Outcome 2 5000 U BtB versus Placebo. | ||||
| 3 10,000 U BtB versus Placebo Show forest plot | 3 | 210 | Peto Odds Ratio (Peto, Fixed, 95% CI) | 1.84 [0.80, 4.21] |
| Analysis 23.3  Comparison 23 Injection site pain Adverse Event, Outcome 3 10,000 U BtB versus Placebo. | ||||
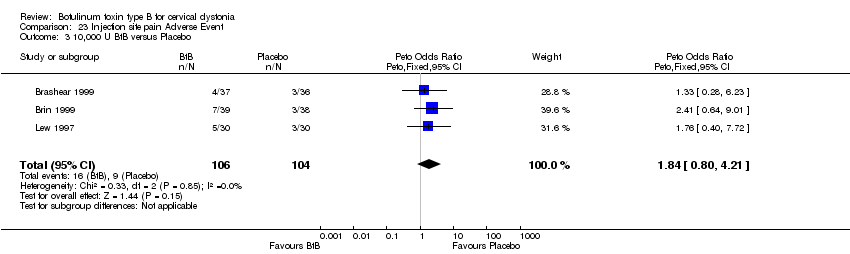
| 4 BtB (2500‐10,000 U) versus Placebo Show forest plot | 3 | 308 | Peto Odds Ratio (Peto, Fixed, 95% CI) | 1.66 [0.79, 3.48] |
| Analysis 23.4  Comparison 23 Injection site pain Adverse Event, Outcome 4 BtB (2500‐10,000 U) versus Placebo. | ||||
| 5 BtB (2500‐5000 U) versus BtB (10,000 U) Show forest plot | 2 | 165 | Peto Odds Ratio (Peto, Fixed, 95% CI) | 0.84 [0.33, 2.16] |
| Analysis 23.5  Comparison 23 Injection site pain Adverse Event, Outcome 5 BtB (2500‐5000 U) versus BtB (10,000 U). | ||||
| Outcome or subgroup title | No. of studies | No. of participants | Statistical method | Effect size |
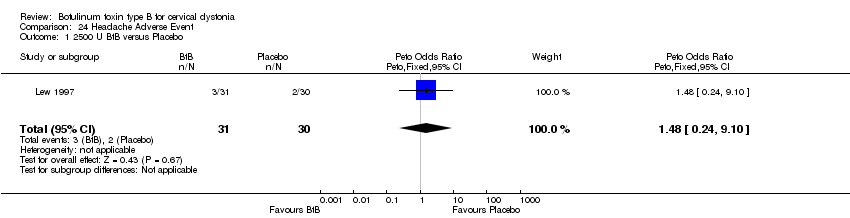
| 1 2500 U BtB versus Placebo Show forest plot | 1 | 61 | Peto Odds Ratio (Peto, Fixed, 95% CI) | 1.48 [0.24, 9.10] |
| Analysis 24.1  Comparison 24 Headache Adverse Event, Outcome 1 2500 U BtB versus Placebo. | ||||
| 2 5000 U BtB versus Placebo Show forest plot | 2 | 133 | Peto Odds Ratio (Peto, Fixed, 95% CI) | 2.34 [0.82, 6.69] |
| Analysis 24.2  Comparison 24 Headache Adverse Event, Outcome 2 5000 U BtB versus Placebo. | ||||
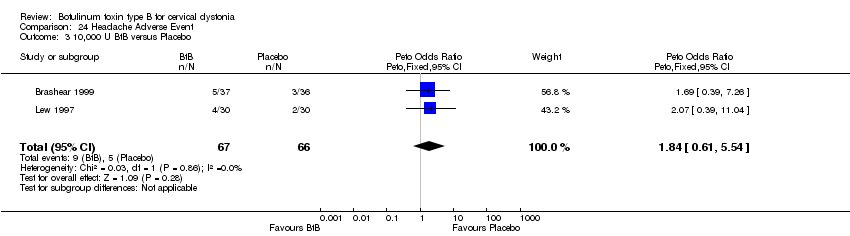
| 3 10,000 U BtB versus Placebo Show forest plot | 2 | 133 | Peto Odds Ratio (Peto, Fixed, 95% CI) | 1.84 [0.61, 5.54] |
| Analysis 24.3  Comparison 24 Headache Adverse Event, Outcome 3 10,000 U BtB versus Placebo. | ||||
| 4 BtB (2500‐10,000U) versus Placebo Show forest plot | 2 | 231 | Peto Odds Ratio (Peto, Fixed, 95% CI) | 1.92 [0.81, 4.59] |
| Analysis 24.4  Comparison 24 Headache Adverse Event, Outcome 4 BtB (2500‐10,000U) versus Placebo. | ||||
| 5 BtB (2500‐5000 U) versus BtB (10,000 U) Show forest plot | 2 | 165 | Peto Odds Ratio (Peto, Fixed, 95% CI) | 1.25 [0.50, 3.09] |
| Analysis 24.5  Comparison 24 Headache Adverse Event, Outcome 5 BtB (2500‐5000 U) versus BtB (10,000 U). | ||||
| Outcome or subgroup title | No. of studies | No. of participants | Statistical method | Effect size |
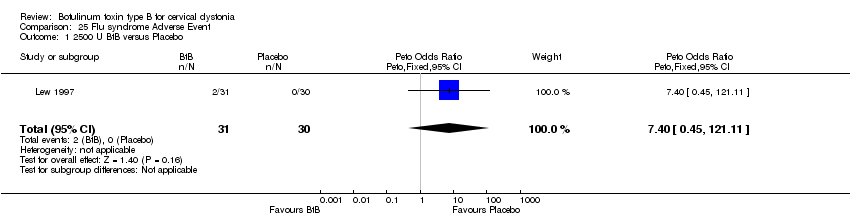
| 1 2500 U BtB versus Placebo Show forest plot | 1 | 61 | Peto Odds Ratio (Peto, Fixed, 95% CI) | 7.40 [0.45, 121.11] |
| Analysis 25.1  Comparison 25 Flu syndrome Adverse Event, Outcome 1 2500 U BtB versus Placebo. | ||||
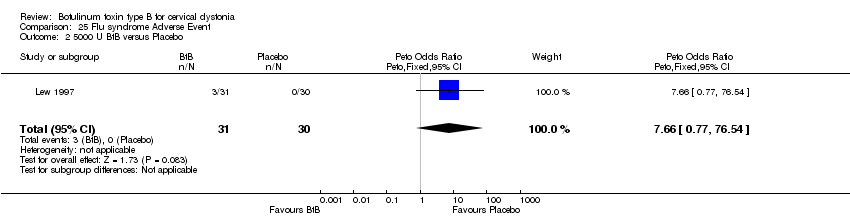
| 2 5000 U BtB versus Placebo Show forest plot | 1 | 61 | Peto Odds Ratio (Peto, Fixed, 95% CI) | 7.66 [0.77, 76.54] |
| Analysis 25.2  Comparison 25 Flu syndrome Adverse Event, Outcome 2 5000 U BtB versus Placebo. | ||||
| 3 10,000 U BtB versus Placebo Show forest plot | 1 | 60 | Peto Odds Ratio (Peto, Fixed, 95% CI) | 7.93 [0.79, 79.26] |
| Analysis 25.3  Comparison 25 Flu syndrome Adverse Event, Outcome 3 10,000 U BtB versus Placebo. | ||||
| 4 BtB (2500‐10,000 U) versus Placebo Show forest plot | 1 | 122 | Peto Odds Ratio (Peto, Fixed, 95% CI) | 4.09 [0.78, 21.44] |
| Analysis 25.4  Comparison 25 Flu syndrome Adverse Event, Outcome 4 BtB (2500‐10,000 U) versus Placebo. | ||||
| 5 BtB (2500‐5000 U) versus BtB (10,000 U) Show forest plot | 1 | 92 | Peto Odds Ratio (Peto, Fixed, 95% CI) | 0.96 [0.22, 4.15] |
| Analysis 25.5  Comparison 25 Flu syndrome Adverse Event, Outcome 5 BtB (2500‐5000 U) versus BtB (10,000 U). | ||||
| Outcome or subgroup title | No. of studies | No. of participants | Statistical method | Effect size |
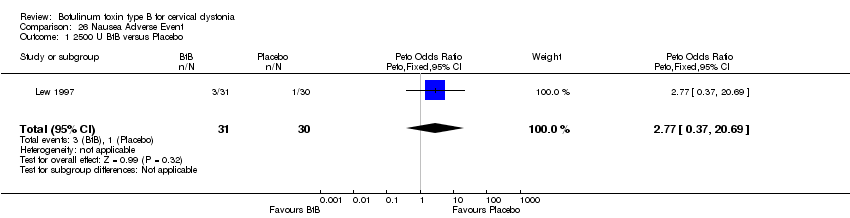
| 1 2500 U BtB versus Placebo Show forest plot | 1 | 61 | Peto Odds Ratio (Peto, Fixed, 95% CI) | 2.77 [0.37, 20.69] |
| Analysis 26.1  Comparison 26 Nausea Adverse Event, Outcome 1 2500 U BtB versus Placebo. | ||||
| 2 5000 U BtB versus Placebo Show forest plot | 1 | 61 | Peto Odds Ratio (Peto, Fixed, 95% CI) | 0.97 [0.06, 15.84] |
| Analysis 26.2  Comparison 26 Nausea Adverse Event, Outcome 2 5000 U BtB versus Placebo. | ||||
| 3 10,000 U BtB versus Placebo Show forest plot | 2 | 137 | Peto Odds Ratio (Peto, Fixed, 95% CI) | 2.28 [0.73, 7.12] |
| Analysis 26.3  Comparison 26 Nausea Adverse Event, Outcome 3 10,000 U BtB versus Placebo. | ||||
| 4 BtB (2500‐10,000 U) versus Placebo Show forest plot | 2 | 199 | Peto Odds Ratio (Peto, Fixed, 95% CI) | 2.03 [0.70, 5.86] |
| Analysis 26.4  Comparison 26 Nausea Adverse Event, Outcome 4 BtB (2500‐10,000 U) versus Placebo. | ||||
| 5 BtB (2500‐5000 U) versus BtB (10,000 U) Show forest plot | 1 | 92 | Peto Odds Ratio (Peto, Fixed, 95% CI) | 0.61 [0.12, 3.11] |
| Analysis 26.5  Comparison 26 Nausea Adverse Event, Outcome 5 BtB (2500‐5000 U) versus BtB (10,000 U). | ||||
| Outcome or subgroup title | No. of studies | No. of participants | Statistical method | Effect size |
| 1 2500 U BtB versus Placebo Show forest plot | 1 | 61 | Peto Odds Ratio (Peto, Fixed, 95% CI) | 0.97 [0.13, 7.22] |
| Analysis 27.1  Comparison 27 Pain Adverse Event, Outcome 1 2500 U BtB versus Placebo. | ||||
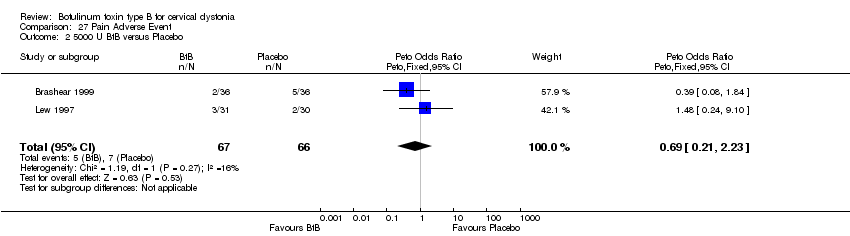
| 2 5000 U BtB versus Placebo Show forest plot | 2 | 133 | Peto Odds Ratio (Peto, Fixed, 95% CI) | 0.69 [0.21, 2.23] |
| Analysis 27.2  Comparison 27 Pain Adverse Event, Outcome 2 5000 U BtB versus Placebo. | ||||
| 3 10,000 U BtB versus Placebo Show forest plot | 2 | 133 | Peto Odds Ratio (Peto, Fixed, 95% CI) | 1.82 [0.68, 4.82] |
| Analysis 27.3  Comparison 27 Pain Adverse Event, Outcome 3 10,000 U BtB versus Placebo. | ||||
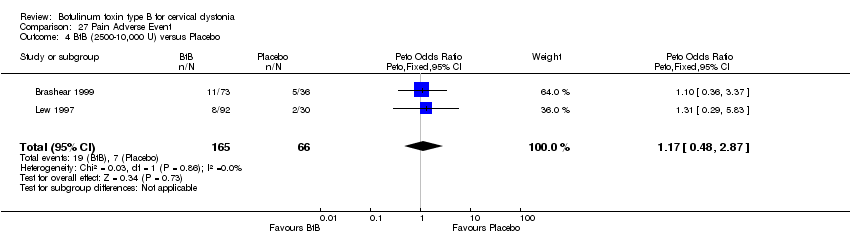
| 4 BtB (2500‐10,000 U) versus Placebo Show forest plot | 2 | 231 | Peto Odds Ratio (Peto, Fixed, 95% CI) | 1.17 [0.48, 2.87] |
| Analysis 27.4  Comparison 27 Pain Adverse Event, Outcome 4 BtB (2500‐10,000 U) versus Placebo. | ||||
| 5 BtB (2500‐5000 U) vs BtB (10,000 U) Show forest plot | 2 | 165 | Peto Odds Ratio (Peto, Fixed, 95% CI) | 0.38 [0.14, 1.03] |
| Analysis 27.5  Comparison 27 Pain Adverse Event, Outcome 5 BtB (2500‐5000 U) vs BtB (10,000 U). | ||||
| Outcome or subgroup title | No. of studies | No. of participants | Statistical method | Effect size |
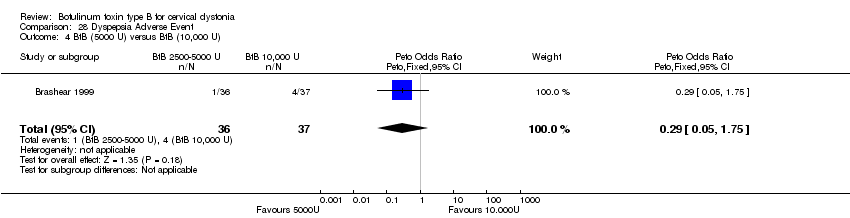
| 1 5000 U BtB versus Placebo Show forest plot | 1 | 72 | Peto Odds Ratio (Peto, Fixed, 95% CI) | 0.35 [0.05, 2.61] |
| Analysis 28.1  Comparison 28 Dyspepsia Adverse Event, Outcome 1 5000 U BtB versus Placebo. | ||||
| 2 10,000 U BtB versus Placebo Show forest plot | 1 | 73 | Peto Odds Ratio (Peto, Fixed, 95% CI) | 1.33 [0.28, 6.23] |
| Analysis 28.2  Comparison 28 Dyspepsia Adverse Event, Outcome 2 10,000 U BtB versus Placebo. | ||||
| 3 BtB (5000‐10,000 U) versus Placebo Show forest plot | 1 | 109 | Peto Odds Ratio (Peto, Fixed, 95% CI) | 0.81 [0.18, 3.70] |
| Analysis 28.3  Comparison 28 Dyspepsia Adverse Event, Outcome 3 BtB (5000‐10,000 U) versus Placebo. | ||||
| 4 BtB (5000 U) versus BtB (10,000 U) Show forest plot | 1 | 73 | Peto Odds Ratio (Peto, Fixed, 95% CI) | 0.29 [0.05, 1.75] |
| Analysis 28.4  Comparison 28 Dyspepsia Adverse Event, Outcome 4 BtB (5000 U) versus BtB (10,000 U). | ||||
Comparison 1 Improvement of at least 20% in TWSTRS‐Total score at week 4, Outcome 1 2500 U BtB versus Placebo.

Comparison 1 Improvement of at least 20% in TWSTRS‐Total score at week 4, Outcome 2 5000 U BtB versus Placebo.

Comparison 1 Improvement of at least 20% in TWSTRS‐Total score at week 4, Outcome 3 10,000 U BtB versus Placebo.

Comparison 1 Improvement of at least 20% in TWSTRS‐Total score at week 4, Outcome 4 BtB (2500‐10,000U) versus Placebo.

Comparison 1 Improvement of at least 20% in TWSTRS‐Total score at week 4, Outcome 5 BtB (2500‐5000 U) versus BNT/B (10,000 U).

Comparison 2 Improvement of at least 20% in TWSTRS‐Total score at week 8, Outcome 1 2500 U BtB versus Placebo.

Comparison 2 Improvement of at least 20% in TWSTRS‐Total score at week 8, Outcome 2 5000 U BtB versus Placebo.

Comparison 2 Improvement of at least 20% in TWSTRS‐Total score at week 8, Outcome 3 10,000 U BtB versus Placebo.

Comparison 2 Improvement of at least 20% in TWSTRS‐Total score at week 8, Outcome 4 BtB (2500‐10,000 U) versus Placebo.

Comparison 2 Improvement of at least 20% in TWSTRS‐Total score at week 8, Outcome 5 BtB (2500‐5000 U) versus BtB (10,000 U).
Comparison 3 Improvement of at least 20% in TWSTRS‐Total score at week 12, Outcome 1 2500 U BtB versus Placebo.

Comparison 3 Improvement of at least 20% in TWSTRS‐Total score at week 12, Outcome 2 5000 U BtB versus Placebo.

Comparison 3 Improvement of at least 20% in TWSTRS‐Total score at week 12, Outcome 3 10,000 U BtB vs Placebo.

Comparison 3 Improvement of at least 20% in TWSTRS‐Total score at week 12, Outcome 4 BtB (2500‐10,000U) versus Placebo.

Comparison 3 Improvement of at least 20% in TWSTRS‐Total score at week 12, Outcome 5 BtB (2500‐5000 U) versus BtB (10,000 U).

Comparison 4 Improvement of at least 20% in TWSTRS‐Total score at week 16, Outcome 1 2500 U BtB versus Placebo.

Comparison 4 Improvement of at least 20% in TWSTRS‐Total score at week 16, Outcome 2 5000 U BtB versus Placebo.

Comparison 4 Improvement of at least 20% in TWSTRS‐Total score at week 16, Outcome 3 10,000 U BtB versus Placebo.
Comparison 4 Improvement of at least 20% in TWSTRS‐Total score at week 16, Outcome 4 BtB (2500‐10,000 U) versus Placebo.

Comparison 4 Improvement of at least 20% in TWSTRS‐Total score at week 16, Outcome 5 BtB (2500‐5000 U) versus BtB (10,000 U).
Comparison 5 Improvement in TWSTRS‐Severity score at week 4, Outcome 1 2500 U BtB versus Placebo.

Comparison 5 Improvement in TWSTRS‐Severity score at week 4, Outcome 2 5000 U BtB versus Placebo.

Comparison 5 Improvement in TWSTRS‐Severity score at week 4, Outcome 3 10,000 U BtB versus Placebo.

Comparison 5 Improvement in TWSTRS‐Severity score at week 4, Outcome 4 BtB (2500‐10,000 U) versus Placebo.
Comparison 5 Improvement in TWSTRS‐Severity score at week 4, Outcome 5 BtB (2500‐5000 U) versus BtB (10,000 U).

Comparison 6 Improvement in TWSTRS‐Disability score at week 4, Outcome 1 2500 U BtB versus Placebo.

Comparison 6 Improvement in TWSTRS‐Disability score at week 4, Outcome 2 5000 U BtB versuss Placebo.

Comparison 6 Improvement in TWSTRS‐Disability score at week 4, Outcome 3 10,000 U BtB versus Placebo.
Comparison 6 Improvement in TWSTRS‐Disability score at week 4, Outcome 4 BtB (2500‐10,000 U) versus Placebo.

Comparison 6 Improvement in TWSTRS‐Disability score at week 4, Outcome 5 BtB (2500‐5000 U) versus BtB (10,000 U).

Comparison 7 Improvement in TWSTRS‐Pain score at week 4, Outcome 1 2500 U BtB versus Placebo.

Comparison 7 Improvement in TWSTRS‐Pain score at week 4, Outcome 2 5000 U BtB versus Placebo.
Comparison 7 Improvement in TWSTRS‐Pain score at week 4, Outcome 3 10,000 U BtB versus Placebo.

Comparison 7 Improvement in TWSTRS‐Pain score at week 4, Outcome 4 BtB (2500‐10,000U) versus Placebo.

Comparison 7 Improvement in TWSTRS‐Pain score at week 4, Outcome 5 BtB (2500‐5000 U) versus BtB (10,000 U).

Comparison 8 TWSTRS‐Total score at week 4, Outcome 1 10,000U BtB versus Placebo.

Comparison 8 TWSTRS‐Total score at week 4, Outcome 2 5000 U BtB versus Placebo.

Comparison 8 TWSTRS‐Total score at week 4, Outcome 3 10,000U BtB versus 5000 U BoNT/B.
Comparison 9 TWSTRS‐Total score at week 8, Outcome 1 10,000U BtB versus Placebo.

Comparison 9 TWSTRS‐Total score at week 8, Outcome 2 5000 U BtB versus Placebo.

Comparison 9 TWSTRS‐Total score at week 8, Outcome 3 10,000 U BtB versus 5000 U BtB.
Comparison 10 TWSTRS‐Total score at week 12, Outcome 1 10,000 U BtB versus Placebo.

Comparison 10 TWSTRS‐Total score at week 12, Outcome 2 5000 U BtB versus Placebo.

Comparison 10 TWSTRS‐Total score at week 12, Outcome 3 10,000U BtB versus 5000 U BtB.

Comparison 11 TWSTRS‐Total score at week 16, Outcome 1 10,000U BtB versus Placebo.

Comparison 11 TWSTRS‐Total score at week 16, Outcome 2 5000 U BtB versus Placebo.

Comparison 11 TWSTRS‐Total score at week 16, Outcome 3 10,000 U BtB versus 5000 U BtB.

Comparison 12 TWSTRS‐Severity score at week 4, Outcome 1 10,000 U BtB versus Placebo.
Comparison 13 TWSTRS‐Disability score at week 4, Outcome 1 10,000 U BtB versus Placebo.
Comparison 14 TWSTRS‐Pain score at week 4, Outcome 1 10,000,U BtB versus Placebo.
Comparison 15 Patient Global Assessment of Change at week 4, Outcome 1 10,000 U BtB versus Placebo.
Comparison 15 Patient Global Assessment of Change at week 4, Outcome 2 5000 U BtB versus Placebo.

Comparison 15 Patient Global Assessment of Change at week 4, Outcome 3 10,000U BtB versus 5000 U BtB.
Comparison 16 Principal Investigator Global Assessment of Change at week 4, Outcome 1 10,000U BtB versus Placebo.
Comparison 16 Principal Investigator Global Assessment of Change at week 4, Outcome 2 5000 U BtB versus Placebo.

Comparison 16 Principal Investigator Global Assessment of Change at week 4, Outcome 3 10,000 U BtB versus 5000 U BtB.

Comparison 17 Patient Analog Pain Assessment at week 4, Outcome 1 10,000U BtB versus Placebo.

Comparison 17 Patient Analog Pain Assessment at week 4, Outcome 2 5000 U BtB versus Placebo.

Comparison 17 Patient Analog Pain Assessment at week 4, Outcome 3 10,000 U BtB versus 5000 U BtB.
Comparison 18 Any Adverse Event, Outcome 1 5000 U BtB versus Placebo.
Comparison 18 Any Adverse Event, Outcome 2 10,000 U BtB versus Placebo.

Comparison 18 Any Adverse Event, Outcome 3 BtB (5000‐10,000 U) vs Placebo.

Comparison 18 Any Adverse Event, Outcome 4 BtB (5000 U) versus BtB (10,000 U).

Comparison 19 Dry Mouth Adverse Event, Outcome 1 2500 U BtB versus Placebo.

Comparison 19 Dry Mouth Adverse Event, Outcome 2 5000 U BtB versus Placebo.

Comparison 19 Dry Mouth Adverse Event, Outcome 3 10,000 U BtB versus Placebo.

Comparison 19 Dry Mouth Adverse Event, Outcome 4 BtB (2500‐10,000 U) vs Placebo.

Comparison 19 Dry Mouth Adverse Event, Outcome 5 BtB (2500‐5000 U) versus BtB (10,000 U).

Comparison 20 Dysphagia Adverse Event, Outcome 1 2500 U BtB versus Placebo.

Comparison 20 Dysphagia Adverse Event, Outcome 2 5000 U BtB versus Placebo.

Comparison 20 Dysphagia Adverse Event, Outcome 3 10,000 U BtB versus Placebo.

Comparison 20 Dysphagia Adverse Event, Outcome 4 BtB (2500‐10,000 U) versus Placebo.

Comparison 20 Dysphagia Adverse Event, Outcome 5 BtB (2500‐5000 U) versus BtB (10,000 U).
Comparison 21 Pain secondary to CD Adverse Event, Outcome 1 2500 U BtB versus Placebo.

Comparison 21 Pain secondary to CD Adverse Event, Outcome 2 5000 U BtB versus Placebo.

Comparison 21 Pain secondary to CD Adverse Event, Outcome 3 10,000 U BtB versus Placebo.

Comparison 21 Pain secondary to CD Adverse Event, Outcome 4 BtB (2500‐10,000 U) versus Placebo.
Comparison 21 Pain secondary to CD Adverse Event, Outcome 5 BtB (2500‐5000 U) versus BtB (10,000 U).

Comparison 22 Infection Adverse Event, Outcome 1 2500 U BtB versus Placebo.
Comparison 22 Infection Adverse Event, Outcome 2 5000 U BtB versus Placebo.

Comparison 22 Infection Adverse Event, Outcome 3 10,000 U BtB versus Placebo.
Comparison 22 Infection Adverse Event, Outcome 4 BtB (2500‐10,000U) versus Placebo.
Comparison 22 Infection Adverse Event, Outcome 5 BtB (2500‐5000 U) versus BtB (10,000 U).

Comparison 23 Injection site pain Adverse Event, Outcome 1 2500 U BtB versus Placebo.

Comparison 23 Injection site pain Adverse Event, Outcome 2 5000 U BtB versus Placebo.
Comparison 23 Injection site pain Adverse Event, Outcome 3 10,000 U BtB versus Placebo.

Comparison 23 Injection site pain Adverse Event, Outcome 4 BtB (2500‐10,000 U) versus Placebo.

Comparison 23 Injection site pain Adverse Event, Outcome 5 BtB (2500‐5000 U) versus BtB (10,000 U).
Comparison 24 Headache Adverse Event, Outcome 1 2500 U BtB versus Placebo.

Comparison 24 Headache Adverse Event, Outcome 2 5000 U BtB versus Placebo.
Comparison 24 Headache Adverse Event, Outcome 3 10,000 U BtB versus Placebo.

Comparison 24 Headache Adverse Event, Outcome 4 BtB (2500‐10,000U) versus Placebo.

Comparison 24 Headache Adverse Event, Outcome 5 BtB (2500‐5000 U) versus BtB (10,000 U).
Comparison 25 Flu syndrome Adverse Event, Outcome 1 2500 U BtB versus Placebo.
Comparison 25 Flu syndrome Adverse Event, Outcome 2 5000 U BtB versus Placebo.

Comparison 25 Flu syndrome Adverse Event, Outcome 3 10,000 U BtB versus Placebo.

Comparison 25 Flu syndrome Adverse Event, Outcome 4 BtB (2500‐10,000 U) versus Placebo.

Comparison 25 Flu syndrome Adverse Event, Outcome 5 BtB (2500‐5000 U) versus BtB (10,000 U).
Comparison 26 Nausea Adverse Event, Outcome 1 2500 U BtB versus Placebo.

Comparison 26 Nausea Adverse Event, Outcome 2 5000 U BtB versus Placebo.

Comparison 26 Nausea Adverse Event, Outcome 3 10,000 U BtB versus Placebo.

Comparison 26 Nausea Adverse Event, Outcome 4 BtB (2500‐10,000 U) versus Placebo.

Comparison 26 Nausea Adverse Event, Outcome 5 BtB (2500‐5000 U) versus BtB (10,000 U).

Comparison 27 Pain Adverse Event, Outcome 1 2500 U BtB versus Placebo.
Comparison 27 Pain Adverse Event, Outcome 2 5000 U BtB versus Placebo.

Comparison 27 Pain Adverse Event, Outcome 3 10,000 U BtB versus Placebo.
Comparison 27 Pain Adverse Event, Outcome 4 BtB (2500‐10,000 U) versus Placebo.

Comparison 27 Pain Adverse Event, Outcome 5 BtB (2500‐5000 U) vs BtB (10,000 U).

Comparison 28 Dyspepsia Adverse Event, Outcome 1 5000 U BtB versus Placebo.

Comparison 28 Dyspepsia Adverse Event, Outcome 2 10,000 U BtB versus Placebo.

Comparison 28 Dyspepsia Adverse Event, Outcome 3 BtB (5000‐10,000 U) versus Placebo.
Comparison 28 Dyspepsia Adverse Event, Outcome 4 BtB (5000 U) versus BtB (10,000 U).
| Outcome or subgroup title | No. of studies | No. of participants | Statistical method | Effect size |
| 1 2500 U BtB versus Placebo Show forest plot | 1 | 61 | Peto Odds Ratio (Peto, Fixed, 95% CI) | 3.45 [1.26, 9.41] |
| 1.1 BtA responder patients | 1 | 44 | Peto Odds Ratio (Peto, Fixed, 95% CI) | 3.57 [1.10, 11.56] |
| 1.2 BtA resistant or non‐responder patients | 1 | 17 | Peto Odds Ratio (Peto, Fixed, 95% CI) | 3.14 [0.45, 21.72] |
| 2 5000 U BtB versus Placebo Show forest plot | 1 | 61 | Peto Odds Ratio (Peto, Fixed, 95% CI) | 4.03 [1.48, 10.97] |
| 2.1 BtA responder patients | 1 | 46 | Peto Odds Ratio (Peto, Fixed, 95% CI) | 2.98 [0.94, 9.48] |
| 2.2 BtA resistant or non‐responder patients | 1 | 15 | Peto Odds Ratio (Peto, Fixed, 95% CI) | 9.89 [1.34, 73.12] |
| 3 10,000 U BtB versus Placebo Show forest plot | 1 | 60 | Peto Odds Ratio (Peto, Fixed, 95% CI) | 6.93 [2.55, 18.83] |
| 3.1 BtA responder patients | 1 | 40 | Peto Odds Ratio (Peto, Fixed, 95% CI) | 5.81 [1.71, 19.79] |
| 3.2 BtA resistant or non‐responder patients | 1 | 20 | Peto Odds Ratio (Peto, Fixed, 95% CI) | 9.85 [1.75, 55.34] |
| 4 BtB (2500‐10,000U) versus Placebo Show forest plot | 1 | 122 | Peto Odds Ratio (Peto, Fixed, 95% CI) | 4.69 [2.06, 10.69] |
| 4.1 BtA responder patients | 1 | 88 | Peto Odds Ratio (Peto, Fixed, 95% CI) | 3.90 [1.46, 10.37] |
| 4.2 BtA resistant or non‐responder patients | 1 | 34 | Peto Odds Ratio (Peto, Fixed, 95% CI) | 7.35 [1.60, 33.78] |
| 5 BtB (2500‐5000 U) versus BNT/B (10,000 U) Show forest plot | 1 | 92 | Peto Odds Ratio (Peto, Fixed, 95% CI) | 0.50 [0.20, 1.25] |
| 5.1 BtA responder patients | 1 | 67 | Peto Odds Ratio (Peto, Fixed, 95% CI) | 0.52 [0.18, 1.56] |
| 5.2 BtA resistant or non‐responder patients | 1 | 25 | Peto Odds Ratio (Peto, Fixed, 95% CI) | 0.43 [0.08, 2.43] |
| Outcome or subgroup title | No. of studies | No. of participants | Statistical method | Effect size |
| 1 2500 U BtB versus Placebo Show forest plot | 1 | 61 | Peto Odds Ratio (Peto, Fixed, 95% CI) | 2.60 [0.84, 8.07] |
| 2 5000 U BtB versus Placebo Show forest plot | 1 | 61 | Peto Odds Ratio (Peto, Fixed, 95% CI) | 3.30 [1.11, 9.84] |
| 3 10,000 U BtB versus Placebo Show forest plot | 1 | 60 | Peto Odds Ratio (Peto, Fixed, 95% CI) | 4.88 [1.70, 13.97] |
| 4 BtB (2500‐10,000 U) versus Placebo Show forest plot | 1 | 122 | Peto Odds Ratio (Peto, Fixed, 95% CI) | 3.13 [1.34, 7.34] |
| 5 BtB (2500‐5000 U) versus BtB (10,000 U) Show forest plot | 1 | 92 | Peto Odds Ratio (Peto, Fixed, 95% CI) | 0.56 [0.23, 1.33] |
| Outcome or subgroup title | No. of studies | No. of participants | Statistical method | Effect size |
| 1 2500 U BtB versus Placebo Show forest plot | 1 | 61 | Peto Odds Ratio (Peto, Fixed, 95% CI) | 1.70 [0.39, 7.42] |
| 2 5000 U BtB versus Placebo Show forest plot | 1 | 61 | Peto Odds Ratio (Peto, Fixed, 95% CI) | 3.27 [0.93, 11.44] |
| 3 10,000 U BtB vs Placebo Show forest plot | 1 | 60 | Peto Odds Ratio (Peto, Fixed, 95% CI) | 3.42 [0.97, 11.99] |
| 4 BtB (2500‐10,000U) versus Placebo Show forest plot | 1 | 122 | Peto Odds Ratio (Peto, Fixed, 95% CI) | 2.43 [0.89, 6.61] |
| 5 BtB (2500‐5000 U) versus BtB (10,000 U) Show forest plot | 1 | 92 | Peto Odds Ratio (Peto, Fixed, 95% CI) | 0.68 [0.25, 1.84] |
| Outcome or subgroup title | No. of studies | No. of participants | Statistical method | Effect size |
| 1 2500 U BtB versus Placebo Show forest plot | 1 | 61 | Peto Odds Ratio (Peto, Fixed, 95% CI) | 0.48 [0.05, 4.85] |
| 2 5000 U BtB versus Placebo Show forest plot | 1 | 61 | Peto Odds Ratio (Peto, Fixed, 95% CI) | 2.99 [0.68, 13.07] |
| 3 10,000 U BtB versus Placebo Show forest plot | 1 | 60 | Peto Odds Ratio (Peto, Fixed, 95% CI) | 2.60 [0.54, 12.40] |
| 4 BtB (2500‐10,000 U) versus Placebo Show forest plot | 1 | 122 | Peto Odds Ratio (Peto, Fixed, 95% CI) | 1.86 [0.51, 6.75] |
| 5 BtB (2500‐5000 U) versus BtB (10,000 U) Show forest plot | 1 | 92 | Peto Odds Ratio (Peto, Fixed, 95% CI) | 0.63 [0.17, 2.27] |
| Outcome or subgroup title | No. of studies | No. of participants | Statistical method | Effect size |
| 1 2500 U BtB versus Placebo Show forest plot | 1 | 61 | Peto Odds Ratio (Peto, Fixed, 95% CI) | 2.59 [0.91, 7.38] |
| 2 5000 U BtB versus Placebo Show forest plot | 1 | 61 | Peto Odds Ratio (Peto, Fixed, 95% CI) | 4.60 [1.68, 12.60] |
| 3 10,000 U BtB versus Placebo Show forest plot | 1 | 60 | Peto Odds Ratio (Peto, Fixed, 95% CI) | 3.09 [1.09, 8.76] |
| 4 BtB (2500‐10,000 U) versus Placebo Show forest plot | 1 | 122 | Peto Odds Ratio (Peto, Fixed, 95% CI) | 3.18 [1.39, 7.24] |
| 5 BtB (2500‐5000 U) versus BtB (10,000 U) Show forest plot | 1 | 92 | Peto Odds Ratio (Peto, Fixed, 95% CI) | 1.14 [0.48, 2.71] |
| Outcome or subgroup title | No. of studies | No. of participants | Statistical method | Effect size |
| 1 2500 U BtB versus Placebo Show forest plot | 1 | 61 | Peto Odds Ratio (Peto, Fixed, 95% CI) | 4.30 [1.54, 12.01] |
| 2 5000 U BtB versuss Placebo Show forest plot | 1 | 61 | Peto Odds Ratio (Peto, Fixed, 95% CI) | 3.07 [1.06, 8.88] |
| 3 10,000 U BtB versus Placebo Show forest plot | 1 | 60 | Peto Odds Ratio (Peto, Fixed, 95% CI) | 6.48 [2.35, 17.84] |
| 4 BtB (2500‐10,000 U) versus Placebo Show forest plot | 1 | 122 | Peto Odds Ratio (Peto, Fixed, 95% CI) | 4.10 [1.80, 9.34] |
| 5 BtB (2500‐5000 U) versus BtB (10,000 U) Show forest plot | 1 | 92 | Peto Odds Ratio (Peto, Fixed, 95% CI) | 0.51 [0.21, 1.23] |
| Outcome or subgroup title | No. of studies | No. of participants | Statistical method | Effect size |
| 1 2500 U BtB versus Placebo Show forest plot | 1 | 61 | Peto Odds Ratio (Peto, Fixed, 95% CI) | 2.31 [0.85, 6.26] |
| 2 5000 U BtB versus Placebo Show forest plot | 1 | 61 | Peto Odds Ratio (Peto, Fixed, 95% CI) | 2.63 [0.97, 7.13] |
| 3 10,000 U BtB versus Placebo Show forest plot | 1 | 60 | Peto Odds Ratio (Peto, Fixed, 95% CI) | 6.07 [2.16, 17.03] |
| 4 BtB (2500‐10,000U) versus Placebo Show forest plot | 1 | 122 | Peto Odds Ratio (Peto, Fixed, 95% CI) | 3.48 [1.49, 8.13] |
| 5 BtB (2500‐5000 U) versus BtB (10,000 U) Show forest plot | 1 | 92 | Peto Odds Ratio (Peto, Fixed, 95% CI) | 0.39 [0.15, 0.99] |
| Outcome or subgroup title | No. of studies | No. of participants | Statistical method | Effect size |
| 1 10,000U BtB versus Placebo Show forest plot | 2 | 150 | Mean Difference (IV, Fixed, 95% CI) | ‐5.92 [‐9.61, ‐2.23] |
| 1.1 BtA resistant patients | 1 | 77 | Mean Difference (IV, Fixed, 95% CI) | ‐7.40 [‐12.38, ‐2.42] |
| 1.2 BtA responder patients | 1 | 73 | Mean Difference (IV, Fixed, 95% CI) | ‐4.10 [‐9.61, 1.41] |
| 2 5000 U BtB versus Placebo Show forest plot | 1 | 72 | Mean Difference (IV, Fixed, 95% CI) | ‐2.20 [‐8.44, 4.04] |
| 2.1 BtA responder patients | 1 | 72 | Mean Difference (IV, Fixed, 95% CI) | ‐2.20 [‐8.44, 4.04] |
| 3 10,000U BtB versus 5000 U BoNT/B Show forest plot | 1 | 73 | Mean Difference (IV, Fixed, 95% CI) | ‐1.90 [‐8.23, 4.43] |
| 3.1 BtA responder patients | 1 | 73 | Mean Difference (IV, Fixed, 95% CI) | ‐1.90 [‐8.23, 4.43] |
| Outcome or subgroup title | No. of studies | No. of participants | Statistical method | Effect size |
| 1 10,000U BtB versus Placebo Show forest plot | 2 | 150 | Mean Difference (IV, Fixed, 95% CI) | ‐4.46 [‐8.19, ‐0.73] |
| 1.1 BtA resistant patients | 1 | 77 | Mean Difference (IV, Fixed, 95% CI) | ‐5.5 [‐10.26, ‐0.74] |
| 1.2 BtA responder patients | 1 | 73 | Mean Difference (IV, Fixed, 95% CI) | ‐2.80 [‐8.81, 3.21] |
| 2 5000 U BtB versus Placebo Show forest plot | 1 | 72 | Mean Difference (IV, Fixed, 95% CI) | ‐1.90 [‐8.30, 4.50] |
| 2.1 BtA responder patients | 1 | 72 | Mean Difference (IV, Fixed, 95% CI) | ‐1.90 [‐8.30, 4.50] |
| 3 10,000 U BtB versus 5000 U BtB Show forest plot | 1 | 73 | Mean Difference (IV, Fixed, 95% CI) | ‐0.90 [‐7.13, 5.33] |
| 3.1 BtA responder patients | 1 | 73 | Mean Difference (IV, Fixed, 95% CI) | ‐0.90 [‐7.13, 5.33] |
| Outcome or subgroup title | No. of studies | No. of participants | Statistical method | Effect size |
| 1 10,000 U BtB versus Placebo Show forest plot | 2 | 150 | Mean Difference (IV, Fixed, 95% CI) | ‐1.72 [‐5.57, 2.13] |
| 1.1 BtA resistant patients | 1 | 77 | Mean Difference (IV, Fixed, 95% CI) | ‐3.70 [‐8.95, 1.55] |
| 1.2 BtA responder patients | 1 | 73 | Mean Difference (IV, Fixed, 95% CI) | 0.60 [‐5.07, 6.27] |
| 2 5000 U BtB versus Placebo Show forest plot | 1 | 72 | Mean Difference (IV, Fixed, 95% CI) | 0.70 [‐5.10, 6.50] |
| 2.1 BtA responder patients | 1 | 72 | Mean Difference (IV, Fixed, 95% CI) | 0.70 [‐5.10, 6.50] |
| 3 10,000U BtB versus 5000 U BtB Show forest plot | 1 | 73 | Mean Difference (IV, Fixed, 95% CI) | ‐0.10 [‐5.75, 5.55] |
| 3.1 BtA responder patients | 1 | 73 | Mean Difference (IV, Fixed, 95% CI) | ‐0.10 [‐5.75, 5.55] |
| Outcome or subgroup title | No. of studies | No. of participants | Statistical method | Effect size |
| 1 10,000U BtB versus Placebo Show forest plot | 2 | 150 | Mean Difference (IV, Fixed, 95% CI) | 1.54 [‐2.21, 5.30] |
| 1.1 BtA resistant patients | 1 | 77 | Mean Difference (IV, Fixed, 95% CI) | ‐1.30 [‐6.40, 3.80] |
| 1.2 BtA responder patients | 1 | 73 | Mean Difference (IV, Fixed, 95% CI) | 4.90 [‐0.65, 10.45] |
| 2 5000 U BtB versus Placebo Show forest plot | 1 | 72 | Mean Difference (IV, Fixed, 95% CI) | 2.20 [‐3.77, 8.17] |
| 2.1 BtA responder patients | 1 | 72 | Mean Difference (IV, Fixed, 95% CI) | 2.20 [‐3.77, 8.17] |
| 3 10,000 U BtB versus 5000 U BtB Show forest plot | 1 | 73 | Mean Difference (IV, Fixed, 95% CI) | 2.80 [‐2.39, 7.99] |
| 3.1 BtA responder patients | 1 | 73 | Mean Difference (IV, Fixed, 95% CI) | 2.80 [‐2.39, 7.99] |
| Outcome or subgroup title | No. of studies | No. of participants | Statistical method | Effect size |
| 1 10,000 U BtB versus Placebo Show forest plot | 1 | 77 | Mean Difference (IV, Fixed, 95% CI) | ‐2.10 [‐4.39, 0.19] |
| 1.1 BtA resistant patients | 1 | 77 | Mean Difference (IV, Fixed, 95% CI) | ‐2.10 [‐4.39, 0.19] |
| Outcome or subgroup title | No. of studies | No. of participants | Statistical method | Effect size |
| 1 10,000 U BtB versus Placebo Show forest plot | 1 | 77 | Mean Difference (IV, Fixed, 95% CI) | ‐1.60 [‐3.77, 0.57] |
| 1.1 BtA resistant patients | 1 | 77 | Mean Difference (IV, Fixed, 95% CI) | ‐1.60 [‐3.77, 0.57] |
| Outcome or subgroup title | No. of studies | No. of participants | Statistical method | Effect size |
| 1 10,000,U BtB versus Placebo Show forest plot | 1 | 77 | Mean Difference (IV, Fixed, 95% CI) | ‐3.70 [‐5.64, ‐1.76] |
| 1.1 BtA resistant patients | 1 | 77 | Mean Difference (IV, Fixed, 95% CI) | ‐3.70 [‐5.64, ‐1.76] |
| Outcome or subgroup title | No. of studies | No. of participants | Statistical method | Effect size |
| 1 10,000 U BtB versus Placebo Show forest plot | 2 | 150 | Mean Difference (IV, Fixed, 95% CI) | 20.84 [14.22, 27.45] |
| 1.1 BtA resistant patients | 1 | 77 | Mean Difference (IV, Fixed, 95% CI) | 20.70 [11.73, 29.67] |
| 1.2 BtA responder patients | 1 | 73 | Mean Difference (IV, Fixed, 95% CI) | 21.00 [11.20, 30.80] |
| 2 5000 U BtB versus Placebo Show forest plot | 1 | 72 | Mean Difference (IV, Fixed, 95% CI) | 17.0 [6.93, 27.07] |
| 2.1 BtA responder patients | 1 | 72 | Mean Difference (IV, Fixed, 95% CI) | 17.0 [6.93, 27.07] |
| 3 10,000U BtB versus 5000 U BtB Show forest plot | 1 | 73 | Mean Difference (IV, Fixed, 95% CI) | 4.00 [‐5.85, 13.85] |
| 3.1 BtA responder patients | 1 | 73 | Mean Difference (IV, Fixed, 95% CI) | 4.00 [‐5.85, 13.85] |
| Outcome or subgroup title | No. of studies | No. of participants | Statistical method | Effect size |
| 1 10,000U BtB versus Placebo Show forest plot | 2 | 150 | Mean Difference (IV, Fixed, 95% CI) | 12.52 [7.97, 17.08] |
| 1.1 BtA resistant patients | 1 | 77 | Mean Difference (IV, Fixed, 95% CI) | 12.70 [7.04, 18.36] |
| 1.2 BtA responder patients | 1 | 73 | Mean Difference (IV, Fixed, 95% CI) | 12.20 [4.50, 19.90] |
| 2 5000 U BtB versus Placebo Show forest plot | 1 | 72 | Mean Difference (IV, Fixed, 95% CI) | 13.30 [5.10, 21.50] |
| 2.1 BtA responder patients | 1 | 72 | Mean Difference (IV, Fixed, 95% CI) | 13.30 [5.10, 21.50] |
| 3 10,000 U BtB versus 5000 U BtB Show forest plot | 1 | 73 | Mean Difference (IV, Fixed, 95% CI) | ‐1.10 [‐8.92, 6.72] |
| 3.1 BtA responder patients | 1 | 73 | Mean Difference (IV, Fixed, 95% CI) | ‐1.10 [‐8.92, 6.72] |
| Outcome or subgroup title | No. of studies | No. of participants | Statistical method | Effect size |
| 1 10,000U BtB versus Placebo Show forest plot | 2 | 150 | Mean Difference (IV, Fixed, 95% CI) | 19.63 [11.69, 27.56] |
| 1.1 BtA resistant patients | 1 | 77 | Mean Difference (IV, Fixed, 95% CI) | 20.40 [9.90, 30.90] |
| 1.2 BtA responder patients | 1 | 73 | Mean Difference (IV, Fixed, 95% CI) | 18.60 [6.50, 30.70] |
| 2 5000 U BtB versus Placebo Show forest plot | 1 | 72 | Mean Difference (IV, Fixed, 95% CI) | 18.0 [5.69, 30.31] |
| 2.1 BtA responder patients | 1 | 72 | Mean Difference (IV, Fixed, 95% CI) | 18.0 [5.69, 30.31] |
| 3 10,000 U BtB versus 5000 U BtB Show forest plot | 1 | 73 | Mean Difference (IV, Fixed, 95% CI) | 0.60 [‐11.33, 12.53] |
| 3.1 BtA responder patients | 1 | 73 | Mean Difference (IV, Fixed, 95% CI) | 0.60 [‐11.33, 12.53] |
| Outcome or subgroup title | No. of studies | No. of participants | Statistical method | Effect size |
| 1 5000 U BtB versus Placebo Show forest plot | 1 | 72 | Peto Odds Ratio (Peto, Fixed, 95% CI) | 1.58 [0.42, 5.96] |
| 2 10,000 U BtB versus Placebo Show forest plot | 2 | 150 | Peto Odds Ratio (Peto, Fixed, 95% CI) | 1.90 [0.72, 4.99] |
| 3 BtB (5000‐10,000 U) vs Placebo Show forest plot | 2 | 186 | Peto Odds Ratio (Peto, Fixed, 95% CI) | 2.10 [0.84, 5.24] |
| 4 BtB (5000 U) versus BtB (10,000 U) Show forest plot | 1 | 73 | Peto Odds Ratio (Peto, Fixed, 95% CI) | 1.83 [0.51, 6.52] |
| Outcome or subgroup title | No. of studies | No. of participants | Statistical method | Effect size |
| 1 2500 U BtB versus Placebo Show forest plot | 1 | 61 | Peto Odds Ratio (Peto, Fixed, 95% CI) | 0.97 [0.06, 15.84] |
| 2 5000 U BtB versus Placebo Show forest plot | 2 | 133 | Peto Odds Ratio (Peto, Fixed, 95% CI) | 3.55 [0.99, 12.76] |
| 3 10,000 U BtB versus Placebo Show forest plot | 3 | 210 | Peto Odds Ratio (Peto, Fixed, 95% CI) | 7.76 [3.87, 15.54] |
| 4 BtB (2500‐10,000 U) vs Placebo Show forest plot | 3 | 307 | Peto Odds Ratio (Peto, Fixed, 95% CI) | 5.19 [2.69, 10.03] |
| 5 BtB (2500‐5000 U) versus BtB (10,000 U) Show forest plot | 2 | 167 | Peto Odds Ratio (Peto, Fixed, 95% CI) | 0.19 [0.09, 0.40] |
| Outcome or subgroup title | No. of studies | No. of participants | Statistical method | Effect size |
| 1 2500 U BtB versus Placebo Show forest plot | 1 | 61 | Peto Odds Ratio (Peto, Fixed, 95% CI) | 8.23 [1.34, 50.56] |
| 2 5000 U BtB versus Placebo Show forest plot | 2 | 133 | Peto Odds Ratio (Peto, Fixed, 95% CI) | 4.77 [1.15, 19.74] |
| 3 10,000 U BtB versus Placebo Show forest plot | 3 | 210 | Peto Odds Ratio (Peto, Fixed, 95% CI) | 6.20 [2.87, 13.37] |
| 4 BtB (2500‐10,000 U) versus Placebo Show forest plot | 3 | 308 | Peto Odds Ratio (Peto, Fixed, 95% CI) | 4.37 [2.18, 8.79] |
| 5 BtB (2500‐5000 U) versus BtB (10,000 U) Show forest plot | 2 | 165 | Peto Odds Ratio (Peto, Fixed, 95% CI) | 0.42 [0.18, 0.98] |
| Outcome or subgroup title | No. of studies | No. of participants | Statistical method | Effect size |
| 1 2500 U BtB versus Placebo Show forest plot | 1 | 61 | Peto Odds Ratio (Peto, Fixed, 95% CI) | 0.70 [0.15, 3.35] |
| 2 5000 U BtB versus Placebo Show forest plot | 2 | 133 | Peto Odds Ratio (Peto, Fixed, 95% CI) | 1.09 [0.46, 2.56] |
| 3 10,000 U BtB versus Placebo Show forest plot | 3 | 210 | Peto Odds Ratio (Peto, Fixed, 95% CI) | 1.22 [0.63, 2.33] |
| 4 BtB (2500‐10,000 U) versus Placebo Show forest plot | 3 | 308 | Peto Odds Ratio (Peto, Fixed, 95% CI) | 1.10 [0.60, 1.99] |
| 5 BtB (2500‐5000 U) versus BtB (10,000 U) Show forest plot | 2 | 165 | Peto Odds Ratio (Peto, Fixed, 95% CI) | 0.71 [0.33, 1.56] |
| Outcome or subgroup title | No. of studies | No. of participants | Statistical method | Effect size |
| 1 2500 U BtB versus Placebo Show forest plot | 1 | 61 | Peto Odds Ratio (Peto, Fixed, 95% CI) | 7.94 [1.06, 59.29] |
| 2 5000 U BtB versus Placebo Show forest plot | 2 | 133 | Peto Odds Ratio (Peto, Fixed, 95% CI) | 1.39 [0.55, 3.49] |
| 3 10,000 U BtB versus Placebo Show forest plot | 3 | 210 | Peto Odds Ratio (Peto, Fixed, 95% CI) | 0.97 [0.46, 2.07] |
| 4 BtB (2500‐10,000U) versus Placebo Show forest plot | 3 | 308 | Peto Odds Ratio (Peto, Fixed, 95% CI) | 1.16 [0.61, 2.24] |
| 5 BtB (2500‐5000 U) versus BtB (10,000 U) Show forest plot | 2 | 165 | Peto Odds Ratio (Peto, Fixed, 95% CI) | 1.59 [0.66, 3.81] |
| Outcome or subgroup title | No. of studies | No. of participants | Statistical method | Effect size |
| 1 2500 U BtB versus Placebo Show forest plot | 1 | 61 | Peto Odds Ratio (Peto, Fixed, 95% CI) | 1.70 [0.39, 7.42] |
| 2 5000 U BtB versus Placebo Show forest plot | 2 | 133 | Peto Odds Ratio (Peto, Fixed, 95% CI) | 1.34 [0.44, 4.07] |
| 3 10,000 U BtB versus Placebo Show forest plot | 3 | 210 | Peto Odds Ratio (Peto, Fixed, 95% CI) | 1.84 [0.80, 4.21] |
| 4 BtB (2500‐10,000 U) versus Placebo Show forest plot | 3 | 308 | Peto Odds Ratio (Peto, Fixed, 95% CI) | 1.66 [0.79, 3.48] |
| 5 BtB (2500‐5000 U) versus BtB (10,000 U) Show forest plot | 2 | 165 | Peto Odds Ratio (Peto, Fixed, 95% CI) | 0.84 [0.33, 2.16] |
| Outcome or subgroup title | No. of studies | No. of participants | Statistical method | Effect size |
| 1 2500 U BtB versus Placebo Show forest plot | 1 | 61 | Peto Odds Ratio (Peto, Fixed, 95% CI) | 1.48 [0.24, 9.10] |
| 2 5000 U BtB versus Placebo Show forest plot | 2 | 133 | Peto Odds Ratio (Peto, Fixed, 95% CI) | 2.34 [0.82, 6.69] |
| 3 10,000 U BtB versus Placebo Show forest plot | 2 | 133 | Peto Odds Ratio (Peto, Fixed, 95% CI) | 1.84 [0.61, 5.54] |
| 4 BtB (2500‐10,000U) versus Placebo Show forest plot | 2 | 231 | Peto Odds Ratio (Peto, Fixed, 95% CI) | 1.92 [0.81, 4.59] |
| 5 BtB (2500‐5000 U) versus BtB (10,000 U) Show forest plot | 2 | 165 | Peto Odds Ratio (Peto, Fixed, 95% CI) | 1.25 [0.50, 3.09] |
| Outcome or subgroup title | No. of studies | No. of participants | Statistical method | Effect size |
| 1 2500 U BtB versus Placebo Show forest plot | 1 | 61 | Peto Odds Ratio (Peto, Fixed, 95% CI) | 7.40 [0.45, 121.11] |
| 2 5000 U BtB versus Placebo Show forest plot | 1 | 61 | Peto Odds Ratio (Peto, Fixed, 95% CI) | 7.66 [0.77, 76.54] |
| 3 10,000 U BtB versus Placebo Show forest plot | 1 | 60 | Peto Odds Ratio (Peto, Fixed, 95% CI) | 7.93 [0.79, 79.26] |
| 4 BtB (2500‐10,000 U) versus Placebo Show forest plot | 1 | 122 | Peto Odds Ratio (Peto, Fixed, 95% CI) | 4.09 [0.78, 21.44] |
| 5 BtB (2500‐5000 U) versus BtB (10,000 U) Show forest plot | 1 | 92 | Peto Odds Ratio (Peto, Fixed, 95% CI) | 0.96 [0.22, 4.15] |
| Outcome or subgroup title | No. of studies | No. of participants | Statistical method | Effect size |
| 1 2500 U BtB versus Placebo Show forest plot | 1 | 61 | Peto Odds Ratio (Peto, Fixed, 95% CI) | 2.77 [0.37, 20.69] |
| 2 5000 U BtB versus Placebo Show forest plot | 1 | 61 | Peto Odds Ratio (Peto, Fixed, 95% CI) | 0.97 [0.06, 15.84] |
| 3 10,000 U BtB versus Placebo Show forest plot | 2 | 137 | Peto Odds Ratio (Peto, Fixed, 95% CI) | 2.28 [0.73, 7.12] |
| 4 BtB (2500‐10,000 U) versus Placebo Show forest plot | 2 | 199 | Peto Odds Ratio (Peto, Fixed, 95% CI) | 2.03 [0.70, 5.86] |
| 5 BtB (2500‐5000 U) versus BtB (10,000 U) Show forest plot | 1 | 92 | Peto Odds Ratio (Peto, Fixed, 95% CI) | 0.61 [0.12, 3.11] |
| Outcome or subgroup title | No. of studies | No. of participants | Statistical method | Effect size |
| 1 2500 U BtB versus Placebo Show forest plot | 1 | 61 | Peto Odds Ratio (Peto, Fixed, 95% CI) | 0.97 [0.13, 7.22] |
| 2 5000 U BtB versus Placebo Show forest plot | 2 | 133 | Peto Odds Ratio (Peto, Fixed, 95% CI) | 0.69 [0.21, 2.23] |
| 3 10,000 U BtB versus Placebo Show forest plot | 2 | 133 | Peto Odds Ratio (Peto, Fixed, 95% CI) | 1.82 [0.68, 4.82] |
| 4 BtB (2500‐10,000 U) versus Placebo Show forest plot | 2 | 231 | Peto Odds Ratio (Peto, Fixed, 95% CI) | 1.17 [0.48, 2.87] |
| 5 BtB (2500‐5000 U) vs BtB (10,000 U) Show forest plot | 2 | 165 | Peto Odds Ratio (Peto, Fixed, 95% CI) | 0.38 [0.14, 1.03] |
| Outcome or subgroup title | No. of studies | No. of participants | Statistical method | Effect size |
| 1 5000 U BtB versus Placebo Show forest plot | 1 | 72 | Peto Odds Ratio (Peto, Fixed, 95% CI) | 0.35 [0.05, 2.61] |
| 2 10,000 U BtB versus Placebo Show forest plot | 1 | 73 | Peto Odds Ratio (Peto, Fixed, 95% CI) | 1.33 [0.28, 6.23] |
| 3 BtB (5000‐10,000 U) versus Placebo Show forest plot | 1 | 109 | Peto Odds Ratio (Peto, Fixed, 95% CI) | 0.81 [0.18, 3.70] |
| 4 BtB (5000 U) versus BtB (10,000 U) Show forest plot | 1 | 73 | Peto Odds Ratio (Peto, Fixed, 95% CI) | 0.29 [0.05, 1.75] |