Adhesivos tisulares para el cierre de las incisiones quirúrgicas
Información
- DOI:
- https://doi.org/10.1002/14651858.CD004287.pub4Copiar DOI

- Base de datos:
-
- Cochrane Database of Systematic Reviews
- Versión publicada:
-
- 28 noviembre 2014see what's new
- Tipo:
-
- Intervention
- Etapa:
-
- Review
- Grupo Editorial Cochrane:
-
Grupo Cochrane de Heridas
- Copyright:
-
- Copyright © 2014 The Cochrane Collaboration. Published by John Wiley & Sons, Ltd.
Cifras del artículo
Altmetric:
Citado por:
Autores
Contributions of authors
Jo Dumville: coordinated the second review update. Extracted data and checked quality of data extraction. Undertook and checked quality assessment. Analysed and interpreted data. Performed statistical analysis and checked quality of statistical analysis. Performed part of writing and editing the review. Approved final review update prior to submission. Secured funding. Is the guarantor of the review.
Paul Coulthard: conceived, designed and co‐ordinated the initial review. Undertook the searches for the original review and screened search results. Appraised quality and extracted data, wrote to trial authors for additional information. Managed data for the review and entered data into RevMan. Analysed and interpreted data and wrote the review. Undertook previous work that was the foundation of the current review. Approved final review update prior to submission.
Philip Riley: analysed and interpreted data for the second review update. Performed statistical analysis and checked quality of statistical analysis. Performed part of writing and editing the review. Approved final review update prior to submission.
Helen Worthington: analysed and interpreted data for all versions of the review. Performed statistical analysis and checked quality of statistical analysis. Performed part of writing and editing the review. screened search output for the second update. Approved final review update prior to submission
Neil Patel: undertook quality assessment and checked quality assessment for the first update. Performed part of writing and editing the review. Approved final review update prior to submission.
Marco Esposito: developed the search strategy, undertook the searches for the original review and advised on the review and commented on all updates of the review.
Maarten van der Elst: Provided general advice on the original version of the review and undertook previous work that was the foundation of the current review.
Oscar JF van Waes: screened search results against the inclusion criteria and retrieved papers, appraised quality and extracted data, wrote to trial authors for additional information for the original version of the review. Undertook previous work that was the foundation of the current review.
James Darcey: screened search results against the inclusion criteria, retrieved papers, appraised quality and extracted data, wrote to trial authors for additional information for the for the first review update, managed data for the first review update and entered data into RevMan. Analysed and interpreted data and wrote the first review update.
Contributions of editorial base
Nicky Cullum: edited the review, advised on methodology, interpretation and review content. Approved the final review and review update prior to submission.
Sally Bell‐Syer: co‐ordinated the editorial process. Advised on methodology, interpretation and content. Edited and copy edited the review and the updated review.
Amanda Briant: ran the searches and edited the search methods section for the update.
Sources of support
Internal sources
-
The University of Manchester, UK.
-
Renier de Graaf Hospital, Netherlands.
-
The Sahlgrenska Academy at Goteborg University, Sweden.
External sources
-
Swedish Medical Research Council (9495), Sweden.
-
The Hjalmar Svensson Research Fund, Sweden.
-
The National Institute for Health Research (NIHR) is the sole funder of the Cochrane Wounds Group, UK.
Declarations of interest
Jo C Dumville: None known
Paul Coulthard: was a co‐author in the Blondeel 2004 study. This study was also commercially supported by Ethicon.
Philip Riley: None known
Helen V Worthington: None known
Neil Patel: None known
Marco Esposito: None known
Maarten van der Elst: None known
Oscar J F van Waes: None known
James Darcey: None known
Acknowledgements
We wish to thank Sally Bell‐Syer and Ruth Foxlee (Cochrane Wounds Group) for their assistance with literature searching the preparation of this review. We would also like to thank the following referees: Nicky Cullum, David Margolis, Michelle Briggs, Seokyung Hahn, James V Quinn, Ken Farion and Jac Dinnes. We also thank Matthew Fortnam who extracted data and checked quality of data extraction for this second review update.
Version history
| Published | Title | Stage | Authors | Version |
| 2014 Nov 28 | Tissue adhesives for closure of surgical incisions | Review | Jo C Dumville, Paul Coulthard, Helen V Worthington, Philip Riley, Neil Patel, James Darcey, Marco Esposito, Maarten van der Elst, Oscar J F van Waes | |
| 2010 May 12 | Tissue adhesives for closure of surgical incisions | Review | Paul Coulthard, Marco Esposito, Helen V Worthington, Maarten van der Elst, Oscar J F van Waes, James Darcey | |
| 2002 Jul 22 | Tissue adhesives for closure of surgical incisions | Review | Paul Coulthard, Marco Esposito, Helen V Worthington, Maarten van der Elst, Oscar J F van Waes, James Darcey | |
| 2002 May 16 | Tissue adhesives for closure of surgical incisions | Protocol | Paul Coulthard, Helen V Worthington, Marco Esposito, Maarten van der Elst, F van Waes OJ, Oscar J F van Waes | |
Differences between protocol and review
Time to closure as an outcome measure was included in the review post hoc as the review authors believe this to be a contributory factor towards both cost‐effectiveness and satisfaction.
Keywords
MeSH
Medical Subject Headings (MeSH) Keywords
Medical Subject Headings Check Words
Humans;
PICO

Risk of bias summary: review authors' judgements about each risk of bias item for each included study

Risk of bias graph: review authors' judgements about each risk of bias item presented as percentages across all included studies
Comparison 1 Adhesive versus suture, Outcome 1 Dehiscence: all studies.
Comparison 1 Adhesive versus suture, Outcome 2 Dehiscence: sensitivity analysis.
Comparison 1 Adhesive versus suture, Outcome 3 Infection: all studies.
Comparison 1 Adhesive versus suture, Outcome 4 Infection: sensitivity analysis.

Comparison 1 Adhesive versus suture, Outcome 5 Cosmetic appearance rated by patient.
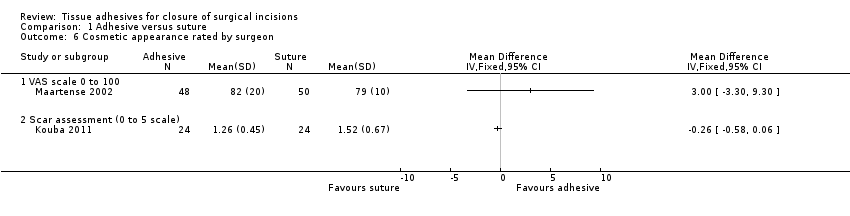
Comparison 1 Adhesive versus suture, Outcome 6 Cosmetic appearance rated by surgeon.

Comparison 1 Adhesive versus suture, Outcome 7 Patient/parent satisfaction (% satisfied).
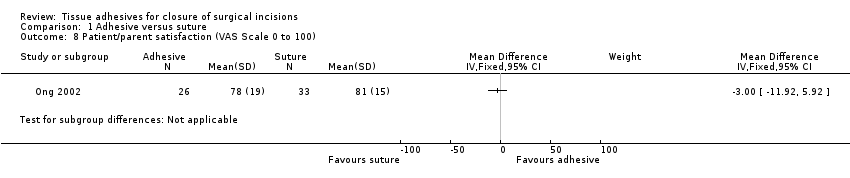
Comparison 1 Adhesive versus suture, Outcome 8 Patient/parent satisfaction (VAS Scale 0 to 100).

Comparison 1 Adhesive versus suture, Outcome 9 Surgeon satisfaction (% satisfied).
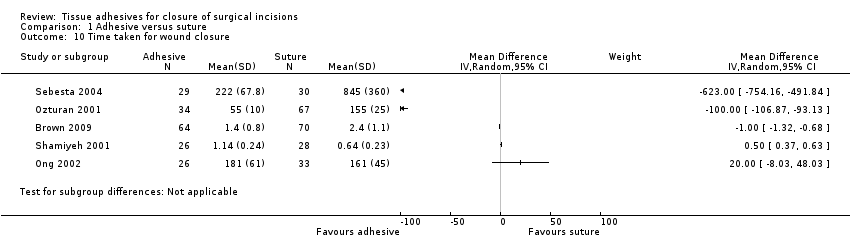
Comparison 1 Adhesive versus suture, Outcome 10 Time taken for wound closure.
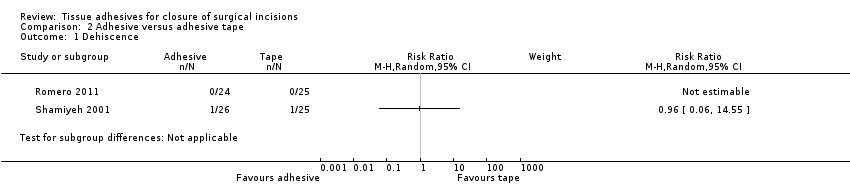
Comparison 2 Adhesive versus adhesive tape, Outcome 1 Dehiscence.
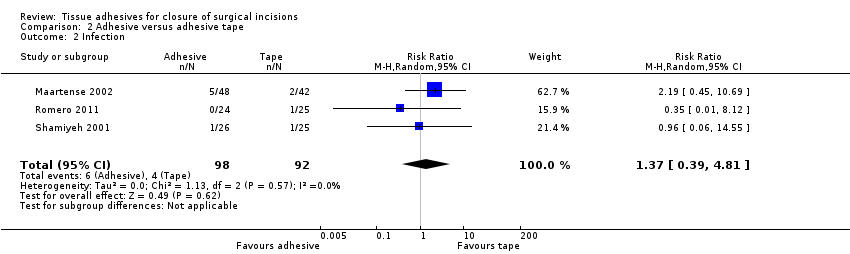
Comparison 2 Adhesive versus adhesive tape, Outcome 2 Infection.
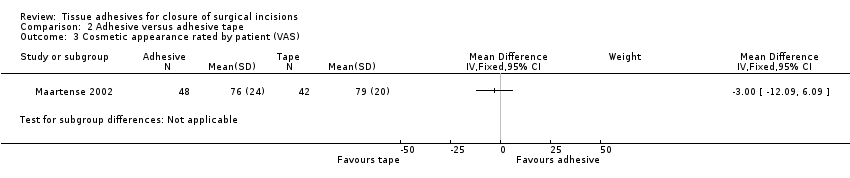
Comparison 2 Adhesive versus adhesive tape, Outcome 3 Cosmetic appearance rated by patient (VAS).

Comparison 2 Adhesive versus adhesive tape, Outcome 4 Cosmetic appearance rated by patient (% satisfied).
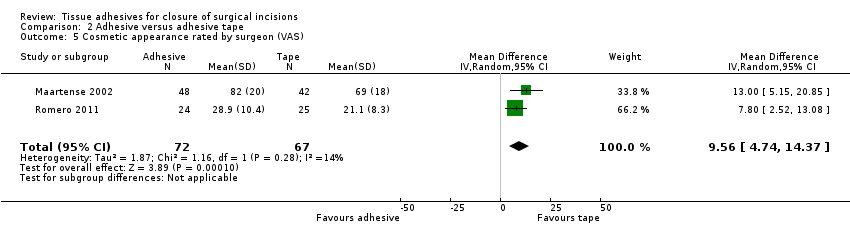
Comparison 2 Adhesive versus adhesive tape, Outcome 5 Cosmetic appearance rated by surgeon (VAS).

Comparison 2 Adhesive versus adhesive tape, Outcome 6 Patient satisfaction.
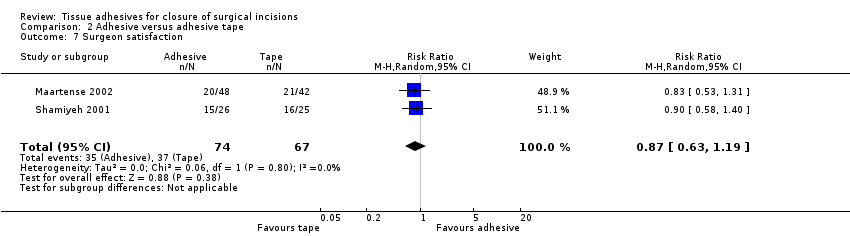
Comparison 2 Adhesive versus adhesive tape, Outcome 7 Surgeon satisfaction.
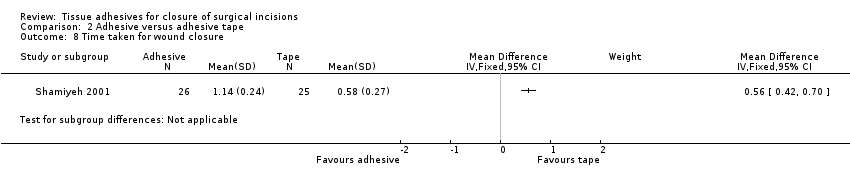
Comparison 2 Adhesive versus adhesive tape, Outcome 8 Time taken for wound closure.

Comparison 3 Adhesive versus staples, Outcome 1 Dehiscence.

Comparison 3 Adhesive versus staples, Outcome 2 Infection.

Comparison 3 Adhesive versus staples, Outcome 3 Cosmetic appearance rated by patient (scar scale).

Comparison 3 Adhesive versus staples, Outcome 4 Cosmetic appearance by plastic surgeons (VAS).
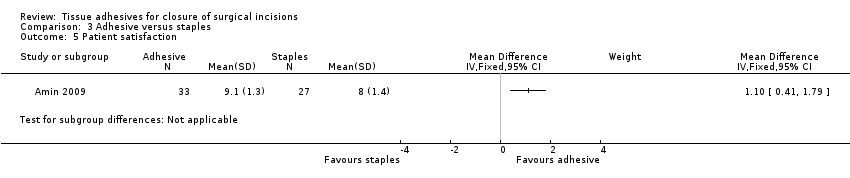
Comparison 3 Adhesive versus staples, Outcome 5 Patient satisfaction.
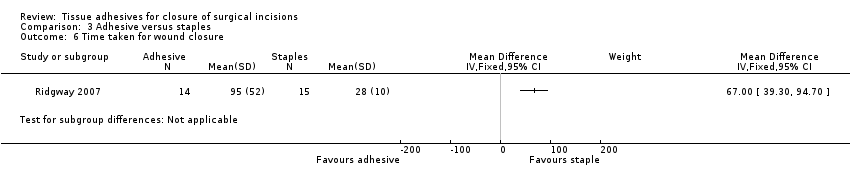
Comparison 3 Adhesive versus staples, Outcome 6 Time taken for wound closure.
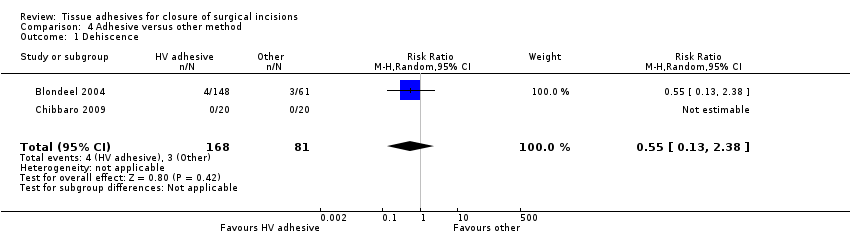
Comparison 4 Adhesive versus other method, Outcome 1 Dehiscence.

Comparison 4 Adhesive versus other method, Outcome 2 Infection.

Comparison 4 Adhesive versus other method, Outcome 3 Patient satisfaction.
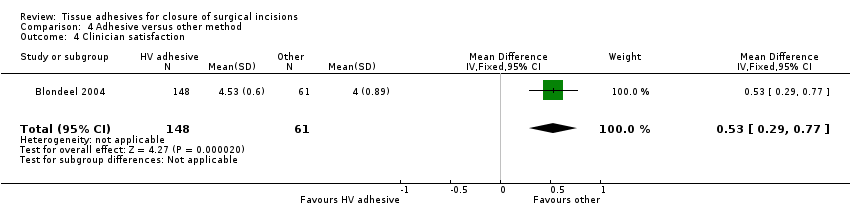
Comparison 4 Adhesive versus other method, Outcome 4 Clinician satisfaction.
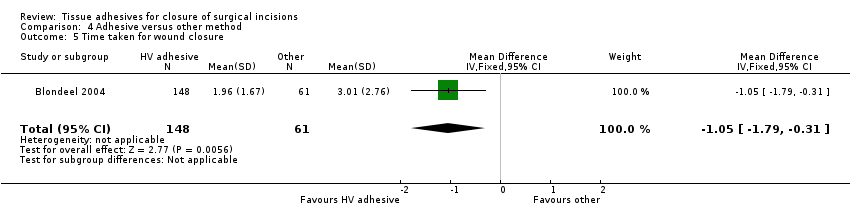
Comparison 4 Adhesive versus other method, Outcome 5 Time taken for wound closure.

Comparison 5 Adhesive versus adhesive: High viscosity versus low viscosity, Outcome 1 Dehiscence.
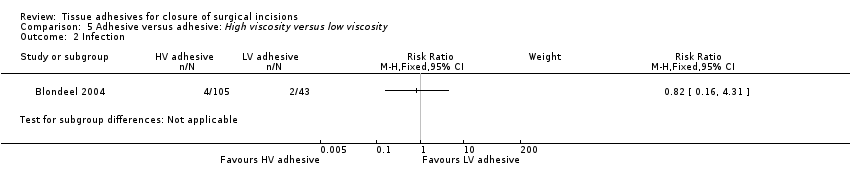
Comparison 5 Adhesive versus adhesive: High viscosity versus low viscosity, Outcome 2 Infection.

Comparison 5 Adhesive versus adhesive: High viscosity versus low viscosity, Outcome 3 Patient satisfaction.
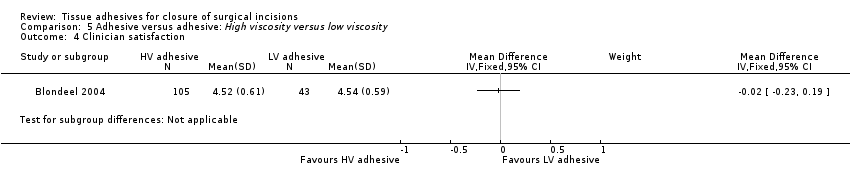
Comparison 5 Adhesive versus adhesive: High viscosity versus low viscosity, Outcome 4 Clinician satisfaction.
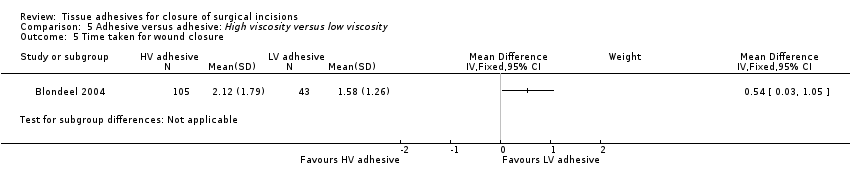
Comparison 5 Adhesive versus adhesive: High viscosity versus low viscosity, Outcome 5 Time taken for wound closure.
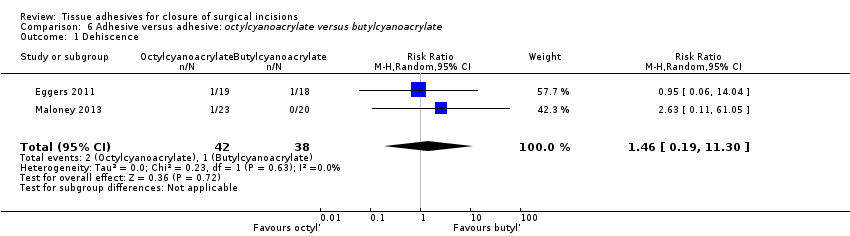
Comparison 6 Adhesive versus adhesive: octylcyanoacrylate versus butylcyanoacrylate, Outcome 1 Dehiscence.
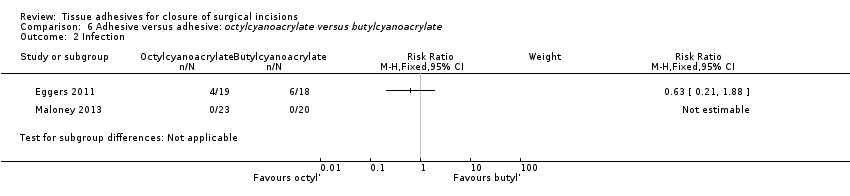
Comparison 6 Adhesive versus adhesive: octylcyanoacrylate versus butylcyanoacrylate, Outcome 2 Infection.
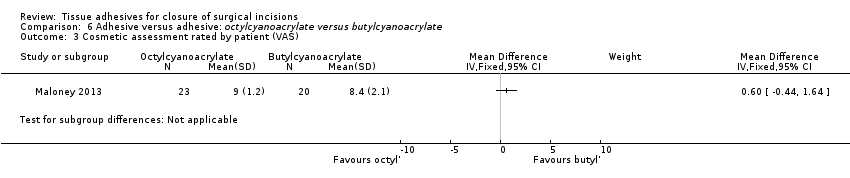
Comparison 6 Adhesive versus adhesive: octylcyanoacrylate versus butylcyanoacrylate, Outcome 3 Cosmetic assessment rated by patient (VAS).

Comparison 6 Adhesive versus adhesive: octylcyanoacrylate versus butylcyanoacrylate, Outcome 4 Cosmetic assessment rated by surgeon (VAS).
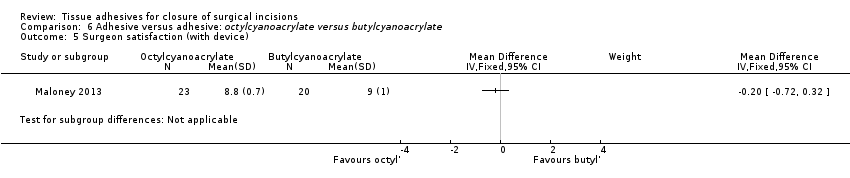
Comparison 6 Adhesive versus adhesive: octylcyanoacrylate versus butylcyanoacrylate, Outcome 5 Surgeon satisfaction (with device).

Comparison 6 Adhesive versus adhesive: octylcyanoacrylate versus butylcyanoacrylate, Outcome 6 Surgeon satisfaction (with closure).

Comparison 6 Adhesive versus adhesive: octylcyanoacrylate versus butylcyanoacrylate, Outcome 7 Time taken for wound closure.
| Tissue adhesive compared to sutures for surgical incisions | ||||||
| Patient or population: People with surgical incisions | ||||||
| Outcomes | Illustrative comparative risks*4 (95% CI) | Relative effect | No of participants | Quality of the evidence | Comments | |
| Assumed risk | Corresponding risk | |||||
| Sutures | Tissue adhesive | |||||
| Wound dehiscence | Study population | RR 3.35 | 736 | ⊕⊕⊝⊝ | ||
| 13 per 1000 | 45 per 1000 | |||||
| Moderate | ||||||
| Wound infection | Study population | RR 1.72 | 744 | ⊕⊝⊝⊝ | ||
| 38 per 1000 | 76 per 1000 | |||||
| Moderate | ||||||
| *The basis for the assumed risk (e.g. the median control group risk across studies) is provided in footnotes. The corresponding risk (and its 95% confidence interval) is based on the assumed risk in the comparison group and the relative effect of the intervention (and its 95% CI) | ||||||
| GRADE Working Group grades of evidence | ||||||
| 1 Possible unit of analyses issues. A sensitivity analysis changes a statistically significant difference to a non‐statistically significant difference | ||||||
| Tissue adhesive compared to adhesive tape for surgical incisions | ||||||
| Patient or population: people with surgical incisions | ||||||
| Outcomes | Illustrative comparative risks*3 (95% CI) | Relative effect | No of participants | Quality of the evidence | Comments | |
| Assumed risk | Corresponding risk | |||||
| Adhesive tape | Tissue adhesive | |||||
| Wound dehiscence | Study population | RR 0.96 | 50 | ⊕⊕⊝⊝ | ||
| 42 per 1000 | 40 per 1000 | |||||
| Moderate | ||||||
| Wound infection | Study population | RR 1.37 | 190 | ⊕⊕⊝⊝ | ||
| 43 per 1000 | 60 per 1000 | |||||
| Moderate | ||||||
| *The basis for the assumed risk (e.g. the median control group risk across studies) is provided in footnotes. The corresponding risk (and its 95% confidence interval) is based on the assumed risk in the comparison group and the relative effect of the intervention (and its 95% CI) | ||||||
| GRADE Working Group grades of evidence | ||||||
| 1 Study 95% CIs are very wide | ||||||
| Tissue adhesive compared to staples for surgical incisions | ||||||
| Patient or population: people with surgical incisions | ||||||
| Outcomes | Illustrative comparative risks*3 (95% CI) | Relative effect | No of participants | Quality of the evidence | Comments | |
| Assumed risk | Corresponding risk | |||||
| Staples | Tissue adhesive | |||||
| Wound dehiscence | Study population | RR 0.53 | 37 | ⊕⊕⊝⊝ | ||
| 105 per 1000 | 56 per 1000 | |||||
| Moderate | ||||||
| Wound infection | Study population | RR 1.39 | 250 | ⊕⊝⊝⊝ | ||
| 71 per 1000 | 99 per 1000 | |||||
| Moderate | ||||||
| *The basis for the assumed risk (e.g. the median control group risk across studies) is provided in footnotes. The corresponding risk (and its 95% confidence interval) is based on the assumed risk in the comparison group and the relative effect of the intervention (and its 95% CI). | ||||||
| GRADE Working Group grades of evidence | ||||||
| 1 Study 95% CIs are very wide. | ||||||
| Tissue adhesive compared to other methods for surgical incisions | ||||||
| Patient or population: people with surgical incisions | ||||||
| Outcomes | Illustrative comparative risks* (95% CI) | Relative effect | No of participants | Quality of the evidence | Comments | |
| Assumed risk | Corresponding risk | |||||
| Other methods | Tissue adhesive | |||||
| Wound dehiscence | Study population | RR 0.55 | 209 | ⊕⊕⊝⊝ | ||
| 49 per 1000 | 27 per 1000 | |||||
| Moderate | ||||||
| Wound infection | Study population | RR 0.41 | 209 | ⊕⊕⊝⊝ | ||
| 66 per 1000 | 27 per 1000 | |||||
| Moderate | ||||||
| *The basis for the assumed risk (e.g. the median control group risk across studies) is provided in footnotes. The corresponding risk (and its 95% confidence interval) is based on the assumed risk in the comparison group and the relative effect of the intervention (and its 95% CI) | ||||||
| GRADE Working Group grades of evidence | ||||||
| 1 Study 95% CIs are very wide | ||||||
| High viscosity tissue adhesive compared to low viscosity tissue adhesive for surgical incisions | ||||||
| Patient or population: people with surgical incisions | ||||||
| Outcomes | Illustrative comparative risks* (95% CI) | Relative effect | No of participants | Quality of the evidence | Comments | |
| Assumed risk | Corresponding risk | |||||
| Low viscosity tissue adhesive | High viscosity tissue adhesive | |||||
| Wound dehiscence | Study population | RR 3.74 | 148 | ⊕⊝⊝⊝ | ||
| Could not be calculated | Could not be calculated | |||||
| Wound infection | Study population | RR 0.82 | 148 | ⊕⊝⊝⊝ | ||
| 47 per 1000 | 38 per 1000 | |||||
| Moderate | ||||||
| *The basis for the assumed risk (e.g. the median control group risk across studies) is provided in footnotes. The corresponding risk (and its 95% confidence interval) is based on the assumed risk in the comparison group and the relative effect of the intervention (and its 95% CI) | ||||||
| GRADE Working Group grades of evidence | ||||||
| 1 Study 95% CIs are very wide | ||||||
| Octylcyanoacrylate compared to butylcyanoacrylate for surgical incisions | ||||||
| Patient or population: people with surgical incisions | ||||||
| Outcomes | Illustrative comparative risks*2 (95% CI) | Relative effect | No of participants | Quality of the evidence | Comments | |
| Assumed risk | Corresponding risk | |||||
| Butylcyanoacrylate | Octylcyanoacrylate | |||||
| Wound dehiscence | 26 per 1000 | 38 per 1000 (5 to 297) | RR 1.46 (0.19 to 11) | 80 | ⊕⊕⊝⊝ | |
| Wound infection | Study population | RR 0.63 | 37 | ⊕⊕⊝⊝ | ||
| 333 per 1000 | 210 per 1000 | |||||
| Moderate | ||||||
| *The basis for the assumed risk (e.g. the median control group risk across studies) is provided in footnotes. The corresponding risk (and its 95% confidence interval) is based on the assumed risk in the comparison group and the relative effect of the intervention (and its 95% CI) | ||||||
| GRADE Working Group grades of evidence | ||||||
| 1 The 95% CI estimate around the RR of 1.46 is very wide | ||||||
| Tissue adhesive vs tissue adhesive (Comp 5) | Mixed control (Comp 4) | Butyl‐2‐ cyanoacrylate vs staples (Comp 3) | 2‐octyl cyanoacrylate vs staples (Comp 3) | 2‐octyl cyanoacrylate vs tape (Comp 2) | Butyl‐2‐ cyanoacrylate vs sutures (Comp 1) | 2‐octyl cyanoacrylate vs sutures (Comp1) | Trial ID | 2‐octyl cyanoacrylate | Butyl‐2‐ cyanoacrylate | Sutures | Staples | Adhesive tape/strips | Mixed sutures and staples | All non‐tissue adhesive closure methods | Other viscosity 2‐octyl cyanoacrylate |
| 3 | ✓ | ✓ | |||||||||||||
| 1 | ✓ | ✓ | |||||||||||||
| 5 | 4 | ✓ | ✓ | ✓ | |||||||||||
| 1 | ✓ | ✓ | |||||||||||||
| 1 | ✓ | ✓ | |||||||||||||
| 4 | ✓ | ✓ | |||||||||||||
| 1 | ✓ | ✓ | |||||||||||||
| 5 | 3 | 3 | 1 | 1 | ✓ | ✓ | ✓ | ✓ | |||||||
| 1 | ✓ | ✓ | |||||||||||||
| 1 | ✓ | ✓ | |||||||||||||
| 1 | ✓ | ✓ | |||||||||||||
| 5 | ✓ | ✓ | |||||||||||||
| 3 | 1 | ✓ | ✓ | ✓ | |||||||||||
| 1 | ✓ | ✓ | |||||||||||||
| 1 | ✓ | ✓ | |||||||||||||
| 3 | ✓ | ✓ | |||||||||||||
| 2 | 1 | ✓ | ✓ | ✓ | |||||||||||
| 5 | ✓ | ✓ | |||||||||||||
| 1 | ✓ | ✓ | |||||||||||||
| 1 | ✓ | ✓ | |||||||||||||
| 1 | ✓ | ✓ | |||||||||||||
| 1 | ✓ | ✓ | |||||||||||||
| 3 | ✓ | ✓ | |||||||||||||
| 3 | ✓ | ✓ | |||||||||||||
| 1 | ✓ | ✓ | |||||||||||||
| 2 | 1 | ✓ | ✓ | ✓ | |||||||||||
| 1 | ✓ | ✓ | |||||||||||||
| 1 | ✓ | ✓ | |||||||||||||
| 1 | ✓ | ✓ | |||||||||||||
| 1 | ✓ | ✓ | |||||||||||||
| 1 | ✓ | ✓ | |||||||||||||
| 2 | ✓ | ✓ | |||||||||||||
| 1 | ✓ | ✓ | |||||||||||||
| Abbreviation Comp = comparison | |||||||||||||||
| Outcome or subgroup title | No. of studies | No. of participants | Statistical method | Effect size |
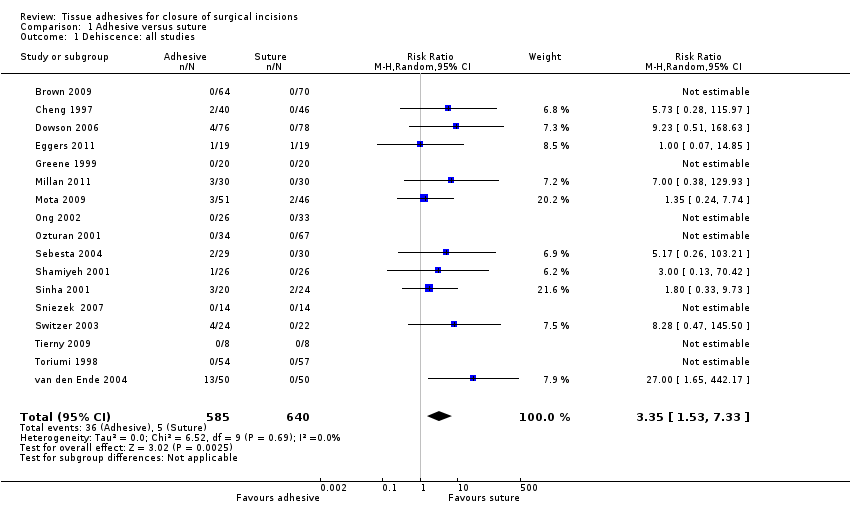
| 1 Dehiscence: all studies Show forest plot | 17 | 1225 | Risk Ratio (M‐H, Random, 95% CI) | 3.35 [1.53, 7.33] |
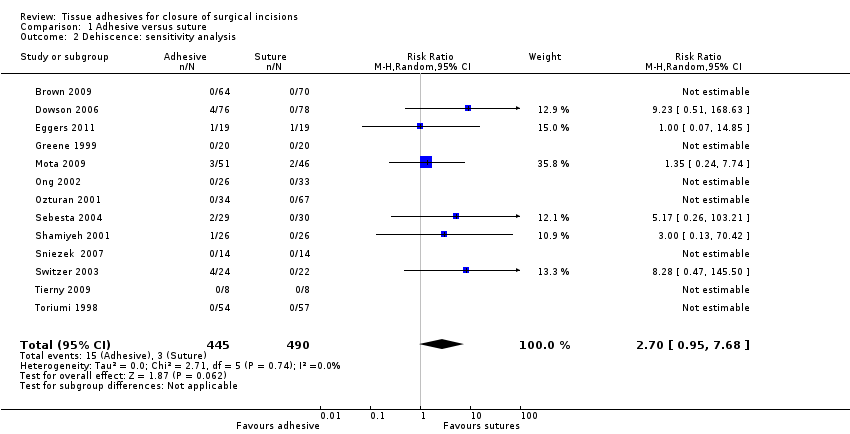
| 2 Dehiscence: sensitivity analysis Show forest plot | 13 | 935 | Risk Ratio (M‐H, Random, 95% CI) | 2.70 [0.95, 7.68] |
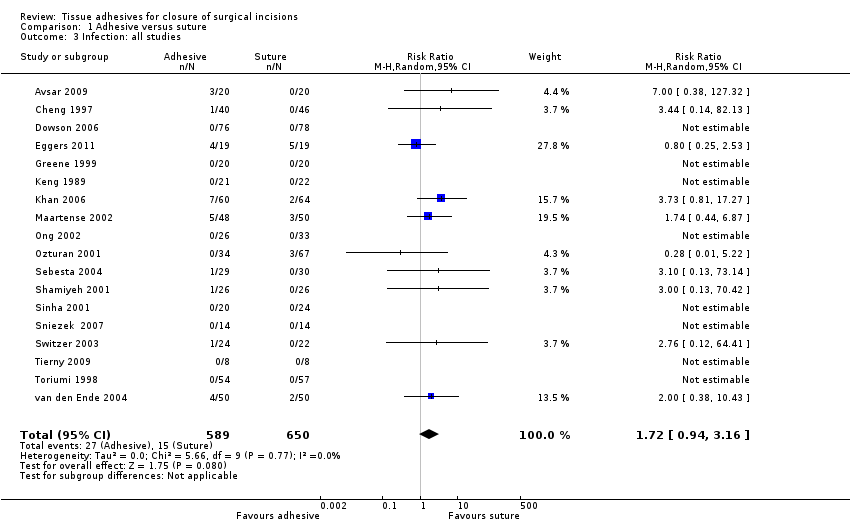
| 3 Infection: all studies Show forest plot | 18 | 1239 | Risk Ratio (M‐H, Random, 95% CI) | 1.72 [0.94, 3.16] |
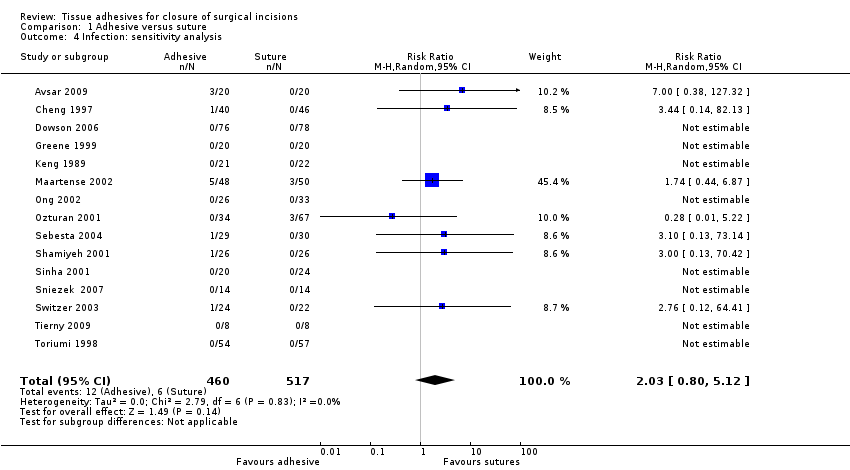
| 4 Infection: sensitivity analysis Show forest plot | 15 | 977 | Risk Ratio (M‐H, Random, 95% CI) | 2.03 [0.80, 5.12] |
| 5 Cosmetic appearance rated by patient Show forest plot | 2 | 199 | Mean Difference (IV, Random, 95% CI) | ‐2.12 [‐7.20, 2.95] |
| 5.1 VAS 0 to 100 | 2 | 199 | Mean Difference (IV, Random, 95% CI) | ‐2.12 [‐7.20, 2.95] |
| 6 Cosmetic appearance rated by surgeon Show forest plot | 2 | Mean Difference (IV, Fixed, 95% CI) | Totals not selected | |
| 6.1 VAS scale 0 to 100 | 1 | Mean Difference (IV, Fixed, 95% CI) | 0.0 [0.0, 0.0] | |
| 6.2 Scar assessment (0 to 5 scale) | 1 | Mean Difference (IV, Fixed, 95% CI) | 0.0 [0.0, 0.0] | |
| 7 Patient/parent satisfaction (% satisfied) Show forest plot | 2 | 206 | Risk Ratio (M‐H, Random, 95% CI) | 1.01 [0.96, 1.07] |
| 8 Patient/parent satisfaction (VAS Scale 0 to 100) Show forest plot | 1 | Mean Difference (IV, Fixed, 95% CI) | Subtotals only | |
| 9 Surgeon satisfaction (% satisfied) Show forest plot | 2 | 150 | Risk Ratio (M‐H, Random, 95% CI) | 1.12 [0.58, 2.19] |
| 10 Time taken for wound closure Show forest plot | 5 | Mean Difference (IV, Random, 95% CI) | Subtotals only | |
| Outcome or subgroup title | No. of studies | No. of participants | Statistical method | Effect size |
| 1 Dehiscence Show forest plot | 2 | Risk Ratio (M‐H, Random, 95% CI) | Subtotals only | |
| 2 Infection Show forest plot | 3 | 190 | Risk Ratio (M‐H, Random, 95% CI) | 1.37 [0.39, 4.81] |
| 3 Cosmetic appearance rated by patient (VAS) Show forest plot | 1 | Mean Difference (IV, Fixed, 95% CI) | Subtotals only | |
| 4 Cosmetic appearance rated by patient (% satisfied) Show forest plot | 1 | Risk Ratio (M‐H, Fixed, 95% CI) | Subtotals only | |
| 5 Cosmetic appearance rated by surgeon (VAS) Show forest plot | 2 | 139 | Mean Difference (IV, Random, 95% CI) | 9.56 [4.74, 14.37] |
| 6 Patient satisfaction Show forest plot | 1 | Risk Ratio (M‐H, Fixed, 95% CI) | Subtotals only | |
| 7 Surgeon satisfaction Show forest plot | 2 | 141 | Risk Ratio (M‐H, Random, 95% CI) | 0.87 [0.63, 1.19] |
| 8 Time taken for wound closure Show forest plot | 1 | Mean Difference (IV, Fixed, 95% CI) | Subtotals only | |
| Outcome or subgroup title | No. of studies | No. of participants | Statistical method | Effect size |
| 1 Dehiscence Show forest plot | 2 | 107 | Risk Ratio (M‐H, Random, 95% CI) | 0.53 [0.05, 5.33] |
| 2 Infection Show forest plot | 4 | 320 | Risk Ratio (M‐H, Random, 95% CI) | 1.39 [0.30, 6.54] |
| 3 Cosmetic appearance rated by patient (scar scale) Show forest plot | 1 | Mean Difference (IV, Fixed, 95% CI) | Subtotals only | |
| 4 Cosmetic appearance by plastic surgeons (VAS) Show forest plot | 1 | Mean Difference (IV, Fixed, 95% CI) | Subtotals only | |
| 5 Patient satisfaction Show forest plot | 1 | Mean Difference (IV, Fixed, 95% CI) | Subtotals only | |
| 6 Time taken for wound closure Show forest plot | 1 | Mean Difference (IV, Fixed, 95% CI) | Subtotals only | |
| Outcome or subgroup title | No. of studies | No. of participants | Statistical method | Effect size |
| 1 Dehiscence Show forest plot | 2 | 249 | Risk Ratio (M‐H, Random, 95% CI) | 0.55 [0.13, 2.38] |
| 2 Infection Show forest plot | 2 | 249 | Risk Ratio (M‐H, Random, 95% CI) | 0.41 [0.11, 1.60] |
| 3 Patient satisfaction Show forest plot | 1 | 187 | Mean Difference (IV, Fixed, 95% CI) | 0.40 [0.10, 0.70] |
| 4 Clinician satisfaction Show forest plot | 1 | 209 | Mean Difference (IV, Fixed, 95% CI) | 0.53 [0.29, 0.77] |
| 5 Time taken for wound closure Show forest plot | 1 | 209 | Mean Difference (IV, Fixed, 95% CI) | ‐1.05 [‐1.79, ‐0.31] |
| Outcome or subgroup title | No. of studies | No. of participants | Statistical method | Effect size |
| 1 Dehiscence Show forest plot | 1 | Risk Ratio (M‐H, Fixed, 95% CI) | Subtotals only | |
| 2 Infection Show forest plot | 1 | Risk Ratio (M‐H, Fixed, 95% CI) | Subtotals only | |
| 3 Patient satisfaction Show forest plot | 1 | Mean Difference (IV, Fixed, 95% CI) | Subtotals only | |
| 4 Clinician satisfaction Show forest plot | 1 | Mean Difference (IV, Fixed, 95% CI) | Subtotals only | |
| 5 Time taken for wound closure Show forest plot | 1 | Mean Difference (IV, Fixed, 95% CI) | Subtotals only | |
| Outcome or subgroup title | No. of studies | No. of participants | Statistical method | Effect size |
| 1 Dehiscence Show forest plot | 2 | 80 | Risk Ratio (M‐H, Random, 95% CI) | 1.46 [0.19, 11.30] |
| 2 Infection Show forest plot | 2 | Risk Ratio (M‐H, Fixed, 95% CI) | Subtotals only | |
| 3 Cosmetic assessment rated by patient (VAS) Show forest plot | 1 | Mean Difference (IV, Fixed, 95% CI) | Subtotals only | |
| 4 Cosmetic assessment rated by surgeon (VAS) Show forest plot | 1 | Mean Difference (IV, Fixed, 95% CI) | Subtotals only | |
| 5 Surgeon satisfaction (with device) Show forest plot | 1 | Mean Difference (IV, Fixed, 95% CI) | Subtotals only | |
| 6 Surgeon satisfaction (with closure) Show forest plot | 1 | Mean Difference (IV, Fixed, 95% CI) | Subtotals only | |
| 7 Time taken for wound closure Show forest plot | 1 | Mean Difference (IV, Fixed, 95% CI) | Subtotals only | |