Scolaris Content Display Scolaris Content Display

Risk of bias summary: review authors' judgements about each risk of bias item for each included study
Figuras y tablas -
Figure 1

Risk of bias summary: review authors' judgements about each risk of bias item for each included study

Risk of bias graph: review authors' judgements about each risk of bias item presented as percentages across all included studies
Figuras y tablas -
Figure 2

Risk of bias graph: review authors' judgements about each risk of bias item presented as percentages across all included studies

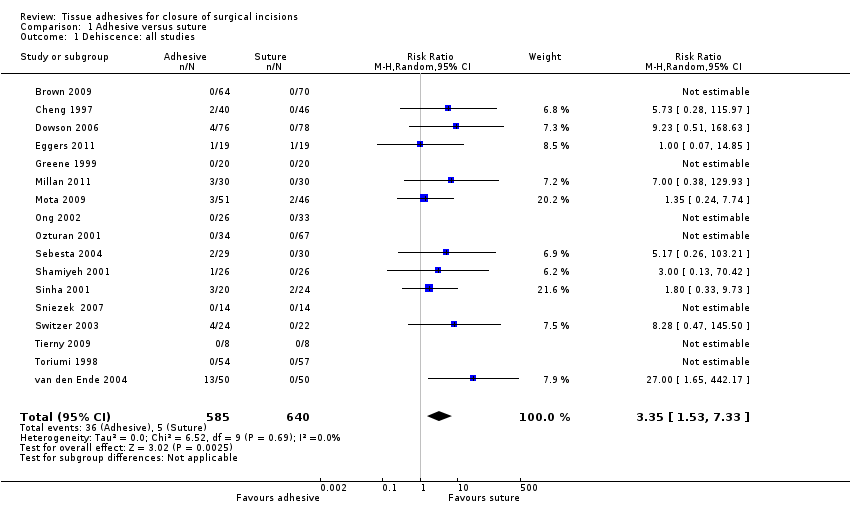
Comparison 1 Adhesive versus suture, Outcome 1 Dehiscence: all studies.
Figuras y tablas -
Analysis 1.1

Comparison 1 Adhesive versus suture, Outcome 1 Dehiscence: all studies.

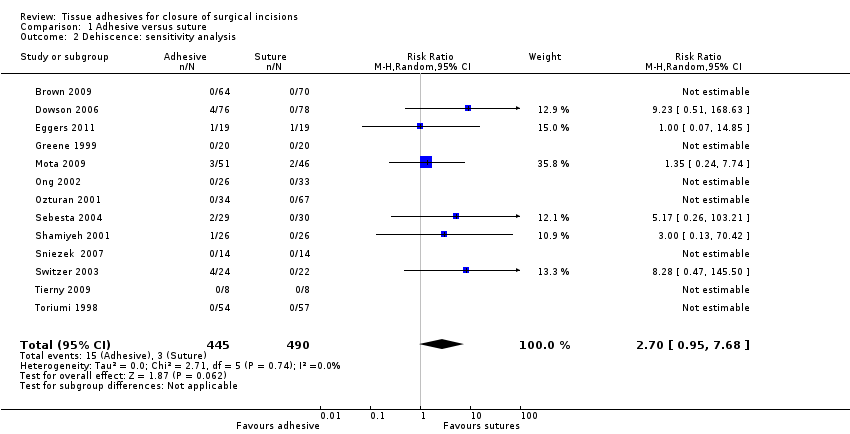
Comparison 1 Adhesive versus suture, Outcome 2 Dehiscence: sensitivity analysis.
Figuras y tablas -
Analysis 1.2

Comparison 1 Adhesive versus suture, Outcome 2 Dehiscence: sensitivity analysis.

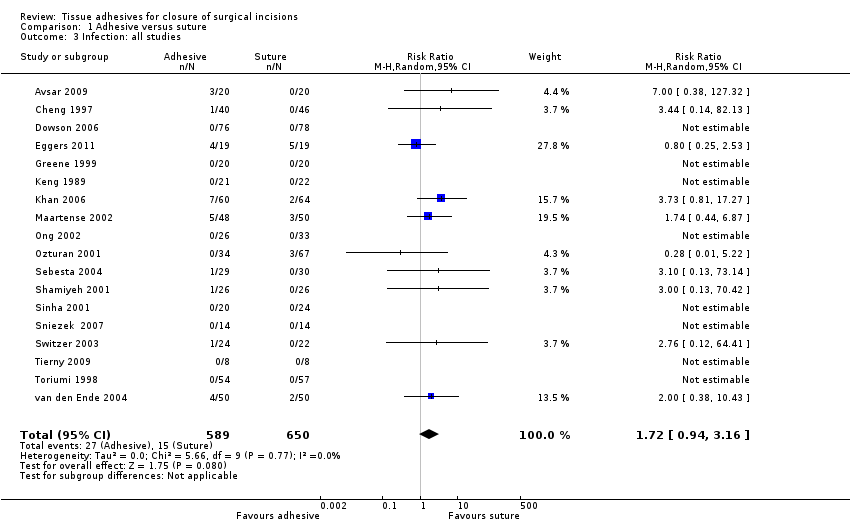
Comparison 1 Adhesive versus suture, Outcome 3 Infection: all studies.
Figuras y tablas -
Analysis 1.3

Comparison 1 Adhesive versus suture, Outcome 3 Infection: all studies.

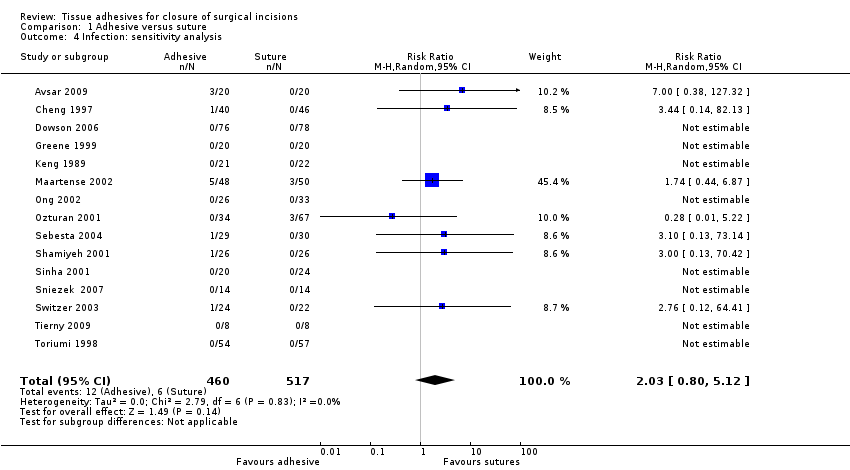
Comparison 1 Adhesive versus suture, Outcome 4 Infection: sensitivity analysis.
Figuras y tablas -
Analysis 1.4

Comparison 1 Adhesive versus suture, Outcome 4 Infection: sensitivity analysis.

Comparison 1 Adhesive versus suture, Outcome 5 Cosmetic appearance rated by patient.
Figuras y tablas -
Analysis 1.5

Comparison 1 Adhesive versus suture, Outcome 5 Cosmetic appearance rated by patient.

Comparison 1 Adhesive versus suture, Outcome 6 Cosmetic appearance rated by surgeon.
Figuras y tablas -
Analysis 1.6

Comparison 1 Adhesive versus suture, Outcome 6 Cosmetic appearance rated by surgeon.

Comparison 1 Adhesive versus suture, Outcome 7 Patient/parent satisfaction (% satisfied).
Figuras y tablas -
Analysis 1.7

Comparison 1 Adhesive versus suture, Outcome 7 Patient/parent satisfaction (% satisfied).

Comparison 1 Adhesive versus suture, Outcome 8 Patient/parent satisfaction (VAS Scale 0 to 100).
Figuras y tablas -
Analysis 1.8

Comparison 1 Adhesive versus suture, Outcome 8 Patient/parent satisfaction (VAS Scale 0 to 100).

Comparison 1 Adhesive versus suture, Outcome 9 Surgeon satisfaction (% satisfied).
Figuras y tablas -
Analysis 1.9

Comparison 1 Adhesive versus suture, Outcome 9 Surgeon satisfaction (% satisfied).

Comparison 1 Adhesive versus suture, Outcome 10 Time taken for wound closure.
Figuras y tablas -
Analysis 1.10

Comparison 1 Adhesive versus suture, Outcome 10 Time taken for wound closure.

Comparison 2 Adhesive versus adhesive tape, Outcome 1 Dehiscence.
Figuras y tablas -
Analysis 2.1

Comparison 2 Adhesive versus adhesive tape, Outcome 1 Dehiscence.

Comparison 2 Adhesive versus adhesive tape, Outcome 2 Infection.
Figuras y tablas -
Analysis 2.2

Comparison 2 Adhesive versus adhesive tape, Outcome 2 Infection.

Comparison 2 Adhesive versus adhesive tape, Outcome 3 Cosmetic appearance rated by patient (VAS).
Figuras y tablas -
Analysis 2.3

Comparison 2 Adhesive versus adhesive tape, Outcome 3 Cosmetic appearance rated by patient (VAS).

Comparison 2 Adhesive versus adhesive tape, Outcome 4 Cosmetic appearance rated by patient (% satisfied).
Figuras y tablas -
Analysis 2.4

Comparison 2 Adhesive versus adhesive tape, Outcome 4 Cosmetic appearance rated by patient (% satisfied).

Comparison 2 Adhesive versus adhesive tape, Outcome 5 Cosmetic appearance rated by surgeon (VAS).
Figuras y tablas -
Analysis 2.5

Comparison 2 Adhesive versus adhesive tape, Outcome 5 Cosmetic appearance rated by surgeon (VAS).

Comparison 2 Adhesive versus adhesive tape, Outcome 6 Patient satisfaction.
Figuras y tablas -
Analysis 2.6

Comparison 2 Adhesive versus adhesive tape, Outcome 6 Patient satisfaction.

Comparison 2 Adhesive versus adhesive tape, Outcome 7 Surgeon satisfaction.
Figuras y tablas -
Analysis 2.7

Comparison 2 Adhesive versus adhesive tape, Outcome 7 Surgeon satisfaction.

Comparison 2 Adhesive versus adhesive tape, Outcome 8 Time taken for wound closure.
Figuras y tablas -
Analysis 2.8

Comparison 2 Adhesive versus adhesive tape, Outcome 8 Time taken for wound closure.

Comparison 3 Adhesive versus staples, Outcome 1 Dehiscence.
Figuras y tablas -
Analysis 3.1

Comparison 3 Adhesive versus staples, Outcome 1 Dehiscence.

Comparison 3 Adhesive versus staples, Outcome 2 Infection.
Figuras y tablas -
Analysis 3.2

Comparison 3 Adhesive versus staples, Outcome 2 Infection.

Comparison 3 Adhesive versus staples, Outcome 3 Cosmetic appearance rated by patient (scar scale).
Figuras y tablas -
Analysis 3.3

Comparison 3 Adhesive versus staples, Outcome 3 Cosmetic appearance rated by patient (scar scale).

Comparison 3 Adhesive versus staples, Outcome 4 Cosmetic appearance by plastic surgeons (VAS).
Figuras y tablas -
Analysis 3.4

Comparison 3 Adhesive versus staples, Outcome 4 Cosmetic appearance by plastic surgeons (VAS).

Comparison 3 Adhesive versus staples, Outcome 5 Patient satisfaction.
Figuras y tablas -
Analysis 3.5

Comparison 3 Adhesive versus staples, Outcome 5 Patient satisfaction.

Comparison 3 Adhesive versus staples, Outcome 6 Time taken for wound closure.
Figuras y tablas -
Analysis 3.6

Comparison 3 Adhesive versus staples, Outcome 6 Time taken for wound closure.

Comparison 4 Adhesive versus other method, Outcome 1 Dehiscence.
Figuras y tablas -
Analysis 4.1

Comparison 4 Adhesive versus other method, Outcome 1 Dehiscence.

Comparison 4 Adhesive versus other method, Outcome 2 Infection.
Figuras y tablas -
Analysis 4.2

Comparison 4 Adhesive versus other method, Outcome 2 Infection.

Comparison 4 Adhesive versus other method, Outcome 3 Patient satisfaction.
Figuras y tablas -
Analysis 4.3

Comparison 4 Adhesive versus other method, Outcome 3 Patient satisfaction.

Comparison 4 Adhesive versus other method, Outcome 4 Clinician satisfaction.
Figuras y tablas -
Analysis 4.4

Comparison 4 Adhesive versus other method, Outcome 4 Clinician satisfaction.

Comparison 4 Adhesive versus other method, Outcome 5 Time taken for wound closure.
Figuras y tablas -
Analysis 4.5

Comparison 4 Adhesive versus other method, Outcome 5 Time taken for wound closure.

Comparison 5 Adhesive versus adhesive: High viscosity versus low viscosity, Outcome 1 Dehiscence.
Figuras y tablas -
Analysis 5.1

Comparison 5 Adhesive versus adhesive: High viscosity versus low viscosity, Outcome 1 Dehiscence.

Comparison 5 Adhesive versus adhesive: High viscosity versus low viscosity, Outcome 2 Infection.
Figuras y tablas -
Analysis 5.2

Comparison 5 Adhesive versus adhesive: High viscosity versus low viscosity, Outcome 2 Infection.

Comparison 5 Adhesive versus adhesive: High viscosity versus low viscosity, Outcome 3 Patient satisfaction.
Figuras y tablas -
Analysis 5.3

Comparison 5 Adhesive versus adhesive: High viscosity versus low viscosity, Outcome 3 Patient satisfaction.

Comparison 5 Adhesive versus adhesive: High viscosity versus low viscosity, Outcome 4 Clinician satisfaction.
Figuras y tablas -
Analysis 5.4

Comparison 5 Adhesive versus adhesive: High viscosity versus low viscosity, Outcome 4 Clinician satisfaction.

Comparison 5 Adhesive versus adhesive: High viscosity versus low viscosity, Outcome 5 Time taken for wound closure.
Figuras y tablas -
Analysis 5.5

Comparison 5 Adhesive versus adhesive: High viscosity versus low viscosity, Outcome 5 Time taken for wound closure.

Comparison 6 Adhesive versus adhesive: octylcyanoacrylate versus butylcyanoacrylate, Outcome 1 Dehiscence.
Figuras y tablas -
Analysis 6.1

Comparison 6 Adhesive versus adhesive: octylcyanoacrylate versus butylcyanoacrylate, Outcome 1 Dehiscence.

Comparison 6 Adhesive versus adhesive: octylcyanoacrylate versus butylcyanoacrylate, Outcome 2 Infection.
Figuras y tablas -
Analysis 6.2

Comparison 6 Adhesive versus adhesive: octylcyanoacrylate versus butylcyanoacrylate, Outcome 2 Infection.

Comparison 6 Adhesive versus adhesive: octylcyanoacrylate versus butylcyanoacrylate, Outcome 3 Cosmetic assessment rated by patient (VAS).
Figuras y tablas -
Analysis 6.3

Comparison 6 Adhesive versus adhesive: octylcyanoacrylate versus butylcyanoacrylate, Outcome 3 Cosmetic assessment rated by patient (VAS).

Comparison 6 Adhesive versus adhesive: octylcyanoacrylate versus butylcyanoacrylate, Outcome 4 Cosmetic assessment rated by surgeon (VAS).
Figuras y tablas -
Analysis 6.4

Comparison 6 Adhesive versus adhesive: octylcyanoacrylate versus butylcyanoacrylate, Outcome 4 Cosmetic assessment rated by surgeon (VAS).

Comparison 6 Adhesive versus adhesive: octylcyanoacrylate versus butylcyanoacrylate, Outcome 5 Surgeon satisfaction (with device).
Figuras y tablas -
Analysis 6.5

Comparison 6 Adhesive versus adhesive: octylcyanoacrylate versus butylcyanoacrylate, Outcome 5 Surgeon satisfaction (with device).

Comparison 6 Adhesive versus adhesive: octylcyanoacrylate versus butylcyanoacrylate, Outcome 6 Surgeon satisfaction (with closure).
Figuras y tablas -
Analysis 6.6

Comparison 6 Adhesive versus adhesive: octylcyanoacrylate versus butylcyanoacrylate, Outcome 6 Surgeon satisfaction (with closure).

Comparison 6 Adhesive versus adhesive: octylcyanoacrylate versus butylcyanoacrylate, Outcome 7 Time taken for wound closure.
Figuras y tablas -
Analysis 6.7

Comparison 6 Adhesive versus adhesive: octylcyanoacrylate versus butylcyanoacrylate, Outcome 7 Time taken for wound closure.

Summary of findings for the main comparison. Tissue adhesive compared to sutures for surgical incisions

Tissue adhesive compared to sutures for surgical incisions

Patient or population: People with surgical incisions
Settings:
Intervention: Tissue adhesive
Comparison: Sutures

Outcomes

Illustrative comparative risks*4 (95% CI)

Relative effect
(95% CI)

No of participants
(studies)

Quality of the evidence
(GRADE)

Comments

Assumed risk

Corresponding risk

Sutures

Tissue adhesive

Wound dehiscence

Study population

RR 3.35
(1.53 to 7.32)

736
(10 studies)

⊕⊕⊝⊝
low1,2

13 per 1000

45 per 1000
(21 to 99)

Moderate

Wound infection

Study population

RR 1.72
(0.92 to 3.16)

744
10 studies

⊕⊝⊝⊝
very low2,3

38 per 1000

76 per 1000
(14 to 397)

Moderate

*The basis for the assumed risk (e.g. the median control group risk across studies) is provided in footnotes. The corresponding risk (and its 95% confidence interval) is based on the assumed risk in the comparison group and the relative effect of the intervention (and its 95% CI)
CI: Confidence interval; RR: Risk ratio

GRADE Working Group grades of evidence
High quality: further research is very unlikely to change our confidence in the estimate of effect
Moderate quality: further research is likely to have an important impact on our confidence in the estimate of effect and may change the estimate
Low quality: further research is very likely to have an important impact on our confidence in the estimate of effect and is likely to change the estimate
Very low quality: we are very uncertain about the estimate

1 Possible unit of analyses issues. A sensitivity analysis changes a statistically significant difference to a non‐statistically significant difference
2 Study 95% CIs are wide
3 Possible unit of analysis issues
4 Median control (suture) group risk across studies

Figuras y tablas -
Summary of findings for the main comparison. Tissue adhesive compared to sutures for surgical incisions
Summary of findings 2. Tissue adhesive compared to adhesive tape for surgical incisions

Tissue adhesive compared to adhesive tape for surgical incisions

Patient or population: people with surgical incisions
Settings:
Intervention: tissue adhesive
Comparison: adhesive tape

Outcomes

Illustrative comparative risks*3 (95% CI)

Relative effect
(95% CI)

No of participants
(studies)

Quality of the evidence
(GRADE)

Comments

Assumed risk

Corresponding risk

Adhesive tape

Tissue adhesive

Wound dehiscence

Study population

RR 0.96
(0.06 to 14.55)

50
(1 study)

⊕⊕⊝⊝
low1

42 per 1000

40 per 1000
(2 to 606)

Moderate

Wound infection

Study population

RR 1.37
(0.39 to 4.81)

190
(3 studies)

⊕⊕⊝⊝
low1,2

43 per 1000

60 per 1000
(17 to 209)

Moderate

*The basis for the assumed risk (e.g. the median control group risk across studies) is provided in footnotes. The corresponding risk (and its 95% confidence interval) is based on the assumed risk in the comparison group and the relative effect of the intervention (and its 95% CI)
CI: Confidence interval; RR: Risk ratio

GRADE Working Group grades of evidence
High quality: further research is very unlikely to change our confidence in the estimate of effect
Moderate quality: further research is likely to have an important impact on our confidence in the estimate of effect and may change the estimate
Low quality: further research is very likely to have an important impact on our confidence in the estimate of effect and is likely to change the estimate
Very low quality: we are very uncertain about the estimate

1 Study 95% CIs are very wide
2 Evidence of inconsistency in point estimates. With the point estimate from one study lying outside the 95% CIs of another
3 Control (tape) group risk in included study

Figuras y tablas -
Summary of findings 2. Tissue adhesive compared to adhesive tape for surgical incisions
Summary of findings 3. Tissue adhesive compared to staples for surgical incisions

Tissue adhesive compared to staples for surgical incisions

Patient or population: people with surgical incisions
Settings:
Intervention: tissue adhesive
Comparison: staples

Outcomes

Illustrative comparative risks*3 (95% CI)

Relative effect
(95% CI)

No of participants
(studies)

Quality of the evidence
(GRADE)

Comments

Assumed risk

Corresponding risk

Staples

Tissue adhesive

Wound dehiscence

Study population

RR 0.53
(0.05 to 5.33)

37
(1 study)

⊕⊕⊝⊝
low1

105 per 1000

56 per 1000
(5 to 561)

Moderate

Wound infection

Study population

RR 1.39
(0.3 to 6.54)

250
(3 studies)

⊕⊝⊝⊝
very low1,2

71 per 1000

99 per 1000
(21 to 463)

Moderate

*The basis for the assumed risk (e.g. the median control group risk across studies) is provided in footnotes. The corresponding risk (and its 95% confidence interval) is based on the assumed risk in the comparison group and the relative effect of the intervention (and its 95% CI).
CI: Confidence interval; RR: Risk ratio;

GRADE Working Group grades of evidence
High quality: Further research is very unlikely to change our confidence in the estimate of effect.
Moderate quality: Further research is likely to have an important impact on our confidence in the estimate of effect and may change the estimate.
Low quality: Further research is very likely to have an important impact on our confidence in the estimate of effect and is likely to change the estimate.
Very low quality: We are very uncertain about the estimate.

1 Study 95% CIs are very wide.
2 Evidence of point estimates lying in opposite directions with the estimate for one study lying outside the 95% CI of another.
3 Control (staples ) group risk for included study.

Figuras y tablas -
Summary of findings 3. Tissue adhesive compared to staples for surgical incisions
Summary of findings 4. Tissue adhesive compared to other methods for surgical incisions

Tissue adhesive compared to other methods for surgical incisions

Patient or population: people with surgical incisions
Settings:
Intervention: tissue adhesive
Comparison: other methods

Outcomes

Illustrative comparative risks* (95% CI)

Relative effect
(95% CI)

No of participants
(studies)

Quality of the evidence
(GRADE)

Comments

Assumed risk

Corresponding risk

Other methods

Tissue adhesive

Wound dehiscence

Study population

RR 0.55
(0.13 to 2.38)

209
(1 study)

⊕⊕⊝⊝
low1,2

49 per 1000

27 per 1000
(6 to 117)

Moderate

Wound infection

Study population

RR 0.41
(0.11 to 1.6)

209
(1 study)

⊕⊕⊝⊝
low1,2

66 per 1000

27 per 1000
(7 to 105)

Moderate

*The basis for the assumed risk (e.g. the median control group risk across studies) is provided in footnotes. The corresponding risk (and its 95% confidence interval) is based on the assumed risk in the comparison group and the relative effect of the intervention (and its 95% CI)
CI: Confidence interval; RR: Risk ratio

GRADE Working Group grades of evidence
High quality: further research is very unlikely to change our confidence in the estimate of effect
Moderate quality: further research is likely to have an important impact on our confidence in the estimate of effect and may change the estimate
Low quality: further research is very likely to have an important impact on our confidence in the estimate of effect and is likely to change the estimate
Very low quality: we are very uncertain about the estimate

1 Study 95% CIs are very wide
2 Single study with low event rate

Figuras y tablas -
Summary of findings 4. Tissue adhesive compared to other methods for surgical incisions
Summary of findings 5. High viscosity tissue adhesive compared to low viscosity tissue adhesive for surgical incisions

High viscosity tissue adhesive compared to low viscosity tissue adhesive for surgical incisions

Patient or population: people with surgical incisions
Settings:
Intervention: high viscosity tissue adhesive
Comparison: low viscosity tissue adhesive

Outcomes

Illustrative comparative risks* (95% CI)

Relative effect
(95% CI)

No of participants
(studies)

Quality of the evidence
(GRADE)

Comments

Assumed risk

Corresponding risk

Low viscosity tissue adhesive

High viscosity tissue adhesive

Wound dehiscence

Study population

RR 3.74
(0.21 to 67.93)

148
(1 study)

⊕⊝⊝⊝
very low1,2

Could not be calculated

Could not be calculated

Wound infection

Study population

RR 0.82
(0.16 to 4.31)

148
(1 study)

⊕⊝⊝⊝
very low1,2

47 per 1000

38 per 1000
(7 to 200)

Moderate

*The basis for the assumed risk (e.g. the median control group risk across studies) is provided in footnotes. The corresponding risk (and its 95% confidence interval) is based on the assumed risk in the comparison group and the relative effect of the intervention (and its 95% CI)
CI: Confidence interval; RR: Risk ratio

GRADE Working Group grades of evidence
High quality: further research is very unlikely to change our confidence in the estimate of effect
Moderate quality: further research is likely to have an important impact on our confidence in the estimate of effect and may change the estimate
Low quality: further research is very likely to have an important impact on our confidence in the estimate of effect and is likely to change the estimate
Very low quality: we are very uncertain about the estimate

1 Study 95% CIs are very wide
2 Single study with low event rate

Figuras y tablas -
Summary of findings 5. High viscosity tissue adhesive compared to low viscosity tissue adhesive for surgical incisions
Summary of findings 6. Octylcyanoacrylate compared to butylcyanoacrylate for surgical incisions

Octylcyanoacrylate compared to butylcyanoacrylate for surgical incisions

Patient or population: people with surgical incisions
Settings:
Intervention: octylcyanoacrylate
Comparison: butylcyanoacrylate

Outcomes

Illustrative comparative risks*2 (95% CI)

Relative effect
(95% CI)

No of participants
(studies)

Quality of the evidence
(GRADE)

Comments

Assumed risk

Corresponding risk

Butylcyanoacrylate

Octylcyanoacrylate

Wound dehiscence

26 per 1000

38 per 1000

(5 to 297)

RR 1.46

(0.19 to 11)

80
(2 studies)

⊕⊕⊝⊝
low1

Wound infection

Study population

RR 0.63
(0.21 to 1.88)

37
(1 study)

⊕⊕⊝⊝
low1

333 per 1000

210 per 1000
(70 to 627)

Moderate

*The basis for the assumed risk (e.g. the median control group risk across studies) is provided in footnotes. The corresponding risk (and its 95% confidence interval) is based on the assumed risk in the comparison group and the relative effect of the intervention (and its 95% CI)
CI: Confidence interval; RR: Risk ratio

GRADE Working Group grades of evidence
High quality: further research is very unlikely to change our confidence in the estimate of effect
Moderate quality: further research is likely to have an important impact on our confidence in the estimate of effect and may change the estimate
Low quality: further research is very likely to have an important impact on our confidence in the estimate of effect and is likely to change the estimate
Very low quality: we are very uncertain about the estimate

1 The 95% CI estimate around the RR of 1.46 is very wide
2 Median control group risk across studies

Figuras y tablas -
Summary of findings 6. Octylcyanoacrylate compared to butylcyanoacrylate for surgical incisions
Table 1. Summary of study comparisons

Tissue adhesive vs tissue adhesive

(Comp 5)

Mixed control

(Comp 4)

Butyl‐2‐

cyanoacrylate

vs staples

(Comp 3)

2‐octyl

cyanoacrylate

vs staples

(Comp 3)

2‐octyl

cyanoacrylate

vs tape

(Comp 2)

Butyl‐2‐

cyanoacrylate

vs sutures

(Comp 1)

2‐octyl

cyanoacrylate

vs sutures

(Comp1)

Trial ID

2‐octyl

cyanoacrylate

Butyl‐2‐

cyanoacrylate

Sutures

Staples

Adhesive tape/strips

Mixed sutures and staples

All non‐tissue adhesive closure methods

Other viscosity 2‐octyl

cyanoacrylate

3

Amin 2009

1

Avsar 2009

5

4

Blondeel 2004

1

Brown 2009

1

Cheng 1997

4

Chibbaro 2009

1

Dowson 2006

5

3

3

1

1

Eggers 2011

1

Greene 1999

1

Jallali 2004

1

Keng 1989

5

Kent 2014

3

1

Khan 2006

1

Kouba 2011

1

Krishnamoorthy 2009

3

Livesey 2009

2

1

Maartense 2002

5

Maloney 2013

1

Millan 2011

1

Mota 2009

1

Ong 2002

1

Ozturan 2001

3

Pronio 2011

3

Ridgway 2007

1

Sebesta 2004

2

1

Shamiyeh 2001

1

Sinha 2001

1

Sniezek 2007

1

Switzer 2003

1

Tierny 2009

1

Toriumi 1998

2

Romero 2011

1

van den Ende 2004

Abbreviation

Comp = comparison

Figuras y tablas -
Table 1. Summary of study comparisons
Comparison 1. Adhesive versus suture

Outcome or subgroup title

No. of studies

No. of participants

Statistical method

Effect size

1 Dehiscence: all studies Show forest plot

17

1225

Risk Ratio (M‐H, Random, 95% CI)

3.35 [1.53, 7.33]

2 Dehiscence: sensitivity analysis Show forest plot

13

935

Risk Ratio (M‐H, Random, 95% CI)

2.70 [0.95, 7.68]

3 Infection: all studies Show forest plot

18

1239

Risk Ratio (M‐H, Random, 95% CI)

1.72 [0.94, 3.16]

4 Infection: sensitivity analysis Show forest plot

15

977

Risk Ratio (M‐H, Random, 95% CI)

2.03 [0.80, 5.12]

5 Cosmetic appearance rated by patient Show forest plot

2

199

Mean Difference (IV, Random, 95% CI)

‐2.12 [‐7.20, 2.95]

5.1 VAS 0 to 100

2

199

Mean Difference (IV, Random, 95% CI)

‐2.12 [‐7.20, 2.95]

6 Cosmetic appearance rated by surgeon Show forest plot

2

Mean Difference (IV, Fixed, 95% CI)

Totals not selected

6.1 VAS scale 0 to 100

1

Mean Difference (IV, Fixed, 95% CI)

0.0 [0.0, 0.0]

6.2 Scar assessment (0 to 5 scale)

1

Mean Difference (IV, Fixed, 95% CI)

0.0 [0.0, 0.0]

7 Patient/parent satisfaction (% satisfied) Show forest plot

2

206

Risk Ratio (M‐H, Random, 95% CI)

1.01 [0.96, 1.07]

8 Patient/parent satisfaction (VAS Scale 0 to 100) Show forest plot

1

Mean Difference (IV, Fixed, 95% CI)

Subtotals only

9 Surgeon satisfaction (% satisfied) Show forest plot

2

150

Risk Ratio (M‐H, Random, 95% CI)

1.12 [0.58, 2.19]

10 Time taken for wound closure Show forest plot

5

Mean Difference (IV, Random, 95% CI)

Subtotals only

Figuras y tablas -
Comparison 1. Adhesive versus suture
Comparison 2. Adhesive versus adhesive tape

Outcome or subgroup title

No. of studies

No. of participants

Statistical method

Effect size

1 Dehiscence Show forest plot

2

Risk Ratio (M‐H, Random, 95% CI)

Subtotals only

2 Infection Show forest plot

3

190

Risk Ratio (M‐H, Random, 95% CI)

1.37 [0.39, 4.81]

3 Cosmetic appearance rated by patient (VAS) Show forest plot

1

Mean Difference (IV, Fixed, 95% CI)

Subtotals only

4 Cosmetic appearance rated by patient (% satisfied) Show forest plot

1

Risk Ratio (M‐H, Fixed, 95% CI)

Subtotals only

5 Cosmetic appearance rated by surgeon (VAS) Show forest plot

2

139

Mean Difference (IV, Random, 95% CI)

9.56 [4.74, 14.37]

6 Patient satisfaction Show forest plot

1

Risk Ratio (M‐H, Fixed, 95% CI)

Subtotals only

7 Surgeon satisfaction Show forest plot

2

141

Risk Ratio (M‐H, Random, 95% CI)

0.87 [0.63, 1.19]

8 Time taken for wound closure Show forest plot

1

Mean Difference (IV, Fixed, 95% CI)

Subtotals only

Figuras y tablas -
Comparison 2. Adhesive versus adhesive tape
Comparison 3. Adhesive versus staples

Outcome or subgroup title

No. of studies

No. of participants

Statistical method

Effect size

1 Dehiscence Show forest plot

2

107

Risk Ratio (M‐H, Random, 95% CI)

0.53 [0.05, 5.33]

2 Infection Show forest plot

4

320

Risk Ratio (M‐H, Random, 95% CI)

1.39 [0.30, 6.54]

3 Cosmetic appearance rated by patient (scar scale) Show forest plot

1

Mean Difference (IV, Fixed, 95% CI)

Subtotals only

4 Cosmetic appearance by plastic surgeons (VAS) Show forest plot

1

Mean Difference (IV, Fixed, 95% CI)

Subtotals only

5 Patient satisfaction Show forest plot

1

Mean Difference (IV, Fixed, 95% CI)

Subtotals only

6 Time taken for wound closure Show forest plot

1

Mean Difference (IV, Fixed, 95% CI)

Subtotals only

Figuras y tablas -
Comparison 3. Adhesive versus staples
Comparison 4. Adhesive versus other method

Outcome or subgroup title

No. of studies

No. of participants

Statistical method

Effect size

1 Dehiscence Show forest plot

2

249

Risk Ratio (M‐H, Random, 95% CI)

0.55 [0.13, 2.38]

2 Infection Show forest plot

2

249

Risk Ratio (M‐H, Random, 95% CI)

0.41 [0.11, 1.60]

3 Patient satisfaction Show forest plot

1

187

Mean Difference (IV, Fixed, 95% CI)

0.40 [0.10, 0.70]

4 Clinician satisfaction Show forest plot

1

209

Mean Difference (IV, Fixed, 95% CI)

0.53 [0.29, 0.77]

5 Time taken for wound closure Show forest plot

1

209

Mean Difference (IV, Fixed, 95% CI)

‐1.05 [‐1.79, ‐0.31]

Figuras y tablas -
Comparison 4. Adhesive versus other method
Comparison 5. Adhesive versus adhesive: High viscosity versus low viscosity

Outcome or subgroup title

No. of studies

No. of participants

Statistical method

Effect size

1 Dehiscence Show forest plot

1

Risk Ratio (M‐H, Fixed, 95% CI)

Subtotals only

2 Infection Show forest plot

1

Risk Ratio (M‐H, Fixed, 95% CI)

Subtotals only

3 Patient satisfaction Show forest plot

1

Mean Difference (IV, Fixed, 95% CI)

Subtotals only

4 Clinician satisfaction Show forest plot

1

Mean Difference (IV, Fixed, 95% CI)

Subtotals only

5 Time taken for wound closure Show forest plot

1

Mean Difference (IV, Fixed, 95% CI)

Subtotals only

Figuras y tablas -
Comparison 5. Adhesive versus adhesive: High viscosity versus low viscosity
Comparison 6. Adhesive versus adhesive: octylcyanoacrylate versus butylcyanoacrylate

Outcome or subgroup title

No. of studies

No. of participants

Statistical method

Effect size

1 Dehiscence Show forest plot

2

80

Risk Ratio (M‐H, Random, 95% CI)

1.46 [0.19, 11.30]

2 Infection Show forest plot

2

Risk Ratio (M‐H, Fixed, 95% CI)

Subtotals only

3 Cosmetic assessment rated by patient (VAS) Show forest plot

1

Mean Difference (IV, Fixed, 95% CI)

Subtotals only

4 Cosmetic assessment rated by surgeon (VAS) Show forest plot

1

Mean Difference (IV, Fixed, 95% CI)

Subtotals only

5 Surgeon satisfaction (with device) Show forest plot

1

Mean Difference (IV, Fixed, 95% CI)

Subtotals only

6 Surgeon satisfaction (with closure) Show forest plot

1

Mean Difference (IV, Fixed, 95% CI)

Subtotals only

7 Time taken for wound closure Show forest plot

1

Mean Difference (IV, Fixed, 95% CI)

Subtotals only

Figuras y tablas -
Comparison 6. Adhesive versus adhesive: octylcyanoacrylate versus butylcyanoacrylate