Adhesivos tisulares para el cierre de las incisiones quirúrgicas
Appendices
Appendix 1. Search strategy used in the original version of this review ‐ 2007
In order to identify studies to be considered for this review the following databases were searched:
Cochrane Wounds Group Trials Register ‐ November 2007
The Cochrane Central Register of Controlled Trials (CENTRAL) ‐ The Cochrane Library Issue 2, November 2007
MEDLINE 1966 ‐ November 2007
EMBASE 1980 ‐ November 2007
The Cochrane Wounds Group Trials Register has been compiled through searching of the major health databases including MEDLINE, Cinahl and EMBASE and is regularly updated through searching of the Cochrane Central Register of Controlled Trials, handsearching of wound care journals and relevant conference proceedings. See: Collaborative review group search strategy (http:/www.cochranewounds.org).
The following search strategy was used for searching the Cochrane Wounds Group Trials Register and CENTRAL:
1 WOUNDS‐AND‐INJURIES*:ME
2 INCISION*
3 WOUND*
4 (SURGICAL and WOUND*)
5 (((#1 or #2) or #3) or #4)
6 TISSUE‐ADHESIVES*:ME
7 ADHESIVES*:ME
8 ACRYLATES*:ME
9 (TISSUE* and ADHESIVE*)
10 ACRYLATE*
11 CYANOACRYLATE*
12 (GLU or GLUES)
13 (GLUE or GLUES)
14 FIBRIN‐TISSUE‐ADHESIVE*:ME
15 BUCRYLATE*:ME
16 BUCRYLATE*
17 SUTURES*:ME
18 SUTUR*
19 SURGICAL‐STAPLING*:ME
20 STAPLE*
21 TAPE*
22 (((((((((((((((#6 or #7) or #8) or #9) or #10) or #11) or #12) or #13) or #14) or #15) or #16) or #17) or #18) or #19) or #20) or #21)
23 (#5 and #22)
Search strategies were developed for Medline and Embase and these search strategies combined a sensitive search strategy for RCTs revised from phases 1 and 2 of the Cochrane Sensitive Search Strategy for RCTs (as published in Appendix 6c in the Cochrane Handbook). The subject search used a combination of controlled vocabulary and free text terms based on the search strategy for searching the Cochrane Wounds Group Trial Register.
LANGUAGE
There were no language restrictions.
UNPUBLISHED STUDIES
Authors of the identified RCTs were written to in order to obtain further information about the trial and to attempt to identify unpublished or ongoing studies. In addition, wound care product manufacturers were contacted.
HANDSEARCHING
Trials for Wounds Group Trials Register are identified by systematically handsearching specialised journals, relevant conference proceedings and abstracts. A list of journals currently being handsearched by the group may be found at http:/www.cochranewounds.org.
Appendix 2. Search strategy for the first update of this review ‐ 2009
In order to identify studies to be considered for this review the following databases were searched:
Cochrane Wounds Group Specialised Register (November 2009;);
The Cochrane Central Register of Controlled Trials (CENTRAL) (The Cochrane Library 2009, Issue 4);
Ovid MEDLINE (1996 to November week 1 2009);
Ovid MEDLINE (In‐Process & Other Non‐Indexed Citations, November 16 2009);
Ovid EMBASE (1996 to 2009 week 46);
EBSCO CINAHL (1982 to 11 November 2009)
The Cochrane Wounds Group Trials Register has been compiled through searching of the major health databases including MEDLINE, Cinahl and EMBASE and is regularly updated through searching of the Cochrane Central Register of Controlled Trials, handsearching of wound care journals and relevant conference proceedings. See: Collaborative review group search strategy (http:/www.cochranewounds.org).
The following search strategy was used for searching the Cochrane Central Register of Controlled Trials (CENTRAL):
#1 MeSH descriptor Wounds and Injuries explode all trees
#2 surgical next wound*
#3 (#1 OR #2)
#4 MeSH descriptor Tissue Adhesives explode all trees
#5 MeSH descriptor Fibrin Tissue Adhesive explode all trees
#6 tissue next adhesive*
#7 MeSH descriptor Cyanoacrylates explode all trees
#8 octylcyanoacrylate*
#9 Dermabond
#10 MeSH descriptor Enbucrilate explode all trees
#11 enbucrilate
#12 butylcyanoacrylate*
#13 MeSH descriptor Acrylates explode all trees
#14 acrylate*
#15 MeSH descriptor Bucrylate explode all trees
#16 bucrylate*
#17 (#4 OR #5 OR #6 OR #7 OR #8 OR #9 OR #10 OR #11 OR #12 OR #13 OR #14 OR #15 OR #16)
#18 (#3 AND #17) with New in Record Status
Appendix 3. Ovid MEDLINE search strategy
Undertaken for second update in 2014
1 exp "Wounds and Injuries"/ (691113)
2 (surgical adj wound$).mp. (35309)
3 or/1‐2 (721540)
4 exp Tissue Adhesives/ (12636)
5 exp Fibrin Tissue Adhesive/ (3859)
6 tissue adhesive$.mp. (8303)
7 exp Cyanoacrylates/ (3816)
8 octylcyanoacrylate$.mp. (103)
9 Dermabond.mp. (114)
10 exp Enbucrilate/ (1496)
11 enbucrilate.mp. (1236)
12 butylcyanoacrylate$.mp. (119)
13 exp Acrylates/ (41800)
14 acrylate$.mp. (8636)
15 exp Bucrylate/ (280)
16 bucrylate$.mp. (309)
17 or/4‐16 (51986)
18 3 and 17 (3841)
19 randomized controlled trial.pt. (366703)
20 controlled clinical trial.pt. (87802)
21 randomi?ed.ab. (318385)
22 placebo.ab. (143748)
23 clinical trials as topic.sh. (168638)
24 randomly.ab. (189528)
25 trial.ti. (114737)
26 or/19‐25 (860509)
27 exp animals/ not humans.sh. (3901060)
28 26 not 27 (791299)
29 18 and 28 (276)
Appendix 4. Ovid EMBASE search strategy
Undertaken for second update in 2014
1 exp Surgical Wound/ (3914)
2 (surgical adj wound$).mp. (8021)
3 or/1‐2 (8021)
4 exp Tissue Adhesive/ (13492)
5 exp Fibrin Glue/ (6712)
6 (tissue adj adhesive$).mp. (5179)
7 exp Cyanoacrylate Derivative/ (1595)
8 exp Cyanoacrylic Acid Octyl Ester/ (340)
9 octylcyanoacrylate$.mp. (130)
10 Dermabond.mp. (343)
11 exp ENBUCRILATE/ (2847)
12 enbucrilate.mp. (2852)
13 butylcyanoacrylate$.mp. (190)
14 exp Acrylic Acid/ (3718)
15 acrylate$.mp. (6120)
16 exp Bucrilate/ (623)
17 bucrylate$.mp. (138)
18 or/4‐17 (23772)
19 3 and 18 (181)
20 Randomized controlled trials/ (47799)
21 Single‐Blind Method/ (17933)
22 Double‐Blind Method/ (114456)
23 Crossover Procedure/ (38119)
24 (random$ or factorial$ or crossover$ or cross over$ or cross‐over$ or placebo$ or assign$ or allocat$ or volunteer$).ti,ab. (1300258)
25 (doubl$ adj blind$).ti,ab. (143978)
26 (singl$ adj blind$).ti,ab. (14109)
27 or/20‐26 (1365111)
28 exp animals/ or exp invertebrate/ or animal experiment/ or animal model/ or animal tissue/ or animal cell/ or nonhuman/ (19982416)
29 human/ or human cell/ (14519180)
30 and/28‐29 (14472519)
31 28 not 30 (5509897)
32 27 not 31 (1177074)
33 19 and 32 (35)
Appendix 5. EBSCO CINAHL search strategy
Undertaken for second update in 2014
S29 S16 AND S28
S28 S17 or S18 or S19 or S20 or S21 or S22 or S23 or S24 or S25 or S26 or S27
S27 TX allocat* random*
S26 (MH "Quantitative Studies")
S25 (MH "Placebos")
S24 TX placebo*
S23 TX random* allocat*
S22 (MH "Random Assignment")
S21 TX randomi* control* trial*
S20 TX ( (singl* n1 blind*) or (singl* n1 mask*) ) or TX ( (doubl* n1 blind*) or (doubl* n1 mask*) ) or TX ( (tripl* n1 blind*) or (tripl* n1 mask*) ) or TX ( (trebl* n1 blind*) or (trebl* n1 mask*) )
S19 TX clinic* n1 trial*
S18 PT Clinical trial
S17 (MH "Clinical Trials+")
S16 S5 and S15
S15 S6 or S7 or S8 or S9 or S10 or S11 or S12 or S13 or S14
S14 TI Dermabond or AB Dermabond
S13 TI enbucrilate or AB enbucrilate
S12 TI bucrylate* or AB bucrylate*
S11 TI acrylate* or AB acrylate*
S10 TI butylcyanoacrylate* or AB butylcyanoacrylate*
S9 TI octylcyanoacrylate* or AB octylcyanoacrylate*
S8 TI cyanoacrylate* or AB cyanoacrylate*
S7 TI tissue adhesive* or AB tissue adhesive*
S6 (MH "Fibrin Tissue Adhesive")
S5 S1 or S2 or S3 or S4
S4 TI surgical wound* or AB surgical wound*
S3 (MH "Surgical Wound Care")
S2 (MH "Surgical Wound")
S1 (MH "Tears and Lacerations")
Appendix 6. Risk of bias assessment
1. Was the allocation sequence randomly generated?
Low risk of bias
The investigators describe a random component in the sequence generation process such as: referring to a random number table; using a computer random number generator; coin tossing; shuffling cards or envelopes; throwing dice; drawing of lots.
High risk of bias
The investigators describe a non‐random component in the sequence generation process. Usually, the description would involve some systematic, non‐random approach, for example: sequence generated by odd or even date of birth; sequence generated by some rule based on date (or day) of admission; sequence generated by some rule based on hospital or clinic record number.
Unclear
Insufficient information about the sequence generation process provided to permit a judgement of low or high risk of bias.
2. Was the treatment allocation adequately concealed?
Low risk of bias
Participants and investigators enrolling participants could not foresee assignment because one of the following, or an equivalent method, was used to conceal allocation: central allocation (including telephone, web‐based and pharmacy‐controlled randomisation); sequentially numbered drug containers of identical appearance; sequentially numbered, opaque, sealed envelopes.
High risk of bias
Participants or investigators enrolling participants could possibly foresee assignments and thus introduce selection bias, such as allocation based on: using an open random allocation schedule (e.g. a list of random numbers); assignment envelopes were used without appropriate safeguards (e.g. if envelopes were unsealed or non opaque or not sequentially numbered); alternation or rotation; date of birth; case record number; any other explicitly unconcealed procedure.
Unclear
Insufficient information provided to permit a judgement of low or high risk of bias. This is usually the case if the method of concealment is not described or not described in sufficient detail to allow a definite judgement, for example if the use of assignment envelopes is described, but it remains unclear whether envelopes were sequentially numbered, opaque and sealed.
3. Blinding ‐ was knowledge of the allocated interventions adequately prevented during the study?
Low risk of bias
Any one of the following.
-
No blinding, but the review authors judge that the outcome and the outcome measurement are not likely to be influenced by lack of blinding.
-
Blinding of participants and key study personnel ensured, and unlikely that the blinding could have been broken.
-
Either participants or some key study personnel were not blinded, but outcome assessment was blinded and the non‐blinding of others unlikely to introduce bias.
High risk of bias
Any one of the following.
-
No blinding or incomplete blinding, and the outcome or outcome measurement is likely to be influenced by lack of blinding.
-
Blinding of key study participants and personnel attempted, but likely that the blinding could have been broken.
-
Either participants or some key study personnel were not blinded, and the non‐blinding of others was likely to introduce bias.
Unclear
Any one of the following.
-
Insufficient information provided to permit a judgement of low or high risk of bias.
-
The study did not address this outcome.
4. Were incomplete outcome data adequately addressed?
Low risk of bias
Any one of the following.
-
No missing outcome data.
-
Reasons for missing outcome data unlikely to be related to true outcome (for survival data, censoring unlikely to be introducing bias).
-
Missing outcome data balanced in numbers across intervention groups, with similar reasons for missing data across groups.
-
For dichotomous outcome data, the proportion of missing outcomes compared with observed event risk not enough to have a clinically relevant impact on the intervention effect estimate.
-
For continuous outcome data, plausible effect size (difference in means or standardised difference in means) among missing outcomes not enough to have a clinically relevant impact on observed effect size.
-
Missing data have been imputed using appropriate methods.
High risk of bias
Any one of the following.
-
Reason for missing outcome data likely to be related to true outcome, with either imbalance in numbers or reasons for missing data across intervention groups.
-
For dichotomous outcome data, the proportion of missing outcomes compared with observed event risk enough to induce clinically relevant bias in intervention effect estimate.
-
For continuous outcome data, plausible effect size (difference in means or standardised difference in means) among missing outcomes enough to induce clinically relevant bias in observed effect size.
-
‘As‐treated’ analysis done with substantial departure of the intervention received from that assigned at randomisation.
-
Potentially inappropriate application of simple imputation.
Unclear
Either of the following.
-
Insufficient reporting of attrition/exclusions to permit judgement of low or high risk of bias (e.g. number randomised not stated, no reasons for missing data provided).
-
The study did not address this outcome.
5. Are reports of the study free of suggestion of selective outcome reporting?
Low risk of bias
Either of the following.
-
The study protocol is available and all of the study’s pre‐specified (primary and secondary) outcomes that are of interest in the review have been reported in the pre‐specified way.
-
The study protocol is not available but it is clear that the published reports include all expected outcomes, including those that were pre‐specified (convincing text of this nature may be uncommon).
High risk of bias
Any one of the following.
-
Not all of the study’s pre‐specified primary outcomes have been reported.
-
One or more primary outcomes are reported using measurements, analysis methods or subsets of the data (e.g. subscales) that were not pre‐specified.
-
One or more reported primary outcomes were not pre‐specified (unless clear justification for their reporting is provided, such as an unexpected adverse effect).
-
One or more outcomes of interest in the review are reported incompletely so that they cannot be entered in a meta‐analysis.
-
The study report fails to include results for a key outcome that would be expected to have been reported for such a study.
Unclear:
Insufficient information to permit judgement of low or high risk of bias. It is likely that the majority of studies will fall into this category.
6. Other sources of potential bias
Low risk of bias
The study appears to be free of other sources of bias.
High risk of bias
There is at least one important risk of bias. For example, the study:
-
had a potential source of bias related to the specific study design used; or
-
has been claimed to have been fraudulent; or
-
had some other problem.
Unclear
There may be a risk of bias, but there is either:
-
insufficient information to assess whether an important risk of bias exists; or
-
insufficient rationale or evidence that an identified problem will introduce bias.

Risk of bias summary: review authors' judgements about each risk of bias item for each included study

Risk of bias graph: review authors' judgements about each risk of bias item presented as percentages across all included studies
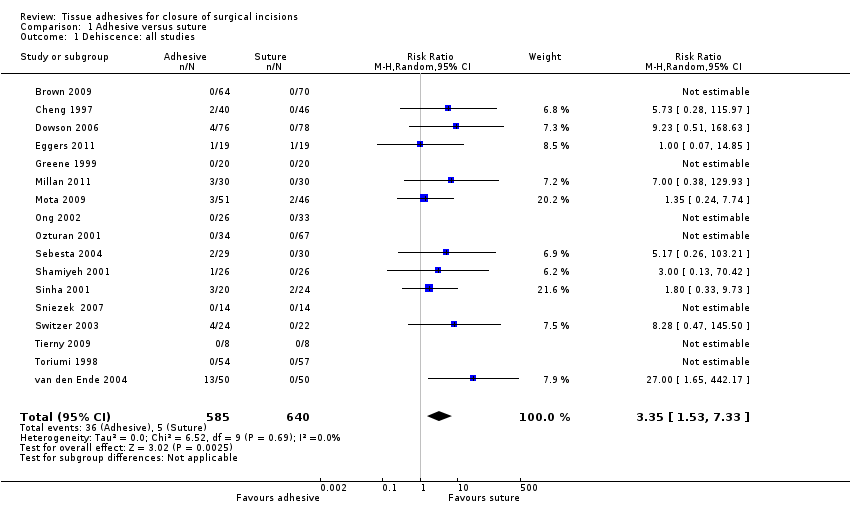
Comparison 1 Adhesive versus suture, Outcome 1 Dehiscence: all studies.
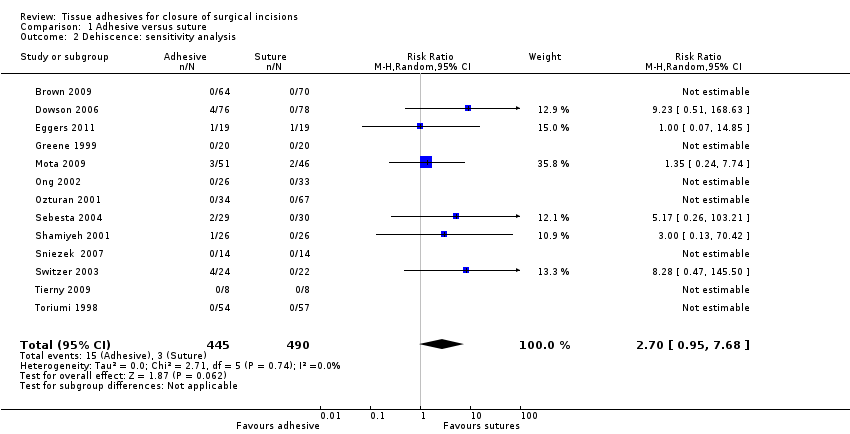
Comparison 1 Adhesive versus suture, Outcome 2 Dehiscence: sensitivity analysis.
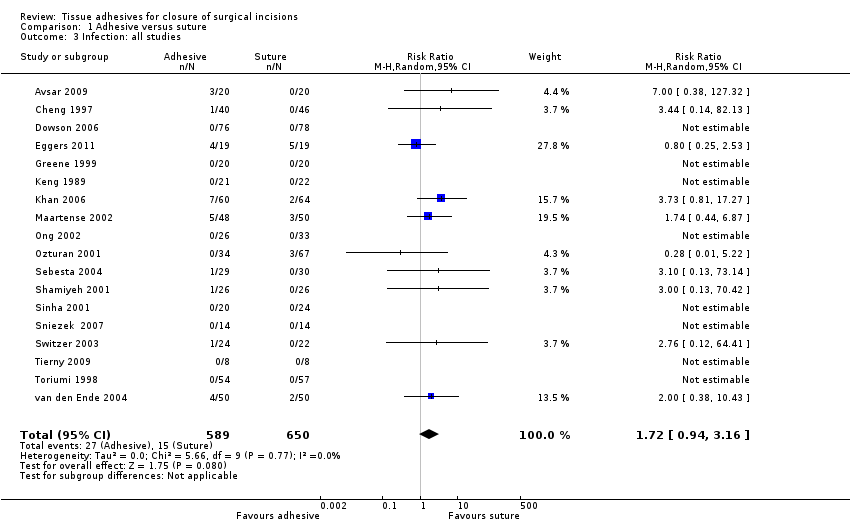
Comparison 1 Adhesive versus suture, Outcome 3 Infection: all studies.
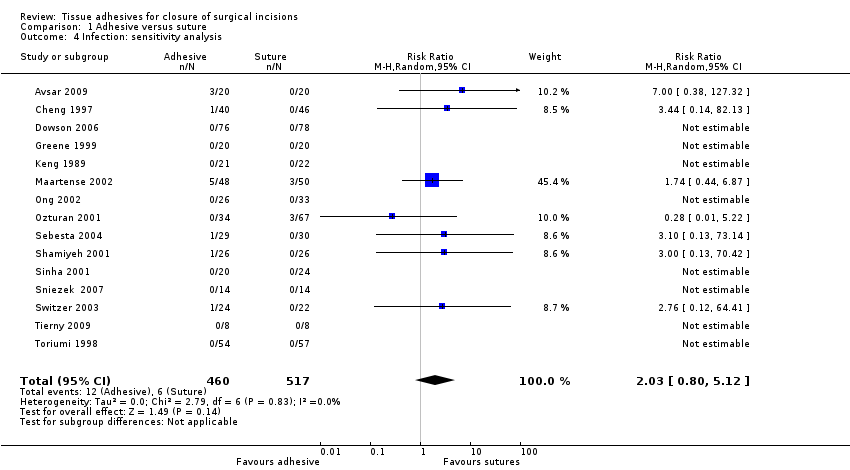
Comparison 1 Adhesive versus suture, Outcome 4 Infection: sensitivity analysis.

Comparison 1 Adhesive versus suture, Outcome 5 Cosmetic appearance rated by patient.
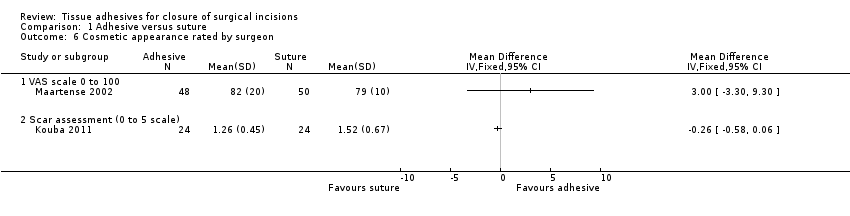
Comparison 1 Adhesive versus suture, Outcome 6 Cosmetic appearance rated by surgeon.

Comparison 1 Adhesive versus suture, Outcome 7 Patient/parent satisfaction (% satisfied).
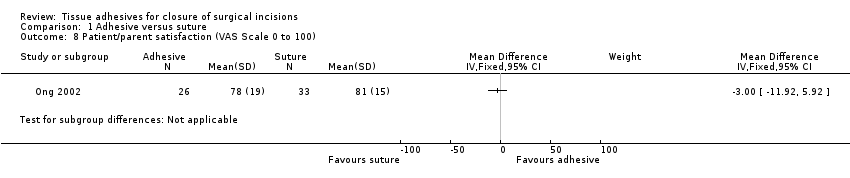
Comparison 1 Adhesive versus suture, Outcome 8 Patient/parent satisfaction (VAS Scale 0 to 100).

Comparison 1 Adhesive versus suture, Outcome 9 Surgeon satisfaction (% satisfied).
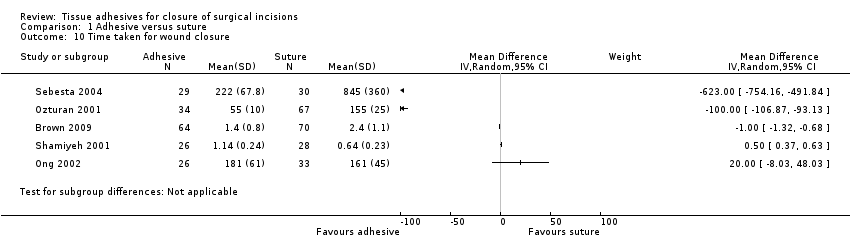
Comparison 1 Adhesive versus suture, Outcome 10 Time taken for wound closure.
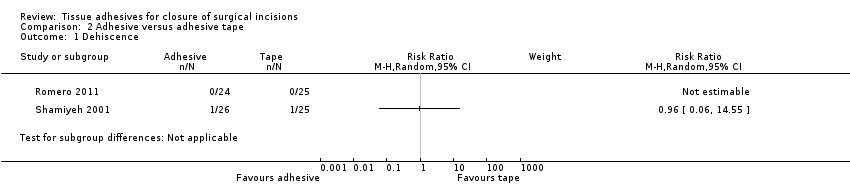
Comparison 2 Adhesive versus adhesive tape, Outcome 1 Dehiscence.
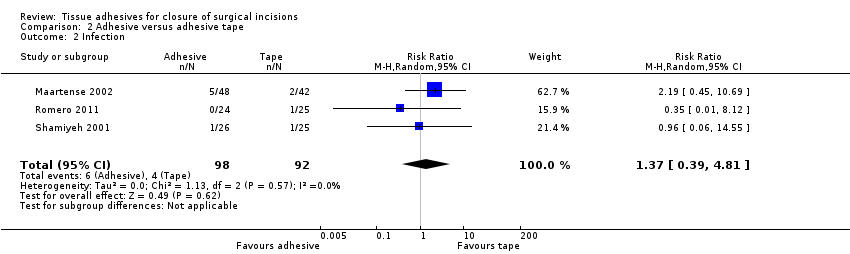
Comparison 2 Adhesive versus adhesive tape, Outcome 2 Infection.
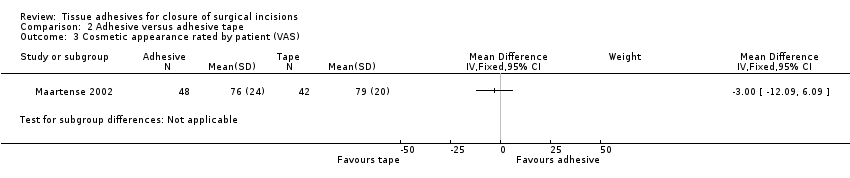
Comparison 2 Adhesive versus adhesive tape, Outcome 3 Cosmetic appearance rated by patient (VAS).

Comparison 2 Adhesive versus adhesive tape, Outcome 4 Cosmetic appearance rated by patient (% satisfied).
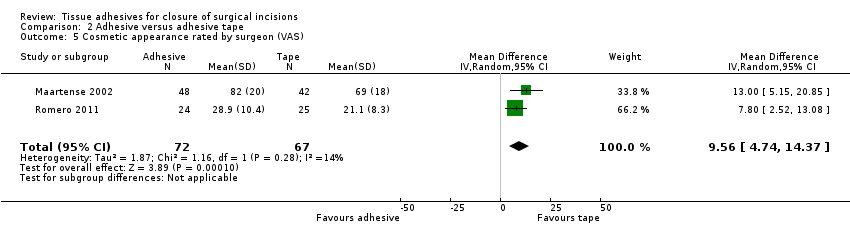
Comparison 2 Adhesive versus adhesive tape, Outcome 5 Cosmetic appearance rated by surgeon (VAS).

Comparison 2 Adhesive versus adhesive tape, Outcome 6 Patient satisfaction.
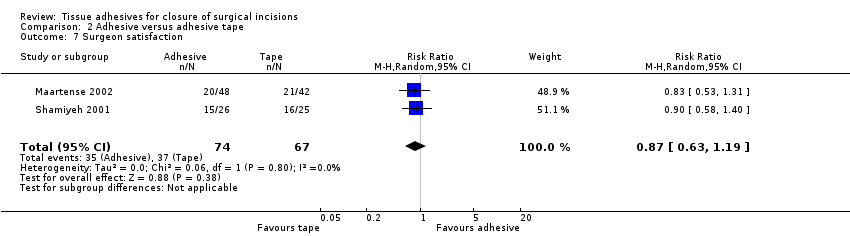
Comparison 2 Adhesive versus adhesive tape, Outcome 7 Surgeon satisfaction.
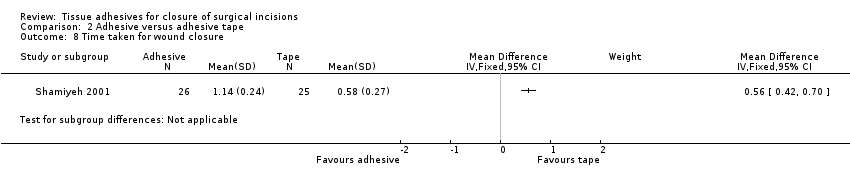
Comparison 2 Adhesive versus adhesive tape, Outcome 8 Time taken for wound closure.

Comparison 3 Adhesive versus staples, Outcome 1 Dehiscence.

Comparison 3 Adhesive versus staples, Outcome 2 Infection.

Comparison 3 Adhesive versus staples, Outcome 3 Cosmetic appearance rated by patient (scar scale).

Comparison 3 Adhesive versus staples, Outcome 4 Cosmetic appearance by plastic surgeons (VAS).
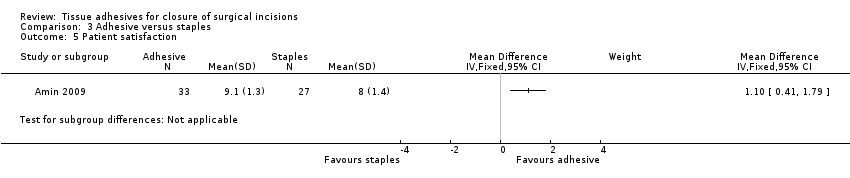
Comparison 3 Adhesive versus staples, Outcome 5 Patient satisfaction.
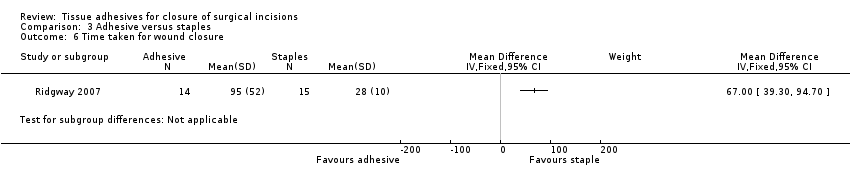
Comparison 3 Adhesive versus staples, Outcome 6 Time taken for wound closure.
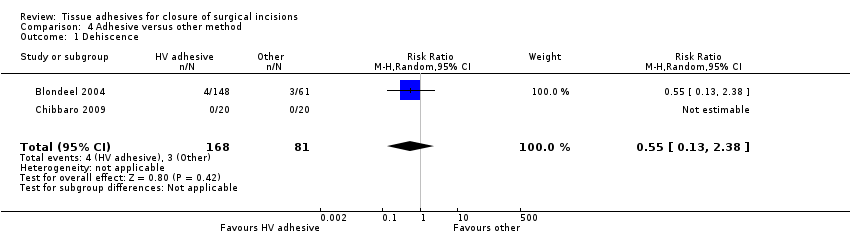
Comparison 4 Adhesive versus other method, Outcome 1 Dehiscence.

Comparison 4 Adhesive versus other method, Outcome 2 Infection.

Comparison 4 Adhesive versus other method, Outcome 3 Patient satisfaction.
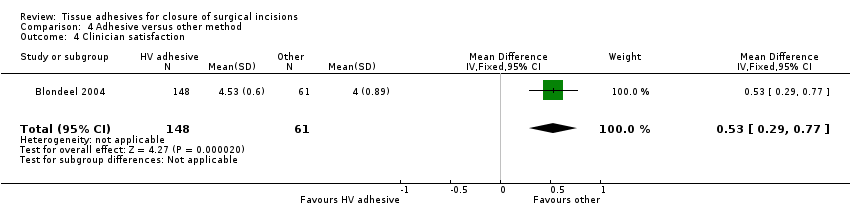
Comparison 4 Adhesive versus other method, Outcome 4 Clinician satisfaction.
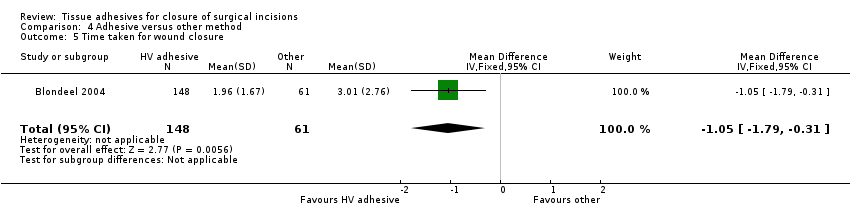
Comparison 4 Adhesive versus other method, Outcome 5 Time taken for wound closure.

Comparison 5 Adhesive versus adhesive: High viscosity versus low viscosity, Outcome 1 Dehiscence.
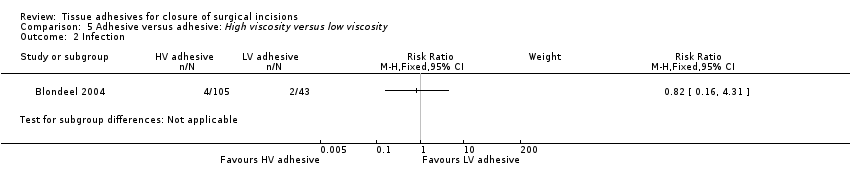
Comparison 5 Adhesive versus adhesive: High viscosity versus low viscosity, Outcome 2 Infection.

Comparison 5 Adhesive versus adhesive: High viscosity versus low viscosity, Outcome 3 Patient satisfaction.
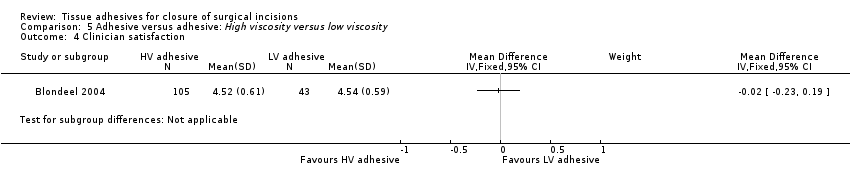
Comparison 5 Adhesive versus adhesive: High viscosity versus low viscosity, Outcome 4 Clinician satisfaction.
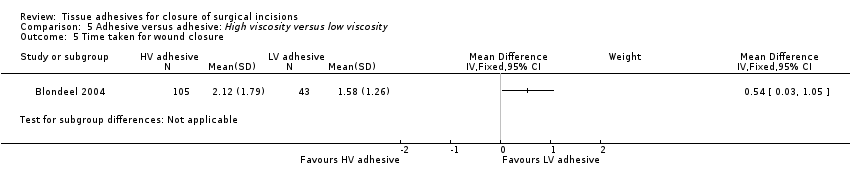
Comparison 5 Adhesive versus adhesive: High viscosity versus low viscosity, Outcome 5 Time taken for wound closure.
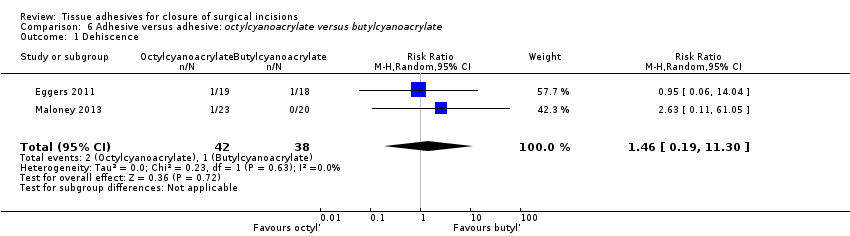
Comparison 6 Adhesive versus adhesive: octylcyanoacrylate versus butylcyanoacrylate, Outcome 1 Dehiscence.
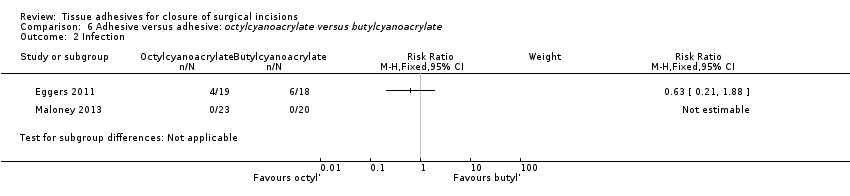
Comparison 6 Adhesive versus adhesive: octylcyanoacrylate versus butylcyanoacrylate, Outcome 2 Infection.
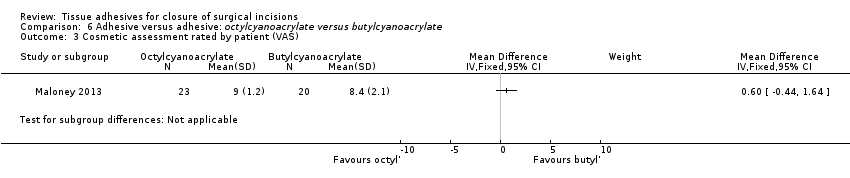
Comparison 6 Adhesive versus adhesive: octylcyanoacrylate versus butylcyanoacrylate, Outcome 3 Cosmetic assessment rated by patient (VAS).

Comparison 6 Adhesive versus adhesive: octylcyanoacrylate versus butylcyanoacrylate, Outcome 4 Cosmetic assessment rated by surgeon (VAS).
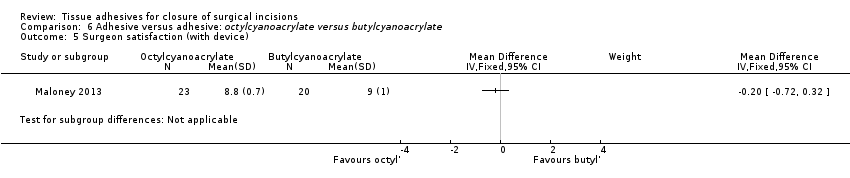
Comparison 6 Adhesive versus adhesive: octylcyanoacrylate versus butylcyanoacrylate, Outcome 5 Surgeon satisfaction (with device).

Comparison 6 Adhesive versus adhesive: octylcyanoacrylate versus butylcyanoacrylate, Outcome 6 Surgeon satisfaction (with closure).

Comparison 6 Adhesive versus adhesive: octylcyanoacrylate versus butylcyanoacrylate, Outcome 7 Time taken for wound closure.
| Tissue adhesive compared to sutures for surgical incisions | ||||||
| Patient or population: People with surgical incisions | ||||||
| Outcomes | Illustrative comparative risks*4 (95% CI) | Relative effect | No of participants | Quality of the evidence | Comments | |
| Assumed risk | Corresponding risk | |||||
| Sutures | Tissue adhesive | |||||
| Wound dehiscence | Study population | RR 3.35 | 736 | ⊕⊕⊝⊝ | ||
| 13 per 1000 | 45 per 1000 | |||||
| Moderate | ||||||
| Wound infection | Study population | RR 1.72 | 744 | ⊕⊝⊝⊝ | ||
| 38 per 1000 | 76 per 1000 | |||||
| Moderate | ||||||
| *The basis for the assumed risk (e.g. the median control group risk across studies) is provided in footnotes. The corresponding risk (and its 95% confidence interval) is based on the assumed risk in the comparison group and the relative effect of the intervention (and its 95% CI) | ||||||
| GRADE Working Group grades of evidence | ||||||
| 1 Possible unit of analyses issues. A sensitivity analysis changes a statistically significant difference to a non‐statistically significant difference | ||||||
| Tissue adhesive compared to adhesive tape for surgical incisions | ||||||
| Patient or population: people with surgical incisions | ||||||
| Outcomes | Illustrative comparative risks*3 (95% CI) | Relative effect | No of participants | Quality of the evidence | Comments | |
| Assumed risk | Corresponding risk | |||||
| Adhesive tape | Tissue adhesive | |||||
| Wound dehiscence | Study population | RR 0.96 | 50 | ⊕⊕⊝⊝ | ||
| 42 per 1000 | 40 per 1000 | |||||
| Moderate | ||||||
| Wound infection | Study population | RR 1.37 | 190 | ⊕⊕⊝⊝ | ||
| 43 per 1000 | 60 per 1000 | |||||
| Moderate | ||||||
| *The basis for the assumed risk (e.g. the median control group risk across studies) is provided in footnotes. The corresponding risk (and its 95% confidence interval) is based on the assumed risk in the comparison group and the relative effect of the intervention (and its 95% CI) | ||||||
| GRADE Working Group grades of evidence | ||||||
| 1 Study 95% CIs are very wide | ||||||
| Tissue adhesive compared to staples for surgical incisions | ||||||
| Patient or population: people with surgical incisions | ||||||
| Outcomes | Illustrative comparative risks*3 (95% CI) | Relative effect | No of participants | Quality of the evidence | Comments | |
| Assumed risk | Corresponding risk | |||||
| Staples | Tissue adhesive | |||||
| Wound dehiscence | Study population | RR 0.53 | 37 | ⊕⊕⊝⊝ | ||
| 105 per 1000 | 56 per 1000 | |||||
| Moderate | ||||||
| Wound infection | Study population | RR 1.39 | 250 | ⊕⊝⊝⊝ | ||
| 71 per 1000 | 99 per 1000 | |||||
| Moderate | ||||||
| *The basis for the assumed risk (e.g. the median control group risk across studies) is provided in footnotes. The corresponding risk (and its 95% confidence interval) is based on the assumed risk in the comparison group and the relative effect of the intervention (and its 95% CI). | ||||||
| GRADE Working Group grades of evidence | ||||||
| 1 Study 95% CIs are very wide. | ||||||
| Tissue adhesive compared to other methods for surgical incisions | ||||||
| Patient or population: people with surgical incisions | ||||||
| Outcomes | Illustrative comparative risks* (95% CI) | Relative effect | No of participants | Quality of the evidence | Comments | |
| Assumed risk | Corresponding risk | |||||
| Other methods | Tissue adhesive | |||||
| Wound dehiscence | Study population | RR 0.55 | 209 | ⊕⊕⊝⊝ | ||
| 49 per 1000 | 27 per 1000 | |||||
| Moderate | ||||||
| Wound infection | Study population | RR 0.41 | 209 | ⊕⊕⊝⊝ | ||
| 66 per 1000 | 27 per 1000 | |||||
| Moderate | ||||||
| *The basis for the assumed risk (e.g. the median control group risk across studies) is provided in footnotes. The corresponding risk (and its 95% confidence interval) is based on the assumed risk in the comparison group and the relative effect of the intervention (and its 95% CI) | ||||||
| GRADE Working Group grades of evidence | ||||||
| 1 Study 95% CIs are very wide | ||||||
| High viscosity tissue adhesive compared to low viscosity tissue adhesive for surgical incisions | ||||||
| Patient or population: people with surgical incisions | ||||||
| Outcomes | Illustrative comparative risks* (95% CI) | Relative effect | No of participants | Quality of the evidence | Comments | |
| Assumed risk | Corresponding risk | |||||
| Low viscosity tissue adhesive | High viscosity tissue adhesive | |||||
| Wound dehiscence | Study population | RR 3.74 | 148 | ⊕⊝⊝⊝ | ||
| Could not be calculated | Could not be calculated | |||||
| Wound infection | Study population | RR 0.82 | 148 | ⊕⊝⊝⊝ | ||
| 47 per 1000 | 38 per 1000 | |||||
| Moderate | ||||||
| *The basis for the assumed risk (e.g. the median control group risk across studies) is provided in footnotes. The corresponding risk (and its 95% confidence interval) is based on the assumed risk in the comparison group and the relative effect of the intervention (and its 95% CI) | ||||||
| GRADE Working Group grades of evidence | ||||||
| 1 Study 95% CIs are very wide | ||||||
| Octylcyanoacrylate compared to butylcyanoacrylate for surgical incisions | ||||||
| Patient or population: people with surgical incisions | ||||||
| Outcomes | Illustrative comparative risks*2 (95% CI) | Relative effect | No of participants | Quality of the evidence | Comments | |
| Assumed risk | Corresponding risk | |||||
| Butylcyanoacrylate | Octylcyanoacrylate | |||||
| Wound dehiscence | 26 per 1000 | 38 per 1000 (5 to 297) | RR 1.46 (0.19 to 11) | 80 | ⊕⊕⊝⊝ | |
| Wound infection | Study population | RR 0.63 | 37 | ⊕⊕⊝⊝ | ||
| 333 per 1000 | 210 per 1000 | |||||
| Moderate | ||||||
| *The basis for the assumed risk (e.g. the median control group risk across studies) is provided in footnotes. The corresponding risk (and its 95% confidence interval) is based on the assumed risk in the comparison group and the relative effect of the intervention (and its 95% CI) | ||||||
| GRADE Working Group grades of evidence | ||||||
| 1 The 95% CI estimate around the RR of 1.46 is very wide | ||||||
| Tissue adhesive vs tissue adhesive (Comp 5) | Mixed control (Comp 4) | Butyl‐2‐ cyanoacrylate vs staples (Comp 3) | 2‐octyl cyanoacrylate vs staples (Comp 3) | 2‐octyl cyanoacrylate vs tape (Comp 2) | Butyl‐2‐ cyanoacrylate vs sutures (Comp 1) | 2‐octyl cyanoacrylate vs sutures (Comp1) | Trial ID | 2‐octyl cyanoacrylate | Butyl‐2‐ cyanoacrylate | Sutures | Staples | Adhesive tape/strips | Mixed sutures and staples | All non‐tissue adhesive closure methods | Other viscosity 2‐octyl cyanoacrylate |
| 3 | ✓ | ✓ | |||||||||||||
| 1 | ✓ | ✓ | |||||||||||||
| 5 | 4 | ✓ | ✓ | ✓ | |||||||||||
| 1 | ✓ | ✓ | |||||||||||||
| 1 | ✓ | ✓ | |||||||||||||
| 4 | ✓ | ✓ | |||||||||||||
| 1 | ✓ | ✓ | |||||||||||||
| 5 | 3 | 3 | 1 | 1 | ✓ | ✓ | ✓ | ✓ | |||||||
| 1 | ✓ | ✓ | |||||||||||||
| 1 | ✓ | ✓ | |||||||||||||
| 1 | ✓ | ✓ | |||||||||||||
| 5 | ✓ | ✓ | |||||||||||||
| 3 | 1 | ✓ | ✓ | ✓ | |||||||||||
| 1 | ✓ | ✓ | |||||||||||||
| 1 | ✓ | ✓ | |||||||||||||
| 3 | ✓ | ✓ | |||||||||||||
| 2 | 1 | ✓ | ✓ | ✓ | |||||||||||
| 5 | ✓ | ✓ | |||||||||||||
| 1 | ✓ | ✓ | |||||||||||||
| 1 | ✓ | ✓ | |||||||||||||
| 1 | ✓ | ✓ | |||||||||||||
| 1 | ✓ | ✓ | |||||||||||||
| 3 | ✓ | ✓ | |||||||||||||
| 3 | ✓ | ✓ | |||||||||||||
| 1 | ✓ | ✓ | |||||||||||||
| 2 | 1 | ✓ | ✓ | ✓ | |||||||||||
| 1 | ✓ | ✓ | |||||||||||||
| 1 | ✓ | ✓ | |||||||||||||
| 1 | ✓ | ✓ | |||||||||||||
| 1 | ✓ | ✓ | |||||||||||||
| 1 | ✓ | ✓ | |||||||||||||
| 2 | ✓ | ✓ | |||||||||||||
| 1 | ✓ | ✓ | |||||||||||||
| Abbreviation Comp = comparison | |||||||||||||||
| Outcome or subgroup title | No. of studies | No. of participants | Statistical method | Effect size |
| 1 Dehiscence: all studies Show forest plot | 17 | 1225 | Risk Ratio (M‐H, Random, 95% CI) | 3.35 [1.53, 7.33] |
| 2 Dehiscence: sensitivity analysis Show forest plot | 13 | 935 | Risk Ratio (M‐H, Random, 95% CI) | 2.70 [0.95, 7.68] |
| 3 Infection: all studies Show forest plot | 18 | 1239 | Risk Ratio (M‐H, Random, 95% CI) | 1.72 [0.94, 3.16] |
| 4 Infection: sensitivity analysis Show forest plot | 15 | 977 | Risk Ratio (M‐H, Random, 95% CI) | 2.03 [0.80, 5.12] |
| 5 Cosmetic appearance rated by patient Show forest plot | 2 | 199 | Mean Difference (IV, Random, 95% CI) | ‐2.12 [‐7.20, 2.95] |
| 5.1 VAS 0 to 100 | 2 | 199 | Mean Difference (IV, Random, 95% CI) | ‐2.12 [‐7.20, 2.95] |
| 6 Cosmetic appearance rated by surgeon Show forest plot | 2 | Mean Difference (IV, Fixed, 95% CI) | Totals not selected | |
| 6.1 VAS scale 0 to 100 | 1 | Mean Difference (IV, Fixed, 95% CI) | 0.0 [0.0, 0.0] | |
| 6.2 Scar assessment (0 to 5 scale) | 1 | Mean Difference (IV, Fixed, 95% CI) | 0.0 [0.0, 0.0] | |
| 7 Patient/parent satisfaction (% satisfied) Show forest plot | 2 | 206 | Risk Ratio (M‐H, Random, 95% CI) | 1.01 [0.96, 1.07] |
| 8 Patient/parent satisfaction (VAS Scale 0 to 100) Show forest plot | 1 | Mean Difference (IV, Fixed, 95% CI) | Subtotals only | |
| 9 Surgeon satisfaction (% satisfied) Show forest plot | 2 | 150 | Risk Ratio (M‐H, Random, 95% CI) | 1.12 [0.58, 2.19] |
| 10 Time taken for wound closure Show forest plot | 5 | Mean Difference (IV, Random, 95% CI) | Subtotals only | |
| Outcome or subgroup title | No. of studies | No. of participants | Statistical method | Effect size |
| 1 Dehiscence Show forest plot | 2 | Risk Ratio (M‐H, Random, 95% CI) | Subtotals only | |
| 2 Infection Show forest plot | 3 | 190 | Risk Ratio (M‐H, Random, 95% CI) | 1.37 [0.39, 4.81] |
| 3 Cosmetic appearance rated by patient (VAS) Show forest plot | 1 | Mean Difference (IV, Fixed, 95% CI) | Subtotals only | |
| 4 Cosmetic appearance rated by patient (% satisfied) Show forest plot | 1 | Risk Ratio (M‐H, Fixed, 95% CI) | Subtotals only | |
| 5 Cosmetic appearance rated by surgeon (VAS) Show forest plot | 2 | 139 | Mean Difference (IV, Random, 95% CI) | 9.56 [4.74, 14.37] |
| 6 Patient satisfaction Show forest plot | 1 | Risk Ratio (M‐H, Fixed, 95% CI) | Subtotals only | |
| 7 Surgeon satisfaction Show forest plot | 2 | 141 | Risk Ratio (M‐H, Random, 95% CI) | 0.87 [0.63, 1.19] |
| 8 Time taken for wound closure Show forest plot | 1 | Mean Difference (IV, Fixed, 95% CI) | Subtotals only | |
| Outcome or subgroup title | No. of studies | No. of participants | Statistical method | Effect size |
| 1 Dehiscence Show forest plot | 2 | 107 | Risk Ratio (M‐H, Random, 95% CI) | 0.53 [0.05, 5.33] |
| 2 Infection Show forest plot | 4 | 320 | Risk Ratio (M‐H, Random, 95% CI) | 1.39 [0.30, 6.54] |
| 3 Cosmetic appearance rated by patient (scar scale) Show forest plot | 1 | Mean Difference (IV, Fixed, 95% CI) | Subtotals only | |
| 4 Cosmetic appearance by plastic surgeons (VAS) Show forest plot | 1 | Mean Difference (IV, Fixed, 95% CI) | Subtotals only | |
| 5 Patient satisfaction Show forest plot | 1 | Mean Difference (IV, Fixed, 95% CI) | Subtotals only | |
| 6 Time taken for wound closure Show forest plot | 1 | Mean Difference (IV, Fixed, 95% CI) | Subtotals only | |
| Outcome or subgroup title | No. of studies | No. of participants | Statistical method | Effect size |
| 1 Dehiscence Show forest plot | 2 | 249 | Risk Ratio (M‐H, Random, 95% CI) | 0.55 [0.13, 2.38] |
| 2 Infection Show forest plot | 2 | 249 | Risk Ratio (M‐H, Random, 95% CI) | 0.41 [0.11, 1.60] |
| 3 Patient satisfaction Show forest plot | 1 | 187 | Mean Difference (IV, Fixed, 95% CI) | 0.40 [0.10, 0.70] |
| 4 Clinician satisfaction Show forest plot | 1 | 209 | Mean Difference (IV, Fixed, 95% CI) | 0.53 [0.29, 0.77] |
| 5 Time taken for wound closure Show forest plot | 1 | 209 | Mean Difference (IV, Fixed, 95% CI) | ‐1.05 [‐1.79, ‐0.31] |
| Outcome or subgroup title | No. of studies | No. of participants | Statistical method | Effect size |
| 1 Dehiscence Show forest plot | 1 | Risk Ratio (M‐H, Fixed, 95% CI) | Subtotals only | |
| 2 Infection Show forest plot | 1 | Risk Ratio (M‐H, Fixed, 95% CI) | Subtotals only | |
| 3 Patient satisfaction Show forest plot | 1 | Mean Difference (IV, Fixed, 95% CI) | Subtotals only | |
| 4 Clinician satisfaction Show forest plot | 1 | Mean Difference (IV, Fixed, 95% CI) | Subtotals only | |
| 5 Time taken for wound closure Show forest plot | 1 | Mean Difference (IV, Fixed, 95% CI) | Subtotals only | |
| Outcome or subgroup title | No. of studies | No. of participants | Statistical method | Effect size |
| 1 Dehiscence Show forest plot | 2 | 80 | Risk Ratio (M‐H, Random, 95% CI) | 1.46 [0.19, 11.30] |
| 2 Infection Show forest plot | 2 | Risk Ratio (M‐H, Fixed, 95% CI) | Subtotals only | |
| 3 Cosmetic assessment rated by patient (VAS) Show forest plot | 1 | Mean Difference (IV, Fixed, 95% CI) | Subtotals only | |
| 4 Cosmetic assessment rated by surgeon (VAS) Show forest plot | 1 | Mean Difference (IV, Fixed, 95% CI) | Subtotals only | |
| 5 Surgeon satisfaction (with device) Show forest plot | 1 | Mean Difference (IV, Fixed, 95% CI) | Subtotals only | |
| 6 Surgeon satisfaction (with closure) Show forest plot | 1 | Mean Difference (IV, Fixed, 95% CI) | Subtotals only | |
| 7 Time taken for wound closure Show forest plot | 1 | Mean Difference (IV, Fixed, 95% CI) | Subtotals only | |