Contenido relacionado
Revisiones y protocolos relacionados
Prathap Tharyan, Clive E Adams | 20 abril 2005
Yan Liu, Bo Li, Stephanie J Sampson, Samantha Roberts, Guoyou Zhang, Weiping Wu | 19 mayo 2014
Juanjuan Ren, Jun Xia | 4 octubre 2013
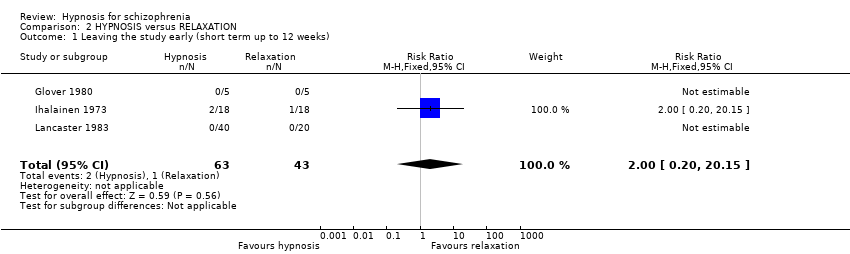
Rachel Ruddy, David Milnes | 19 octubre 2005
Charlotte J Crawford‐Walker, Adrian King, Sally Chan | 24 enero 2005
Xiaohong Shen, Jun Xia, Clive E Adams | 20 octubre 2014
Tom McMonagle, Alec Sultana | 24 julio 2000
Luciana de Oliveira Marques, Bernardo Soares, Mauricio Silva de Lima | 26 enero 2004
Christian Schwarz, Benno Hartung, Stefan Leucht | 20 abril 2005
Manit Srisurapanont, Benchalak Maneeton, Narong Maneeton, Sudheer Lankappa, Rahul Gandhi | 19 abril 2004